
RDP 2026-06: Perceived Monetary Policy Rules: Evidence from Professional Forecasters in Australia 5. What drives cash-rate disagreement?
October 2026
Thus far, we have focused on the average perceived reaction function across forecasters. A natural question is whether disagreement about future cash rates reflects heterogeneity in perceived policy rules, or instead differences in expectations about future economic conditions. The distinction has important implications for central bank communication. If disagreement primarily reflects uncertainty about the reaction function, clearer guidance about the policy framework may be most effective. If, instead, disagreement mainly reflects differing views about the economic outlook, communication may be better directed toward clarifying the assessment of incoming data and risks.
To address this question, we examine how well each forecaster's own outlook explains their expected cash rate at a given survey date, under the maintained assumption of a common perceived reaction function. Specifically, we estimate the survey-based Taylor-rule regressions described above and track the rolling R2 from the forecaster–horizon panels. A high R2 indicates that most dispersion in expected interest rates is accounted for by differences in expected conditions, while a low R2 suggests a greater role for disagreement about the policy rule itself. Alternatively, low fit may also reflect disagreement about omitted policy-relevant variables or model misspecification, such as nonlinearities. We conduct this analysis using the static specification, as interpreting disagreement in the inertial model is complicated by the fact that past disagreement is mechanically propagated through the lagged interest rate term.
Disagreement in the level of expected cash rates is sizable at key turning points. As shown in Figure 10, the cross-sectional range of one- and two-year-ahead expectations is roughly 1 and percentage points, respectively, during 2015–2019. It collapses toward zero at the effective lower bound, widens sharply through 2021 as lift-off approaches, and then narrows again toward historical norms in 2023–2024.
Figure 17 shows that for most of the sample, 60–80 per cent of the variation in expected cash rates is explained by differences in forecasters' own outlooks. Roughly half of this explanatory power reflects heterogeneity in beliefs about long-run “star” variables, such as the neutral rate (r*), the NAIRU (u*), and long-run inflation .[11]
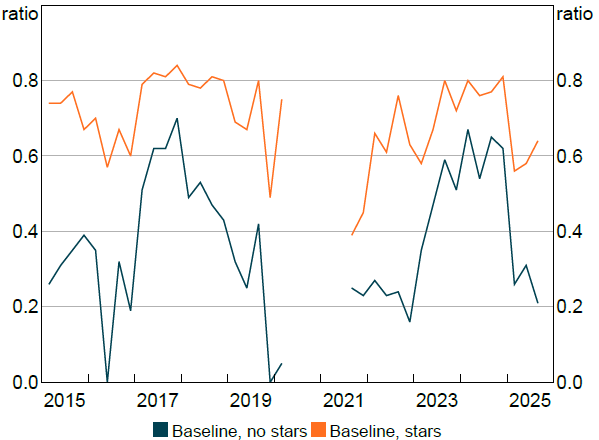
Note: Rolling R-squared from estimation of simple policy rule on surveys quarter-by-quarter. ‘Baseline, stars’ allows for forecaster-specific assessments of star variables using forecaster fixed effects. ‘Baseline, no stars’ assumes a common view on star variables.
Three episodes stand out. First, in 2016 the R2 declines, consistent with a period in which communication elevated housing and financial-stability considerations, and markets inferred a relatively weak inflation response. The reduction in explainability could reflect disagreement about the reaction function itself, specifically the relative weight placed on inflation versus financial-stability objectives. Alternatively, it may reflect disagreement about the outlook for those additional considerations, which are omitted from the baseline rule. Without direct forecasts for housing prices or related variables we cannot disentangle these channels. Nevertheless, in either case the episode reinforces earlier findings that communication around financial stability considerations had important implications for perceived policy rules.
A second decline in fit occurs in 2022–2023, coinciding with a renewed widening in the dispersion of cash-rate expectations (Figure 10). Part of this appears to reflect the perceived importance of wage outcomes in the policy rule during this period, coupled with disagreement about wage dynamics. Consistent with this interpretation, augmenting the rule to include wage growth (WPI) substantially attenuates the decline in R2 (Figure 18).
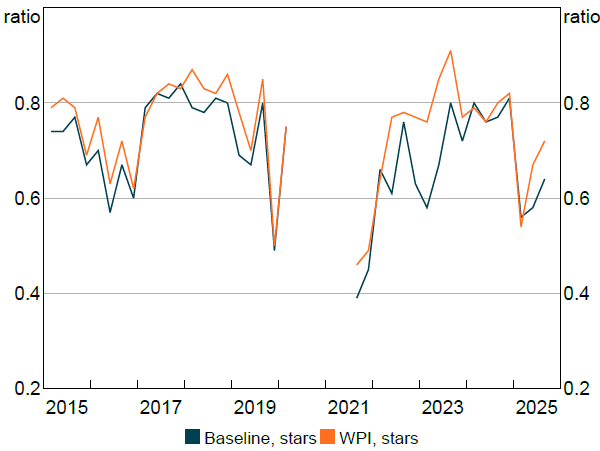
Note: Rolling R-squared from estimation of simple policy rule on surveys quarter-by-quarter. ‘Baseline, stars’ allows for forecaster-specific assessments of star variables using forecaster fixed effects. ‘WPI, no stars’ assumes wages growth (WPI) enters the policy rule.
One final period of note is 2025, when explainability declines again even after including wage growth in the specification. This suggests a renewed increase in disagreement about the reaction function, or about other policy-relevant considerations not captured in the baseline rule. There is less of a clear narrative as to the cause of this increased disagreement. One possible contributing factor could be the institutional and communication changes associated with the Review of the Reserve Bank of Australia and its subsequent implementation (RBA Review Panel 2023). The transition period as they were implemented could have led to a period of increased uncertainty about the reaction function. However, it is also very possible that the increase in disagreement reflects other factors, including the fact that inflation had been above the band for a number of years.
Taken together, these patterns reinforce a broader narrative: clearer guidance about which observable conditions are relevant for policy decisions tends to align beliefs about the reaction function and reduce disagreement. When market participants infer that additional conditioning variables have entered the policy rule, disagreement naturally increases.
Footnote
11 We assess the contribution of star-variable beliefs by comparing rolling R2 values from specifications that include forecaster-specific fixed effects that absorb r*, u* and , with variants that omit them. The resulting change in fit provides an indicative decomposition.