
RDP 2026-06: Perceived Monetary Policy Rules: Evidence from Professional Forecasters in Australia 3. The Average Perceived Reaction Function
October 2026
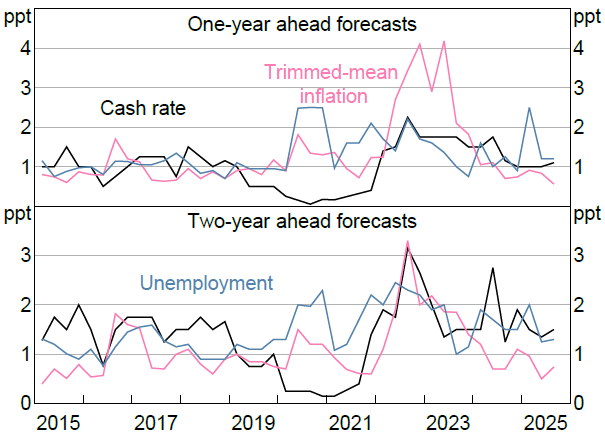
We begin by examining the average perceived reaction function over the pre-COVID-19 period. This provides a benchmark for assessing how market perceptions compare with the Taylor rules embedded in standard policy models.
Table 1 reports estimates from two specifications: one without policy inertia and one allowing for a lagged cash rate. Both specifications imply similar short-run responses to inflation and unemployment.
Sources: Authors' calculation; RBA
A one percentage point increase in unemployment is perceived to lower the cash rate by around 80 basis points, while a one percentage point increase in inflation is perceived to raise the cash rate by roughly 25 basis points. Under the inertial specification, these imply long-run responses of approximately 350 basis points to unemployment and 115 basis points to inflation.[3]
Relative to benchmark policy rules, the perceived response to unemployment is somewhat stronger, while the perceived response to inflation is noticeably weaker. In particular, the inflation coefficient is well below that implied by the Taylor rule in the RBA's macro-econometric MARTIN model, which is calibrated rather than estimated (Ballantyne et al 2020). The perceived inflation response is closer to, but still below, the long-run response estimated in the RBA's DSGE model (Gibbs et al 2018).
These differences have direct implications for how interest rate expectations respond to economic news. Consider the September quarter 2025 CPI release, in which trimmed-mean year-on-year inflation was around 0.3 percentage points above median market expectations. Applying the MARTIN rule would imply an increase in the cash rate of roughly 18 basis points using the short-run coefficient. Under the perceived rule, the implied response is closer to 8 basis points. In practice, yields at the short end of the curve rose by around 10 basis points. The lower perceived inflation weight therefore helps explain the muted response of interest rate expectations to the inflation surprise, relative to what would have been predicted by the MARTIN and DSGE models.
| Perceptions no lagged cash rate | Perceptions lagged cash rate | MARTIN rule | DSGE | |
|---|---|---|---|---|
| Lagged cash rate | n/a | 0.764 (0.636, 0.892) |
0.700 | 0.870 (0.840, 0.890) |
| Inflation – short run | 0.218 (0.102, 0.334) |
0.272 (0.145, 0.398) |
0.600 | 0.195 |
| Inflation – long run | n/a | 1.152 | 2.000 | 1.540 (1.400, 1.700) |
| Unemployment – short run | −0.807 (−0.962, −0.652) |
−0.834 (−1.110, −0.558) |
−0.600 | n/a |
| Unemployment – long run | n/a | −3.535 | −2.000 | n/a |
| Notes: Output from estimation of perceived policy rules over the sample 2015-2019. | ||||
These findings also matter for the interpretation of macroeconomic models, particularly forward-looking DSGE frameworks. To the extent that such models embed stronger inflation responses than those perceived by market participants, they may overstate the stabilising role of systematic monetary policy on inflation. This highlights the value of considering alternative policy rules in model-based analysis as robustness, or considering extensions such as bounded rationality or myopia that dampen forward-looking dynamics.
Footnote
3 In the inertial specification, the long-run response is calculated as the short-run coefficient divided by , where is the estimated coefficient on the lagged cash rate.