
Research Discussion Paper – RDP 2026-06 Perceived Monetary Policy Rules: Evidence From Professional Forecasters in Australia
1. Introduction
Expectations about future interest rates play a central role in shaping economic behaviour. A key channel through which central banks influence these expectations — and thereby achieve their policy objectives — is by communicating and implementing a clear reaction function that maps economic conditions into policy decisions. When the reaction function is well understood, households and markets can respond directly to economic news without waiting for explicit guidance (Woodford 2005). Likewise, if agents believe that the central bank will respond forcefully to inflationary pressures, this belief can help anchor expectations, limit inflationary spirals, and reduce the trade-offs between stabilising inflation and unemployment. As a result, what private agents believe about a central bank's reaction function is a central determinant of monetary policy transmission.
Recent research has emphasised that the policy rule relevant for expectations formation and asset prices is the one perceived by market participants (Bauer, Pflueger and Sunderam 2024a; Bauer, Pflueger and Sunderam 2024b). These perceived rules can evolve over time and differ systematically from those embedded in structural macroeconomic models. Understanding how such perceptions are formed, how they change, and what drives belief updating is therefore crucial for both monetary policy design and communication.
Relatedly, in the Australian context the RBA Review Panel (2023) emphasises the importance of clear communication about policy strategy and the rationale for decisions, arguing that well-understood frameworks strengthen the effectiveness of monetary policy. Moreover, recent evidence suggests that markets have historically systematically misread how the RBA responds to economic data, indicating that market participants do not have a clear understanding of the RBA's reaction function (Hambur and Haque 2024). Quantifying perceived policy rules, how they change over time, and what drives them therefore speaks directly to both of these concerns.
Against this backdrop, we address the following questions. What reaction function do professional forecasters perceive the Reserve Bank of Australia to follow, and how have these perceptions evolved over time?
To answer these questions, we adapt the survey-based framework of Bauer et al (2024a) and Bauer et al (2024b) to the Australian context. Using forecaster-level data from the RBA Market Economist Survey from 2015 to 2025, we estimate Taylor-style rules that map expected inflation, unemployment, and — in extensions — wage growth into expected cash rates. We then relate shifts in the perceived reaction function to RBA communication and to high-frequency surprises around policy announcements. We also extend existing approaches by directly incorporating forecasters' perceptions of unobservable “star” variables, such as long-run inflation, the neutral interest rate, and the non-accelerating inflation rate of unemployment (NAIRU). This allows us to assess the extent to which heterogeneity in these long-run beliefs helps explain differences in interest rate expectations.
Our work extends the existing literature along a number of dimensions. First, we extend the literature to Australia, a small open economy with a long-standing inflation-targeting framework. While much of the existing evidence focuses on the United States and the euro area, examining Australia is informative for several reasons. Australia has operated under a stable monetary policy framework for decades, experienced a comparatively short effective lower bound episode, and faces inflation dynamics that are influenced by global forces. This allows us to study how market participants form and revise beliefs about policy function when the formal framework is unchanged, but uncertainty about policy implementation and economic conditions evolve over time.
As well as the country dimension, we extend on the existing literature along two methodological dimensions. First, we incorporate dynamic panel estimator approaches and consider how important they can be for the interpretation of the results. Second, we incorporate direct estimates of forecasters' views on unobservables, like long-run inflation and the neutral rate. This allows us to assess how effective existing approaches of removing these expectations using fixed effects are in practice. Directly incorporating these expectations also allow us to better understand how heterogeneous such expectations are, their role in influencing rate expectations.
Several findings and lessons emerge. First, markets perceive the RBA to be less reactive to inflation than captured in some other metrics. In particular, on average over the pre–COVID-19 period, market participants perceived that the RBA placed a lower weight on inflation than is embodied in many of the RBA's structural macroeconomic models, such as its macroeconometric model MARTIN Ballantyne et al (2020), or its DSGE model DINGO (Gibbs, Hambur and Nodari 2018). Accounting for these differences and what they imply about peoples' expectations for future policy is therefore important for policy analysis, scenario design, and the interpretation of yield curve movements.
Second, central bank communication can shape perceptions of the reaction function. During the mid-2010s, markets inferred that the RBA would not respond strongly to variation in inflation, coinciding with communication that emphasised housing and financial stability risks. Following the COVID-19 recession, language stressing the importance of preserving labour market gains aligned with a temporary strengthening in the perceived responsiveness to unemployment during 2021–22. Similarly, repeated references to the need to see wages growth before policy lift-off led to an increase in the perceived weight placed on wages growth in the RBA's reaction function.
Third, we show that sometimes actions speak louder than words, particularly during periods of elevated uncertainty. Coming out of COVID-19, despite increasingly hawkish communication perceptions of the weight the RBA placed on inflation did not adjust materially until after policy rates began to rise. As rate increases accumulated through 2022–23, the perceived inflation coefficient rose sharply, reflecting a reassessment of the Bank's commitment to returning inflation to target. These patterns closely mirror findings for the United States and the euro area (Bauer et al 2024a).
What explains the delayed adjustment in perceived inflation responsiveness despite large inflation surprises and hawkish communication? We show that this timing cannot be attributed to beliefs that inflation was transitory or to perceptions of a persistent “lower-for-longer” policy framework. Instead, the evidence points to a learning mechanism under uncertainty: with substantial disagreement about when and how forcefully the RBA would tighten, forecasters waited for sustained policy actions before revising their views about the reaction function. As in Bauer et al (2024a) and Haba, Hirano, Ito and Kaihatsu (2026), realised actions—rather than forward guidance alone—ultimately re-anchored beliefs during this period.
Fourth, we find that most disagreement about future interest rates reflects disagreement about future economic conditions and long-run “star” variables, rather than disagreement about the reaction function itself. On average, only around 30 per cent of disagreement in interest rate expectations is attributable to differences in perceived policy responses, although this share rises during certain periods, such as in 2025. This suggests that communication may be most effective at reducing disagreement when targeted at shaping views about economic conditions.
Finally, variation in long-run inflation expectations is moderate but economically important. Differences in long-run inflation beliefs account for a substantial share of variation in interest rate expectations, and failing to allow for such heterogeneity leads to markedly lower estimates of the perceived inflation coefficient. This indicates that long-run beliefs are not merely noise, but form a core component of forecasters' broader economic outlooks. This support the use of forecaster fixed effects in the literature, which appear to do a good job standing in for explicit star variable estimates.
Taken together, these findings underscore the importance of clear and targeted communication, supported by credible policy actions, in shaping interest rate expectations. They also demonstrate a practical set of tools that can be used to assess whether central bank communication is being interpreted as intended.
Our paper relates to a growing literature documenting that monetary policy surprises are partly predictable using information available prior to policy announcements. Hambur and Haque (2024) show that policy surprises around the RBA's announcements were partly predictable from publicly available information, while Bauer and Swanson (2023) find similar evidence for the United States. These findings challenge the interpretation of high-frequency monetary policy surprises as fully exogenous shocks and instead point to an important role for learning about the central bank's reaction function. This perspective is consistent with the broader idea that asset prices and expectations are governed by a market-perceived policy rule, an object that can be inferred from market responses to macroeconomic information, but which we study directly using survey expectations (Hamilton, Pruitt and Borger 2011).
Most closely related to our work are Bauer et al (2024a) and Bauer et al (2024b), who document substantial time variation in perceived monetary policy reaction functions in the United States over long samples, and during the COVID period in the United States and the euro area. This literature emphasises that the object relevant for expectations formation and financial market reactions is the policy rule inferred by private agents. More broadly, a growing body of work uses survey expectations to estimate perceived policy rules, particularly in environments where conventional estimation is complicated by the effective lower bound. For example, Fujiwara, Nakazono and Ueda (2015) use survey data for Japan to examine whether aggressive monetary easing induced a perceived regime change, while Haba et al (2026) estimate a time-varying perceived policy rule for Japan using bond-market survey microdata and show that perceived inflation responsiveness rose only after actual policy tightening began. Kim and Pruitt (2017) and Bundick (2015) exploit forecasters' expectations to estimate perceived Federal Reserve policy rules during the zero lower bound period. Complementing this, recent work treats central bank communication itself as rule-like and time-varying, arguing that shifts in the “communication rule” can generate periods of learning (Gáti and Handlan 2022).
The remainder of the paper proceeds as follows. Section 2 describes the data, methodology, and identification strategy. Section 3 presents estimates of the average perceived reaction function. Section 4 documents the evolution of the perceived reaction function over time, including the pre- and post-COVID periods, the delayed response of perceived inflation weights, and the role of “star” variables. Section 5 examines heterogeneity in forecasters' expectations, and Section 6 concludes with implications for communication and policy strategy.
2. Methodology
As noted above, we build on the survey-based approach developed by Bauer et al (2024a) and Bauer et al (2024b). This framework estimates perceived Taylor rules by exploiting variation in professional forecasters' expectations for interest rates, inflation, and economic activity across horizons. Relative to these earlier papers, we focus on unemployment rather than output gaps as our measure of economic slack and employ dynamic panel estimators to account for policy inertia. This section outlines the framework, data, estimation approach, and identification assumptions.
2.1 Framework
We assume that forecasters believe the RBA sets the policy interest rate according to a Taylor-style rule (Taylor 1993; Taylor 1999), in which the cash rate responds to deviations of inflation and unemployment from their long-run benchmarks, as well as to its own lagged value:
where captures policy inertia; and measure the responsiveness to inflation relative to its target and unemployment relative to the NAIRU denotes the neutral real interest rate; and is a monetary policy shock.
Under this perceived rule, forecaster j's expectation at time t of the cash rate at horizon h can be written as
where hats denote perceived policy parameters, and captures forecaster-specific views about future policy shocks or model misspecification.
We allow beliefs about long-run “star” variables — the neutral real rate, inflation target, and NAIRU — to vary across forecasters and over time, but not across horizons within a given survey. That is, forecasters may revise their views about long-run benchmarks over time, but conditional on information at time t they do not expect these benchmarks to evolve systematically over the forecast horizon. Similarly, while perceived policy parameters may change over time, they are assumed constant across horizons within a survey. In other words, forecasters do not expect the RBA to place different weights on inflation or unemployment in the future than it does at present. We assess the plausibility of this assumption in Section 4.
To recover the perceived policy coefficients, we estimate the following panel regression:
where is a forecaster-specific intercept that absorbs persistent beliefs about the inflation target, the NAIRU, and the neutral rate. This formulation allows differences in long-run expectations to be correlated with forecasters' macroeconomic projections, ensuring that the estimated slope coefficients reflect perceptions of the RBA's responsiveness to changing economic conditions rather than differences in levels.
Our framework imposes a single, common perceived reaction function. To the extent that true heterogeneity in perceived policy rules exists, our estimates should therefore be interpreted as averages across forecasters. We explore the implications of this assumption in Section 5.
A key departure from Bauer et al (2024a) and Bauer et al (2024b) is our use of unemployment rather than an output gap. We do so for two reasons. First, unemployment aligns more closely with the RBA's dual mandate of price stability and full employment. Second, it requires weaker identifying assumptions. As Bauer et al (2024b) note, using GDP forecasts and output gaps requires imposing a common assumption about future potential output growth. By contrast, using unemployment only requires that forecaster-specific NAIRU beliefs are constant across horizons.[1]
Our baseline specification assumes that inflation and unemployment are the primary drivers of policy. If forecasters believe the RBA responds systematically to additional variables, omitted-variable bias may arise. We address this by extending the rule to include wage growth (Wage Price Index; WPI) and show that our main results are robust. The wage growth extension also provides additional insight into the role of labour-market conditions in shaping perceived policy.
2.2 Data
We use survey data from the RBA's Market Economist Survey (MES), a quarterly survey of approximately 10–20 professional forecasters. The MES collects quarterly forecasts for a range of macroeconomic variables at multiple horizons, extending up to roughly 2.5 years ahead. For this paper, we use forecasts of trimmed-mean inflation, the unemployment rate, and the cash rate, which are available from 2015 to 2025.
2.3 Estimation approach
The regression in equation (3) is estimated in a panel setting. Each forecaster–survey pair (t, j) is treated as a panel unit, with forecast horizons (h) forming the time dimension.
We estimate both a static specification, which abstracts from policy inertia by omitting the lagged interest rate, and a dynamic specification that allows for interest-rate smoothing. We present the static specification primarily as a simple benchmark, and for comparability with our later disagreement analysis where interpretation is clearer through the static framework. However, our preferred specification for most exercises is the inertial rule, consistent with the empirical importance of gradual policy adjustment. In the survey setting, the static rule can be interpreted as reflecting perceived medium-run policy responses over the forecast horizon, whereas the inertial rule captures perceived short-run responses (Bauer et al 2024a; Bauer et al 2024b). Standard errors are robust and clustered at the forecaster-by-time level.
Unlike Bauer et al (2024b), we estimate the inertial specification using a dynamic panel GMM estimator. The inclusion of a lagged dependent variable induces small-sample bias when fixed effects are present (often referred to as the Nickell bias). To address this, we employ an Arellano–Bond–style difference GMM estimator (Arellano and Bond 1991). We prefer difference GMM to system GMM because the latter requires the assumption that changes in expectations are uncorrelated with forecaster-specific fixed effects — an assumption that is unlikely to hold in this setting. For example, forecasters with higher neutral-rate beliefs are likely to expect smaller future declines in interest rates, all else equal. Difference-in-Hansen tests also reject the validity of the additional moment conditions required for system GMM.[2]
Inflation and unemployment expectations are treated as predetermined rather than strictly exogenous: past shocks to interest rate expectations may affect future inflation and unemployment forecasts, even if contemporaneous shocks do not. Accordingly, these variables enter as GMM-style instruments with appropriate lags. We find evidence that forecast errors are autocorrelated across horizons, with AR(2) dynamics in the differenced residuals. To address this, we use deeper lags of the instruments: third lags for interest rates and second lags for inflation and unemployment.
All dynamic specifications are estimated using the two-step GMM estimator with the Windmeijer (2005) finite-sample correction. As a robustness check, we vary the number of lagged instruments to assess potential effects of instrument proliferation; the results are very similar across specifications.
2.4 Identification and assumptions
Our survey-based approach is designed to recover perceived policy rules rather than the RBA's actual decision rule. Identification relies primarily on within-forecaster, across-horizon variation. For a given forecaster and survey date, we recover perceived policy slopes from how the expected path of the cash rate co-moves with that forecaster's own inflation and unemployment forecasts across horizons. Each forecaster therefore provides a “term structure” of expectations, and it is the slopes of these profiles — rather than their levels — that identify the perceived reaction function.
Figure 1 illustrates that forecast profiles exhibit substantial cross-horizon variation. For example, during 2021–22 forecasters anticipated sharp increases in inflation but relatively muted cash rate adjustments, whereas by 2023–24 expected rate increases became more closely aligned with inflation forecasts. These horizon-level differences underpin our identification strategy.
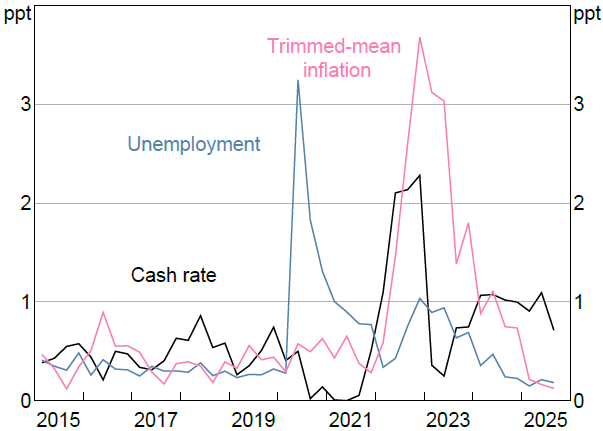
Note: Average cumulative absolute change calculated for each forecaster, and then averaged.
Sources: Authors' calculation; RBA
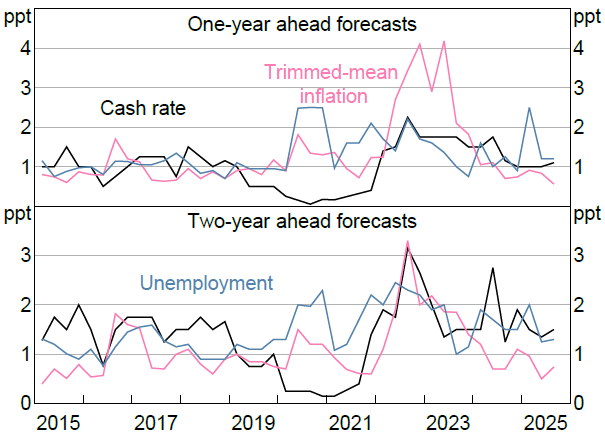
Cross-forecaster disagreement further enhances identification and precision. Figure 2 shows that disagreement over inflation, unemployment, and cash rate expectations varies considerably over time, particularly around major turning points such as the onset of the COVID-19 shock and the beginning of the tightening cycle in 2022.
As with any Taylor-rule regression, reverse causality is a potential concern: interest rates may influence inflation and unemployment as well as respond to them. In our setting, as discussed in Bauer et al (2024b), this concern is mitigated by the use of simultaneous survey expectations. At a given survey date, forecasters report expected paths for interest rates, inflation, and unemployment formed from a common information set. The co-movement we exploit therefore reflects how forecasters map their macroeconomic assumptions into policy expectations, rather than feedback from realised policy to subsequent outcomes. While the assumption that economic forecasts are independent of future policy shocks is unlikely to hold exactly, any resulting bias is expected to be limited. More generally, Carvalho, Nechio and Tristao (2021) show that bias in OLS estimation of Taylor rules is small when monetary policy shocks are not primary drivers of macroeconomic outcomes.
3. The Average Perceived Reaction Function
We begin by examining the average perceived reaction function over the pre-COVID-19 period. This provides a benchmark for assessing how market perceptions compare with the Taylor rules embedded in standard policy models.
Table 1 reports estimates from two specifications: one without policy inertia and one allowing for a lagged cash rate. Both specifications imply similar short-run responses to inflation and unemployment.
Sources: Authors' calculation; RBA
A one percentage point increase in unemployment is perceived to lower the cash rate by around 80 basis points, while a one percentage point increase in inflation is perceived to raise the cash rate by roughly 25 basis points. Under the inertial specification, these imply long-run responses of approximately 350 basis points to unemployment and 115 basis points to inflation.[3]
Relative to benchmark policy rules, the perceived response to unemployment is somewhat stronger, while the perceived response to inflation is noticeably weaker. In particular, the inflation coefficient is well below that implied by the Taylor rule in the RBA's macro-econometric MARTIN model, which is calibrated rather than estimated (Ballantyne et al 2020). The perceived inflation response is closer to, but still below, the long-run response estimated in the RBA's DSGE model (Gibbs et al 2018).
These differences have direct implications for how interest rate expectations respond to economic news. Consider the September quarter 2025 CPI release, in which trimmed-mean year-on-year inflation was around 0.3 percentage points above median market expectations. Applying the MARTIN rule would imply an increase in the cash rate of roughly 18 basis points using the short-run coefficient. Under the perceived rule, the implied response is closer to 8 basis points. In practice, yields at the short end of the curve rose by around 10 basis points. The lower perceived inflation weight therefore helps explain the muted response of interest rate expectations to the inflation surprise, relative to what would have been predicted by the MARTIN and DSGE models.
| Perceptions no lagged cash rate | Perceptions lagged cash rate | MARTIN rule | DSGE | |
|---|---|---|---|---|
| Lagged cash rate | n/a | 0.764 (0.636, 0.892) |
0.700 | 0.870 (0.840, 0.890) |
| Inflation – short run | 0.218 (0.102, 0.334) |
0.272 (0.145, 0.398) |
0.600 | 0.195 |
| Inflation – long run | n/a | 1.152 | 2.000 | 1.540 (1.400, 1.700) |
| Unemployment – short run | −0.807 (−0.962, −0.652) |
−0.834 (−1.110, −0.558) |
−0.600 | n/a |
| Unemployment – long run | n/a | −3.535 | −2.000 | n/a |
| Notes: Output from estimation of perceived policy rules over the sample 2015-2019. | ||||
These findings also matter for the interpretation of macroeconomic models, particularly forward-looking DSGE frameworks. To the extent that such models embed stronger inflation responses than those perceived by market participants, they may overstate the stabilising role of systematic monetary policy on inflation. This highlights the value of considering alternative policy rules in model-based analysis as robustness, or considering extensions such as bounded rationality or myopia that dampen forward-looking dynamics.
4. Evolution of the RBA's perceived reaction function
Figure 3 summarises the estimated coefficients from the baseline survey-based Taylor rule regressions over time. The top panels report the estimated inflation coefficient from the simple specification (left) and the inertial specification (right), while the bottom panels show the corresponding unemployment coefficients. Shaded areas denote 95% confidence intervals, clustered by forecaster and horizon. Unless otherwise stated, the estimates are constructed using rolling four-quarter trailing samples to smooth high-frequency variation.
In what follows, we adopt a largely narrative-based approach, highlighting economically meaningful movements in the estimated coefficients and interpreting them in light of contemporaneous data, policy actions, and central bank communication. An alternative would be a more systematic regression-based analysis; however, the relatively short sample and the time-varying nature of policy communication limit the scope for such an approach. Given our focus on how communication and actions shape perceptions — and the likelihood that the relevant communication channels and messages evolve over time — a narrative interpretation is both informative and appropriate.
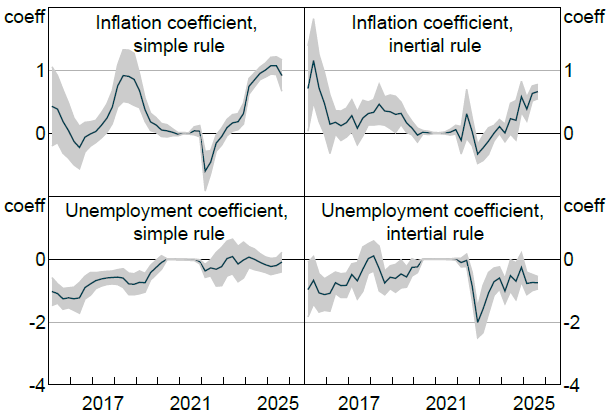
Note: Coefficients of perceived monetary policy rules estimated using 4-quarter rolling panel regressions on survey data from February 2015 to August 2025. Left panels show results from simple rules and the right from rules that allow for monetary policy inertia. Shaded areas indicate 95 per cent confidence intervals, based on standard errors clustered by forecaster and horizon.
4.1 Pre-pandemic dynamics
In the mid-2010s, forecasters inferred that the RBA placed only a modest weight on inflation in its perceived reaction function. This interpretation aligns with contemporaneous communication that foregrounded financial-stability considerations — particularly housing market risks — and signalled a reluctance to ease policy further despite persistently subdued inflation (Lowe 2016; Reserve Bank of Australia 2016). Simple text analysis supports this reading: references to housing risks and regulators in policy communications rose sharply in 2015–16, coinciding with the period in which the estimated inflation coefficient fell (Figure 4). While these correlations are descriptive rather than causal, the timing suggests that the financial-stability framing influenced how market participants mapped economic data into expected policy responses.
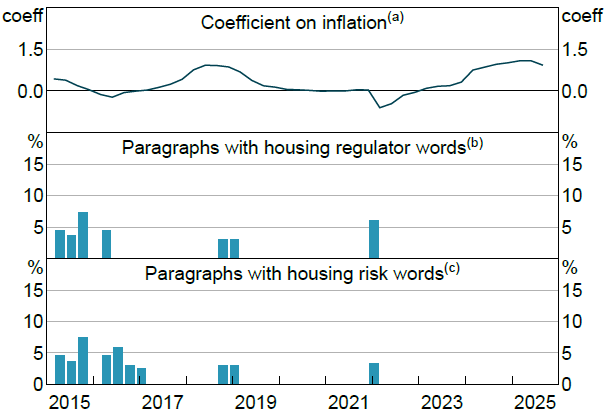
Notes:
(a) Coefficients of perceived monetary policy rules estimated using 4-quarter rolling panel regressions on survey data using simple rule.
(b) Paragraphs with both a housing and risk word, with no abating terms. Housing words include: dwelling prices, housing credit, housing market, housing conditions and household debt. Risk words include: downside risk, concern(s), and risk(s). Abating words include: eased, declining, decline(s), easing, fall(s) and abate.
(c) Paragraphs with both a housing and regulator word, with no abating terms. Housing and abating words as above. Regulator include regulator(s) and APRA.
Sources: Authors' calculation; RBA
Over the same period, the perceived response to unemployment gradually declined toward zero. This pattern is broadly consistent with a communication stance that elevated housing and financial-stability concerns, potentially reducing the salience of labour-market conditions in the perceived reaction function. However, the timing of movements in the unemployment coefficient is less tightly aligned with communication shifts than in the case of inflation.
Taken together, these findings suggest that RBA communication during the pre-pandemic period shaped perceptions of its reaction function. By emphasising financial-stability risks and signalling caution about further easing, the RBA appears to have dampened forecasters' perceptions of its responsiveness to inflation deviations from target, and (potentially) to a lesser extent to fluctuations in unemployment.
4.2 COVID and post-COVID dynamics: shifting emphasis back to inflation
A striking feature of the effective lower bound (ELB) period from 2020 to 2022 is the near-zero perceived responsiveness of the RBA to both inflation and unemployment. This pattern closely mirrors evidence for the U.S. Federal Reserve documented by Bauer et al (2024a) and recent evidence for Japan in Haba et al (2026). Interpretation of these estimates requires some care. When the policy rate is constrained by the lower bound, monetary policy may operate through forward guidance or other instruments that influence expectations and longer-term interest rates without necessarily generating variation in short-term interest-rate forecasts over the survey horizon. Our estimates therefore capture forecasters' perceptions of the responsiveness of the expected path of the cash rate to macroeconomic conditions, rather than the overall stance of policy. Accordingly, the near-zero coefficients suggest that forecasters viewed the expected cash-rate path over the forecast horizon as only weakly related to macroeconomic forecasts during this period, rather than policy overall being weakly related to conditions.
In the immediate post-pandemic period, the estimated coefficients in Figure 3 display a clear asymmetry. The perceived response to unemployment strengthens (in absolute terms) relatively quickly, particularly for the inertial rule, while the perceived response to inflation remains muted for an extended period. This pattern aligns closely with our language-based measures, which show a pronounced increase in references to “preserving labour market gains” across RBA policy announcement, speeches, and Minutes from early 2023 onward (Figure 5). It also aligns somewhat with the release of the (RBA Review Panel 2023), which reaffirmed the dual mandate nature of noting that “Equal consideration should be given to price stability and full employment in setting monetary policy”. Taken together, the coefficient estimates and the text evidence point to a phase in which markets inferred that policy was prioritising the recovery and durability of employment, while largely looking through temporary, supply-driven inflationary pressures—consistent with delayed policy lift-off and the tenor of RBA communication at the time.
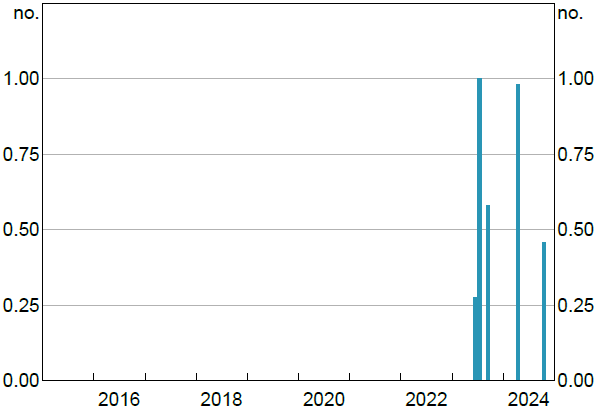
Note: Number of mentions of phrases related to preserving labour market gains in RBA policy meeting announcements, Minutes, Statement on Monetary Policy, and speeches. Quarterly totals per 10,000 words. Terms include ‘preserve the gains’, ‘preserve gains’, ‘preserve the employment’, ‘preserving the gains’, ‘preserve employment gains’.
Sources: Authors' calculation; RBA
A further salient feature of RBA communication during this period was the emphasis on sustained wage growth as a precondition for a durable return of inflation to target from late 2021.[4] To assess whether this framing shaped forecasters' perceptions, we augment the perceived reaction function to include a direct response to wage inflation, measured using forecasts of the WPI. Incorporating WPI leaves the estimated inflation and unemployment coefficients largely unchanged, indicating that our baseline results are not driven by omitted wage dynamics. However, the extension reveals that the perceived response to wage growth begins to rise in late 2021 before the inflation and unemployment coefficients increase, consistent with the view that markets interpreted wages as an early conditioning variable for policy normalisation (Figure 6).
As the tightening cycle progresses, the perceived inflation coefficient rises materially, signaling a reassessment of the Bank's willingness to respond forcefully to persistent inflation. By contrast, the unemployment coefficient exhibits no comparable and sustained rebound, remaining relatively subdued in the simple specification, with only a temporary increase in the inertial specification around 2022. Overall, the evidence points to a transition from an initial post-pandemic emphasis on labour market preservation toward a renewed focus on inflation, as policy actions accumulated and macroeconomic conditions evolved.
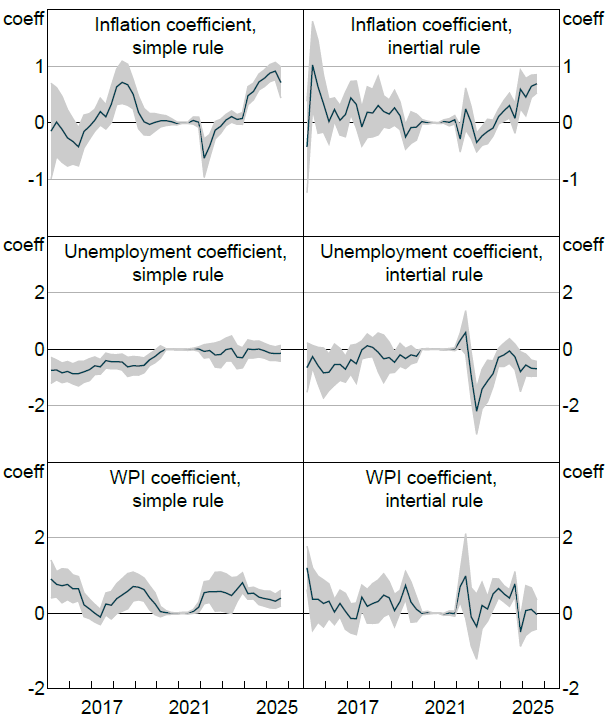
Note: Coefficients of perceived monetary policy rules estimated using 4-quarter rolling panel regressions with WPI. Left panels show results from simple rules and the right from rules that allow for monetary policy inertia. Shaded areas indicate 95 per cent confidence intervals, based on standard errors clustered by forecaster and horizon.
4.3 Why did the perceived inflation response rise only after lift-off?
A striking feature of the estimates in Figure 3 is that the perceived response to inflation remained subdued throughout 2021 and into 2022, despite large and persistent inflation surprises, and rose sharply only after the RBA began tightening policy in May 2022.[5] This pattern is particularly notable given that RBA communication became progressively more hawkish over this period, even if it did continue to highlight the importance of preserving labour market gains.
This disconnect is illustrated in Figure 7, which plots the perceived inflation coefficient alongside a text-based measure of policy tone: a Hawk–Dove index constructed separately for meeting minutes and post-meeting statements by Jones (2025).[6] The tone of RBA communication shifts decisively in a hawkish direction prior to lift-off, with the index rising markedly in late 2021 and early 2022. Yet over this same period, the estimated inflation coefficient remains low.
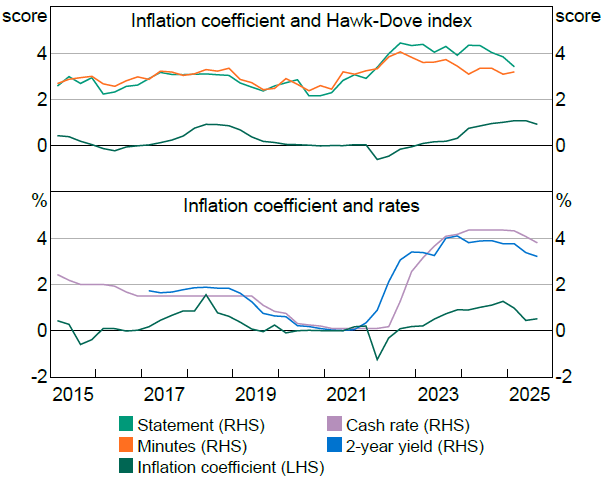
Note: Statement and Minutes series are quarter average Hawk-Dove indices from Jones (2025). Inflation coefficient are from simple monetary policy rules estimated using 4-quarter rolling panel regressions. Cash rate and 2-year yield are quarter averages.
Sources: Authors' calculation; Jones (2025)
Why was communication insufficient to induce an earlier reassessment of the perceived inflation response? Following Bauer et al (2024a), who document similar patterns for the United States and the euro area, we consider three potential explanations for the delayed increase in perceived policy responsiveness: (i) forecasters viewed the inflation surge as transitory; (ii) forecasters expected a persistent “lower-for-longer” policy framework; and (iii) forecasters primarily learned about the reaction function from realised policy actions under heightened uncertainty.
4.3.1 Transitory inflation views
One potential explanation is that market participants viewed the inflation surge of 2021 as largely transitory. Under this interpretation, forecasters would have expected inflationary pressures to fade without requiring a strong monetary policy response, leading them to anticipate little immediate adjustment in the RBA's reaction function.
To assess this hypothesis, we partition forecasters into two groups based on whether their inflation forecasts lie above or below the cross-sectional median. If forecasters who anticipated more persistent inflation also expected a stronger policy response, they should have projected an earlier and more pronounced lift-off from the effective lower bound.
In practice, however, the two groups forecast remarkably similar paths for the cash rate during and following lift-off (Figure 8). This similarity indicates that differences in beliefs about inflation persistence alone cannot account for why the perceived inflation response remained muted until after policy tightening had begun.
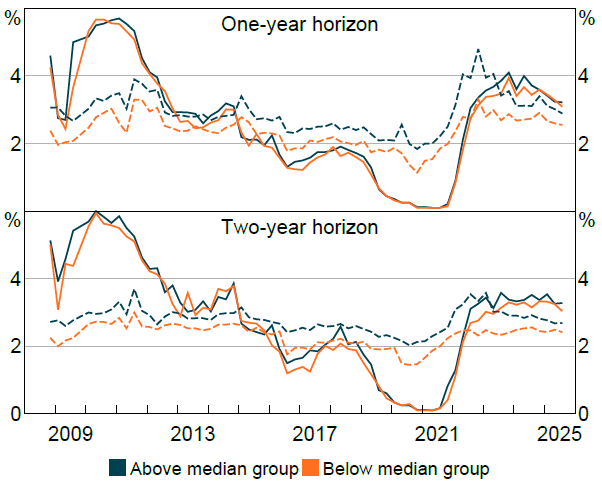
Note: Dashed lines are inflation forecasts, full lines are cash rate forecasts. Means within groups.
Sources: Authors' calculation; RBA
4.3.2 History-dependent or “lower-for-longer” expectations
A second possible explanation is that forecasters interpreted the RBA's strategy as history dependent. For example they may have expected the RBA to allow inflation to temporarily overshoot the target following a prolonged period below it, akin to an average-inflation or price-level target. Or alternatively, they may have taken perceived forward guidance and yield curve targeting as an implicit promise to keep rates low even if inflation rose. If this was the case, variation in inflation outcomes may have been unlikely to influence short-term policy rate expectations. However, they should still have had some impact on longer-term rate expectations.
This provides a simple empirical diagnostic to test whether such dynamics can explain the delayed pick-up in the inflation coefficient. If policy were perceived as strongly history dependent in this manner, inflation surprises should be associated with revisions to the expected medium- to long-run policy path, and so longer-term interest rates, even while near-term rates remained anchored. Figure 9 evaluates this prediction by plotting rolling correlations between inflation surprises (measured relative to Bloomberg median forecasts) and interest rates on Australian Government Securities at various maturities
The evidence provides little support for such a pattern. There is no economically meaningful increase in the sensitivity of longer-term rates to inflation surprises during this period; if anything, correlations at shorter maturities tend to rise earlier.[7] This is the case even if we focus on yields beyond the RBA's target yield for yield-curve control, which would appear to be a natural cut-off for the lower-for-longer dynamics to be most evident.
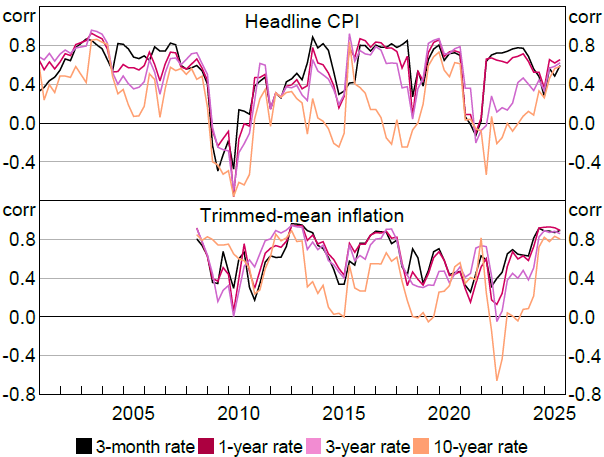
Note: Yield changes measured from previous close to close on day of CPI release. Inflation surprises are measured as gap between median Bloomberg forecast on day before the release, and the release. Headline CPI uses historical releases. Trimmed mean are most recent vintage pre 2012.
Sources: Authors' calculation; Bloomberg; RBA
4.3.3 Learning from monetary policy actions under uncertainty
The third and most consistent explanation is that forecasters required concrete policy actions to update their beliefs about the RBA's reaction function. During 2021–22, uncertainty surrounding the near-term policy outlook was unusually elevated: communication emphasised labour market recovery and patience, while global inflation dynamics were shifting rapidly. As shown in Figure 10, the dispersion of one- and two-year-ahead cash rate expectations widened sharply as market participants attempted to infer both the timing and the pace of future tightening. Following the onset of rate increases in May 2022, and as tightening continued through 2023, this dispersion narrowed, suggesting that realised policy actions clarified the Bank's intentions, potentially alongside some increased certainty around the nature and persistence of economic shocks.
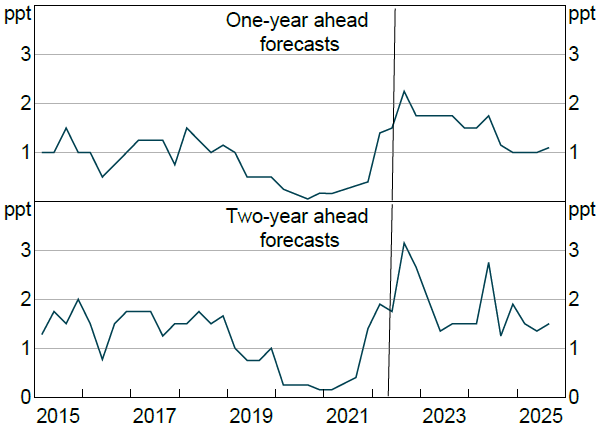
Note: Range of cash rate forecasts in the survey for each horizon. Solid line is May 2022 when cash rate hiking cycle began.
Sources: Authors' calculation; RBA
High-frequency evidence reinforces this interpretation. Figure 11 plots changes in the policy rate and high-frequency identified shocks monetary policy ‘Action’ shocks taken from Hambur and Haque (2024). The magnitude of policy surprises increased sharply following lift-off, consistent with substantial revisions in beliefs about the policy rule. Had market participants already internalised the RBA's intended strategy, post-announcement yield movements would have been more muted. Instead, the evidence suggests that forecasters learned about the renewed primacy of inflation control primarily from realised policy decisions.
Taken together, these results indicate that the re-anchoring of policy perceptions after 2022 was driven less by forward guidance and more by the sequence of actual rate increases. In periods of heightened uncertainty, communication alone proved insufficient; sustained policy actions provided the clearest signal of the RBA's true reaction function.
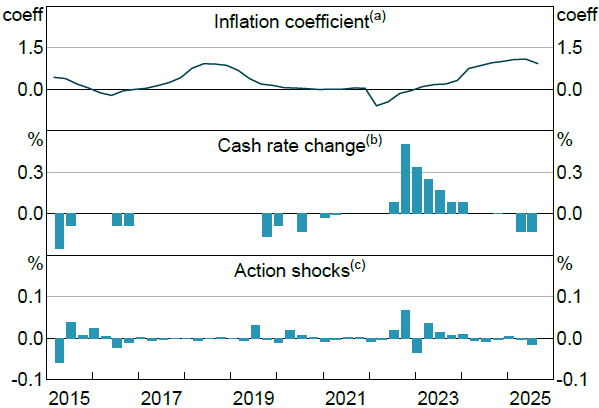
Notes:
(a) Coefficients of perceived monetary policy rules estimated using 4-quarter rolling panel regressions and simple rule.
(b) Change in cash rate. Quarter average.
(c) ‘Action shock’ from Hambur and Haque (2024). Quarter average.
Sources: Authors' calculation; Hambur and Haque (2024); RBA
4.4 Aiming for the stars
As discussed in Section 2, our baseline specification uses forecaster–time fixed effects to absorb forecaster-specific views about long-run “star” variables, including the neutral real rate, the NAIRU, and the inflation target (or long-run inflation). A natural question is how effectively these fixed effects capture long-run beliefs when recovering the perceived policy rule.[8] By relying on within-forecaster, cross-horizon variation, this approach deliberately abstracts from level differences across forecasters. While this helps isolate perceived policy slopes, it may also discard potentially informative cross-sectional variation if long-run beliefs themselves contain economically relevant information.
To assess this issue, we exploit the fact that the MES includes explicit questions on the NAIRU, long-run inflation, and the long-run equilibrium nominal interest rate (i.e. the nominal neutral rate) from 2024 on.[9] Figure 12 shows the dispersion of these expectations over time. We can see that there is notable and time-varying divergence, including in long-run inflation expectations, which reinforces the point that time-varying and heterogeneous expectations for star variables could be an important factor in estimation of perceived reaction functions.
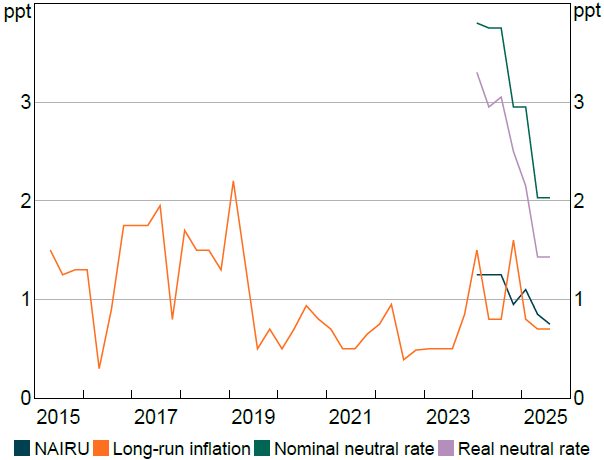
Note: Real neutral rate is nominal neutral rate less long-run inflation forecast.
Sources: Authors' calculation; RBA
Using these data, we re-estimate the model without forecaster fixed effects and instead directly incorporate forecaster-specific estimates of the star variables. We consider two variants. In the first, ‘Star model’, we include forecaster-level estimates of all three star variables. In the second, ‘Star model—constrained’, we impose a common inflation target of 2.5 per cent and replace only the neutral rate and NAIRU with forecaster-specific estimates. This comparison allows us to assess whether the observed dispersion in long-run inflation expectations reflects noise, or instead captures systematic differences in forecasters' broader views of the economy. The distinction is important for understanding how well inflation expectations are anchored.
Figure 13 summaries the results. First, the baseline and Star model estimates are very similar, both in levels and in their evolution over time. This finding suggests that the fixed-effects approach advocated by Bauer et al (2024a) and Bauer et al (2024b) provides a good approximation when direct measures of star variables are unavailable. Second, the Star model – constrained yields noticeably lower estimated inflation coefficients. Imposing a common long-run inflation expectation leads to a significant downward bias: forecasters with higher long-run inflation expectations — and therefore higher short-horizon inflation forecasts — are incorrectly treated as expecting larger inflation gaps. Because these forecasters do not, on average, expect correspondingly higher policy rates once differences in nominal neutral rates are taken into account, the estimated relationship between inflation gaps and expected interest rates is attenuated.
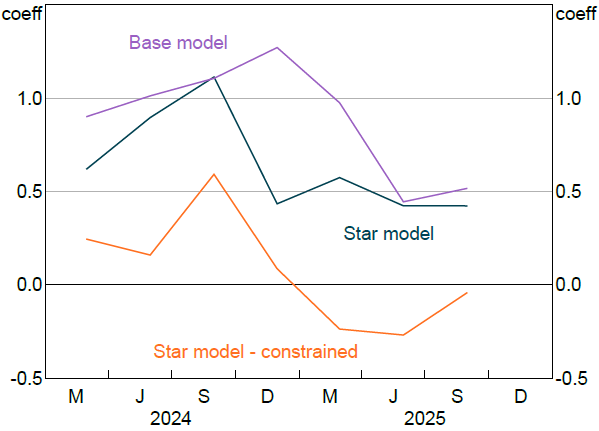
Note: Star model – constrained enforces long-run inflation coefficient of 2.5
Overall, the evidence indicates that variation in long-run inflation expectations is both economically meaningful and systematically related to forecasters' broader macroeconomic views. This suggests that monitoring the distribution of long-run inflation expectations — not just their average – can provide valuable information about how monetary policy is perceived and how expectations are anchored.
4.5 Sensitivity analysis
We assess the robustness of our results to a range of modeling choices. First, Figure 14 compares estimates from the inertial specification obtained using Arellano–Bond GMM with those from an OLS estimator with fixed effects. The resulting time profiles are similar, particularly for the inflation coefficient. The confidence bands largely overlap, and the key qualitative features, namely muted responsiveness in the mid-2010s and near-zero coefficients during the effective lower bound period, are preserved. One notable difference is that the inflation coefficient rises somewhat earlier under OLS, underscoring the importance of using an appropriate dynamic panel estimator when interpreting the timing of changes in perceived policy responsiveness. Differences are more pronounced for unemployment, with GMM yielding more negative estimates around 2022, consistent with it correcting the small-sample bias that arises in dynamic panels with lagged dependent variables.
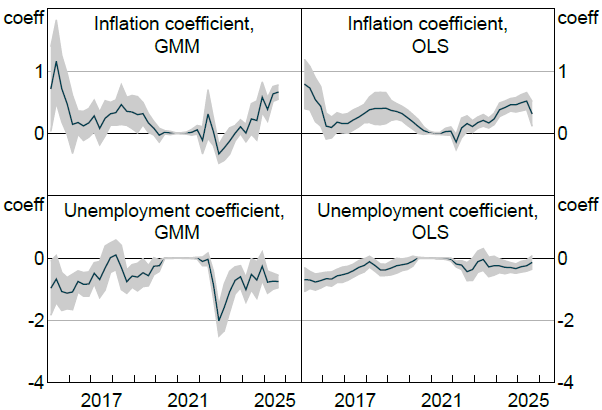
Note: Coefficients of perceived monetary policy rules estimated using 4-quarter rolling panel and inertial rules. GMM series apply Arellano–Bond GMM dynamic panel estimator. OLS series apply OLS. Shaded areas indicate 95 per cent confidence intervals, based on standard errors clustered by forecaster and horizon.
Sources: Authors' calculation; RBA
Second, Figure 15 reports quarter-by-quarter estimates rather than rolling-window averages. Although these series are naturally noisier, they convey the same message: perceived policy responsiveness to inflation is muted in the mid-2010s, close to zero during the effective lower bound period and rises materially thereafter once rates lift-off. The broad narrative is therefore unchanged, indicating that the headline results are not an artefact of the smoothing procedure.
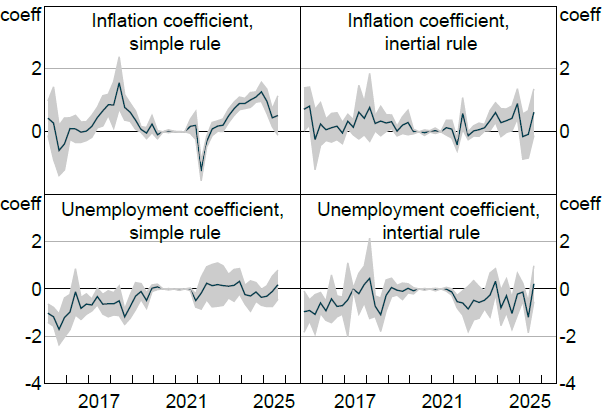
Note: Coefficients of perceived monetary policy rules estimated using quarter-by-quarter regressions on survey data. Left panels show results from simple rules and the right from rules that allow for monetary policy inertia. Shaded areas indicate 95 per cent confidence intervals, based on standard errors clustered by forecaster and horizon.
Sources: Authors' calculation; RBA
Finally, we examine the robustness of our maintained assumptions that policy coefficients and star variables are constant across horizons. Two considerations motivate this exercise. First, forecasters may perceive the RBA's reaction function itself to vary by horizon. For example, they may believe the RBA assigns less weight to inflation in the near term but more weight over longer horizons. Second, forecasters may have different degrees of confidence in their perceived policy rule across horizons, effectively implying horizon-specific error variances. This could arise if short-run policy decisions are viewed as subject to greater discretion or noise, while longer-horizon forecasts better reflect beliefs about the underlying reaction function.
To address these possibilities, we allow for horizon-specific weighting in the estimation, adopting an approach consistent with the latter interpretation. Under the inertial specification, a one-unit shock to the policy rate decays at a rate of approximately 0.7 per period. We use this implied decay to construct horizon-specific standard deviations and weight observations by their inverse, yielding a GLS-style estimator in which the error structure is disciplined by the model's dynamics.[10]
Figure 16 presents the resulting estimates. For both inflation and unemployment, the weighted and unweighted coefficients are nearly identical in both level and time profile. This similarity suggests that our assumptions of constant perceived reaction function parameters and star variables across horizons are reasonable and do not drive the main results.
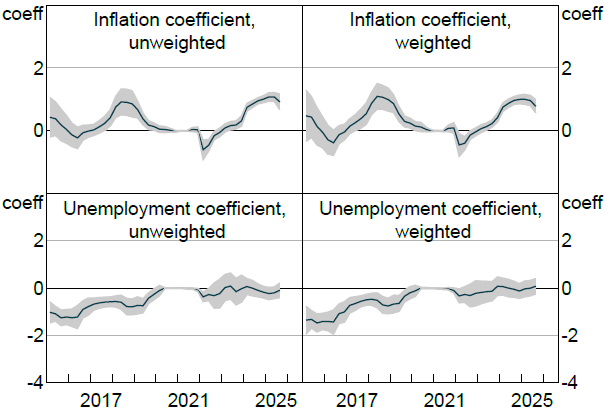
Note: Coefficients of perceived monetary policy rules estimated using 4-quarter rolling panel and simple policy rule. Unweighted series do not apply weights. Weighted series weight horizons based on the modeled shock decay rate. Shaded areas indicate 95 per cent confidence intervals, based on standard errors clustered by forecaster and horizon.
Sources: Authors' calculation; RBA
5. What drives cash-rate disagreement?
Thus far, we have focused on the average perceived reaction function across forecasters. A natural question is whether disagreement about future cash rates reflects heterogeneity in perceived policy rules, or instead differences in expectations about future economic conditions. The distinction has important implications for central bank communication. If disagreement primarily reflects uncertainty about the reaction function, clearer guidance about the policy framework may be most effective. If, instead, disagreement mainly reflects differing views about the economic outlook, communication may be better directed toward clarifying the assessment of incoming data and risks.
To address this question, we examine how well each forecaster's own outlook explains their expected cash rate at a given survey date, under the maintained assumption of a common perceived reaction function. Specifically, we estimate the survey-based Taylor-rule regressions described above and track the rolling R2 from the forecaster–horizon panels. A high R2 indicates that most dispersion in expected interest rates is accounted for by differences in expected conditions, while a low R2 suggests a greater role for disagreement about the policy rule itself. Alternatively, low fit may also reflect disagreement about omitted policy-relevant variables or model misspecification, such as nonlinearities. We conduct this analysis using the static specification, as interpreting disagreement in the inertial model is complicated by the fact that past disagreement is mechanically propagated through the lagged interest rate term.
Disagreement in the level of expected cash rates is sizable at key turning points. As shown in Figure 10, the cross-sectional range of one- and two-year-ahead expectations is roughly 1 and percentage points, respectively, during 2015–2019. It collapses toward zero at the effective lower bound, widens sharply through 2021 as lift-off approaches, and then narrows again toward historical norms in 2023–2024.
Figure 17 shows that for most of the sample, 60–80 per cent of the variation in expected cash rates is explained by differences in forecasters' own outlooks. Roughly half of this explanatory power reflects heterogeneity in beliefs about long-run “star” variables, such as the neutral rate (r*), the NAIRU (u*), and long-run inflation .[11]
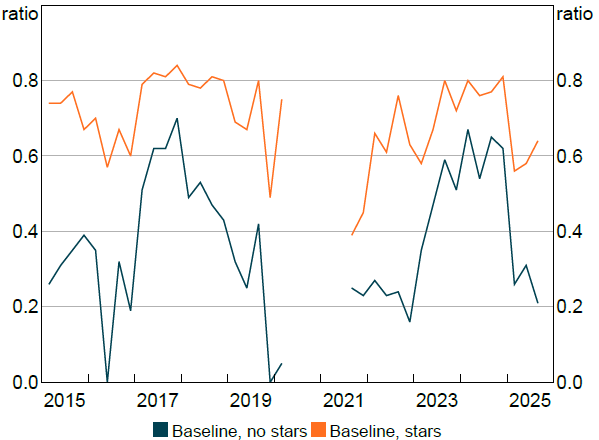
Note: Rolling R-squared from estimation of simple policy rule on surveys quarter-by-quarter. ‘Baseline, stars’ allows for forecaster-specific assessments of star variables using forecaster fixed effects. ‘Baseline, no stars’ assumes a common view on star variables.
Three episodes stand out. First, in 2016 the R2 declines, consistent with a period in which communication elevated housing and financial-stability considerations, and markets inferred a relatively weak inflation response. The reduction in explainability could reflect disagreement about the reaction function itself, specifically the relative weight placed on inflation versus financial-stability objectives. Alternatively, it may reflect disagreement about the outlook for those additional considerations, which are omitted from the baseline rule. Without direct forecasts for housing prices or related variables we cannot disentangle these channels. Nevertheless, in either case the episode reinforces earlier findings that communication around financial stability considerations had important implications for perceived policy rules.
A second decline in fit occurs in 2022–2023, coinciding with a renewed widening in the dispersion of cash-rate expectations (Figure 10). Part of this appears to reflect the perceived importance of wage outcomes in the policy rule during this period, coupled with disagreement about wage dynamics. Consistent with this interpretation, augmenting the rule to include wage growth (WPI) substantially attenuates the decline in R2 (Figure 18).
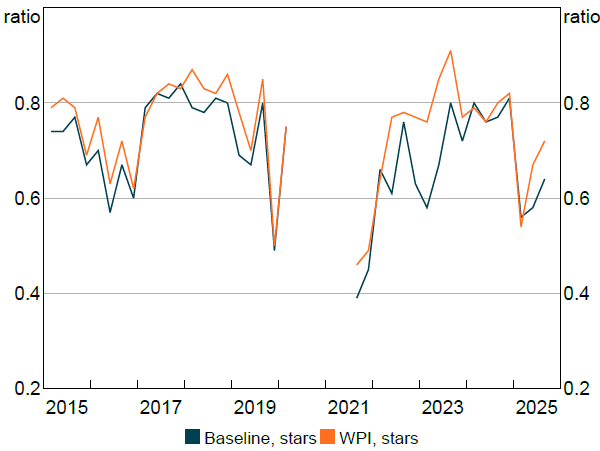
Note: Rolling R-squared from estimation of simple policy rule on surveys quarter-by-quarter. ‘Baseline, stars’ allows for forecaster-specific assessments of star variables using forecaster fixed effects. ‘WPI, no stars’ assumes wages growth (WPI) enters the policy rule.
One final period of note is 2025, when explainability declines again even after including wage growth in the specification. This suggests a renewed increase in disagreement about the reaction function, or about other policy-relevant considerations not captured in the baseline rule. There is less of a clear narrative as to the cause of this increased disagreement. One possible contributing factor could be the institutional and communication changes associated with the Review of the Reserve Bank of Australia and its subsequent implementation (RBA Review Panel 2023). The transition period as they were implemented could have led to a period of increased uncertainty about the reaction function. However, it is also very possible that the increase in disagreement reflects other factors, including the fact that inflation had been above the band for a number of years.
Taken together, these patterns reinforce a broader narrative: clearer guidance about which observable conditions are relevant for policy decisions tends to align beliefs about the reaction function and reduce disagreement. When market participants infer that additional conditioning variables have entered the policy rule, disagreement naturally increases.
6. Conclusion
This paper provides a time-varying account of how professional forecasters perceive the Reserve Bank of Australia's reaction function. Using forecaster-level expectations across horizons, we recover perceived policy rules and link their evolution to communication, disagreement, and high-frequency identified monetary policy surprises. Several themes and lessons emerge.
First, reaction functions perceived by market participants can differ markedly from those embedded in standard macroeconomic models. This has important implications for interpreting movements in yield curves and for the use of such models in policy analysis and scenario design, particularly when assessing the stabilising role of systematic monetary policy.
Second, central bank communication can materially influence perceptions of the reaction function. This is evident in the mid-2010s, when communication emphasising financial-stability risks coincided with a perceived weakening of the inflation response, and in the post-COVID period when discussions of preserving labour-market gains and conditioning policy on wage growth shaped forecaster beliefs. These episodes highlight both the power of clear, targeted communication, and the risk that communication may shift perceptions in unintended ways.
Third, actions can speak louder than words, especially under heightened uncertainty. In the period following COVID, increasingly hawkish communication did not translate into a stronger perceived inflation response until policy tightening actually commenced. Sustained policy actions, rather than forward guidance alone, ultimately re-anchored beliefs about the primacy of inflation control.
Fourth, most disagreement about future interest rates reflects disagreement about future economic conditions rather than disagreement about the reaction function itself. This suggests that when central banks seek to align expectations across agents, communication may be most effective when directed toward clarifying the assessment of economic conditions and risks, rather than restating the policy framework.
Finally, dispersion in long-run inflation expectations is an important driver of heterogeneity in interest rate expectations. These differences reflect systematically different views about the economy, underscoring the importance of looking beyond average measures when assessing the anchoring of inflation expectations and the formation of beliefs. Standard fixed effects structures appear to do a good job of controlling for such variation in estimation of perceived reason functions.
Taken together, our findings underscore the value of clear communication, reinforced by consistent policy actions, in shaping expectations and enhancing the effectiveness of monetary policy.
References
Arellano M and S Bond (1991), ‘Some Tests of Specification for Panel Data: Monte Carlo Evidence and an Application to Employment Equations’, Review of Economic Studies, 58(2), pp 277–297.
Ballantyne A, T Cusbert, R Evans, R Guttmann, J Hambur, A Hamilton, E Kendall, R McCririck, G Nodari and DM Rees (2020), ‘MARTIN Has Its Place: A Macroeconometric Model of the Australian Economy’, Economic Record, 96(314), pp 225–251.
Bauer MD, CE Pflueger and A Sunderam (2024a), ‘Changing Perceptions and Post-pandemic Monetary Policy’, in Proceedings of the 2024 Jackson Hole Policy Symposium, Federal Reserve Bank of Kansas City.
Bauer MD, CE Pflueger and A Sunderam (2024b), ‘Perceptions about Monetary Policy’, The Quarterly Journal of Economics, 139(4), pp 2227–2278.
Bauer MD and ET Swanson (2023), ‘An Alternative Explanation for the “Fed Information Effect”’, American Economic Review, 113(3), pp 664–700.
Buncic D, A Pagan and T Robinson (2023), ‘Recovering Stars in Macroeconomics’, Australian National University Centre for Applied Macroeconomic Analysis (CAMA) Working Paper No 43/2023.
Bundick B (2015), ‘Estimating the Monetary Policy Rule Perceived by Forecasters’, Federal Reserve Bank of Kansas City Economic Review, Quarter 4, pp 33–49.
Carvalho C, F Nechio and T Tristao (2021), ‘Taylor Rule Estimation by OLS’, Journal of Monetary Economics, 124, pp 140–154.
Fujiwara I, Y Nakazono and K Ueda (2015), ‘Policy Regime Change Against Chronic Deflation? Policy Option Under a Long-term Liquidity Trap’, Journal of the Japanese and International Economies, 37, pp 59–81.
Gáti L and A Handlan (2022), ‘Monetary Communication Rules’, European Central Bank Working Paper No 2759.
Gibbs CG, J Hambur and G Nodari (2018), ‘DSGE Reno: Adding a Housing Block to a Small Open Economy Model’, RBA Research Discussion Paper No 2018-04.
Haba S, R Hirano, Y Ito and S Kaihatsu (2026), ‘Changes in Perceptions about Monetary Policy: Estimating the Policy Reaction Function Using Market Survey Data’, Bank of Japan Working Paper Series No 26-E-5.
Hambur J and Q Haque (2024), ‘Can We Use High-Frequency Data to Better Understand the Effects of Monetary Policy and Its Communication? Yes and No!’, Economic Record, 100(328), pp 3–43.
Hamilton JD, S Pruitt and S Borger (2011), ‘Estimating the Market-perceived Monetary Policy Rule’, American Economic Journal: Macroeconomics, 3(3), pp 1–28.
Jones DZE (2025), ‘Ornithologist: Towards Trustworthy “Reasoning” about Central Bank Communications’, arXiv Working Paper No 2505.09083.
Kim J and S Pruitt (2017), ‘Estimating Monetary Policy Rules when Nominal Interest Rates are Stuck at Zero’, Journal of Money, Credit and Banking, 49(4), pp 585–602.
Lowe P (2016), ‘Buffers and Options’, Speech to the Committee for Economic Development of Australia (CEDA) Annual Dinner, Melbourne, 15 November.
RBA Review Panel (2023), ‘RBA Review Final Report: An RBA Fit for the Future’.
Reserve Bank of Australia (2016), ‘Minutes of the Monetary Policy Meeting of the Reserve Bank Board, Sydney’, Sydney – 6 December.
Reserve Bank of Australia (2021), ‘Statement by Philip Lowe, Governor: Monetary Policy Decision’, Media Release No 2021-24, 2 November.
Taylor JB (1993), ‘Discretion Versus Policy Rules in Practice’, Carnegie-Rochester Conference Series on Public Policy, 39, pp 195–214.
Taylor JB (1999), ‘A Historical Analysis of Monetary Policy Rules’, in JB Taylor (ed), Monetary Policy Rules, University of Chicago Press, pp 319–348.
Windmeijer F (2005), ‘A Finite Sample Correction for the Variance of Linear Efficient Two-step GMM Estimators’, Journal of Econometrics, 126(1), pp 25–51.
Woodford M (2005), ‘Central Bank Communication and Policy Effectiveness’, NBER Working Paper No 11898.
Xia FD and XS Zhu (2026), ‘Macroeconomic News and Repricing of Monetary Policy Expectations’, Economics Letters, 259, pp 2–5.
Acknowledgements
We thank Ippei Fujiwara, Chris Gibbs, Sarah Hunter, Mariano Kulish, Michelle Lewis, Claude Lopez, Renee McKibbin, Warwick McKibbin, James Morley, Matthew Read, and Benjamin Wong for their helpful comments, as well as seminar participants at the Reserve Bank of Australia, the Workshop of the Australasian Macroeconomics Society (WAMS) 2025, and the Melbourne Annual Macro Policy Meeting 2025. Qazi Haque acknowledges funding from the Australian Research Council under Grant DP240100970. The views expressed in this paper are those of the author and should not be attributed to the Reserve Bank of Australia. Any errors are the sole responsibility of the author.
Footnotes
1 For the United States, Bauer et al (2024b) show that unemployment- and GDP-based specifications yield very similar time-series patterns.
2 The difference-in-Hansen test assesses the validity of the additional moment conditions required for system GMM. In our setting, these conditions are rejected, indicating that changes in expectations are correlated with forecaster-specific fixed effects, and motivating our use of difference rather than system GMM.
3 In the inertial specification, the long-run response is calculated as the short-run coefficient divided by , where is the estimated coefficient on the lagged cash rate.
4 For example, the November 2021 policy announcement noted “The Board will not increase the cash rate until actual inflation is sustainably within the 2 to 3 per cent target range. This will require the labour market to be tight enough to generate wages growth that is materially higher than it is currently.” (Reserve Bank of Australia 2021)
5 The estimated inflation coefficient briefly turns negative during the transition to policy tightening. Such movements should be interpreted with caution and likely reflect the sharp change in expected conditions and central bank responses introducing noise into the estimation. For example, this same dynamic is less evident when the model is estimated period-by-period, suggesting that the pooling of periods across this volatile period is causing some estimation bias.
6 Methodologically, Jones (2025) construct the index using a supervised text-classification framework that guides a large language model with human-authored decision trees. Policy documents are scored on a five-point scale—dovish, leaning dovish, neutral, leaning hawkish, and hawkish—based on a balanced vocabulary capturing emphasis on inflation risks versus growth and labour market concerns, and then standardised for comparability across sources and over time. In this context, hawkish denotes a tighter policy bias, reflecting greater readiness to raise or maintain interest rates in response to inflation risks, while dovish indicates a greater emphasis on activity and employment risks.
7 A similar increase in the responsiveness of shorter-term rates has been documented in other advanced economies, including the United States, the euro area, Canada and the United Kingdom (Bauer et al 2024a; Xia and Zhu 2026).
8 More generally, the identification of latent macroeconomic “star” variables is known to be challenging and sensitive to modeling assumptions, even in structural state-space frameworks; see, for example, Buncic, Pagan and Robinson (2023).
9 Long-run inflation expectations are available for a longer period.
10 An alternative would be to weight observations using the empirical variance of cash rate forecast errors. However, such variances mechanically increase with the forecast horizon as additional shocks accumulate, and would introduce time-varying weights that complicate interpretation.
11 We assess the contribution of star-variable beliefs by comparing rolling R2 values from specifications that include forecaster-specific fixed effects that absorb r*, u* and , with variants that omit them. The resulting change in fit provides an indicative decomposition.