RDP 2026-02: Shifts in Australian Price-setting Behaviour around Large Shocks Appendix D: Supplementary Figure

Figure D1: Response to a Cost-Push Shock under Alternative Price Rigidity Assumptions
Advertised prices
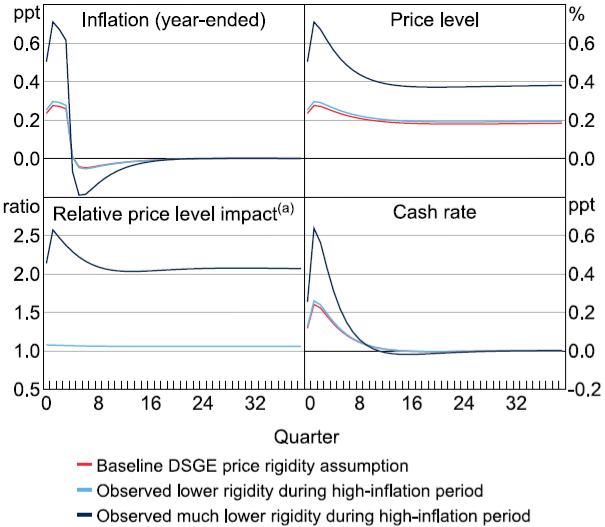
Figure D1: Response to a Cost-Push Shock under Alternative Price Rigidity Assumptions - A four-panel line graph showing the impulse response of various macroeconomic variables in a DSGE model to a 1 per cent increase in the price of foreign imports, over 40 periods. The top left quadrant shows the response of year-ended inflation to the shock under the baseline advertised price rigidity embedded in the model and under the lower rigidities observed in our empirical prices data in 2023. Mechanically, the response of inflation to the shock is stronger when price rigidity is lower. The top right quadrant shows the response of the price level, where the price level is permanently higher after the shock under all three rigidity assumptions but more so when rigidity is lower. The lower left quadrant shows that the relative impact on the price level is 6 to 107 per cent higher in the long-run when using the lower rigidity setting as observed in our data. The bottom right quadrant shows that when rigidity is lower the response of the cash rate must be larger in order to bring inflation back to its steady-state policy target. This graph replicates the analysis shown in Figure 7, but using alternative price rigidities as measured in advertised rather than regular prices. The fact that the results are very similar suggests that the results of most of our policy analyses in the paper will be similar whether we use empirical price rigidity estimates from advertised or regular prices.

Notes: 100 basis point positive shock in the price of foreign imports.
(a) Ratio of the price level impact from the shock using alternative rigidity assumption over impact using baseline rigidity.

Sources: ABS; Authors' calculations.