
RDP 2026-02: Shifts in Australian Price-setting Behaviour around Large Shocks Appendix B: Additional Analysis of the Size of Price Changes
May 2026
We document how the distribution of price changes shift over time. At the onset of the pandemic, the distribution of both advertised and regular price changes became more dispersed, with increased weight in the tails – indicating a higher incidence of large price increases and decreases (Figures B1 and B2).[34] This is reflected in a notable rise in the kurtosis of price changes around 2021 in both price measures (Table B1). The increase in kurtosis suggests a shift toward larger price adjustments, which coincided with a sharp drop in demand and heightened economic uncertainty.
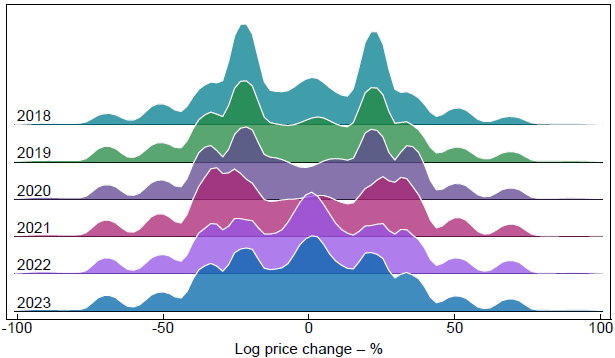
Sources: ABS; Authors' calculations.
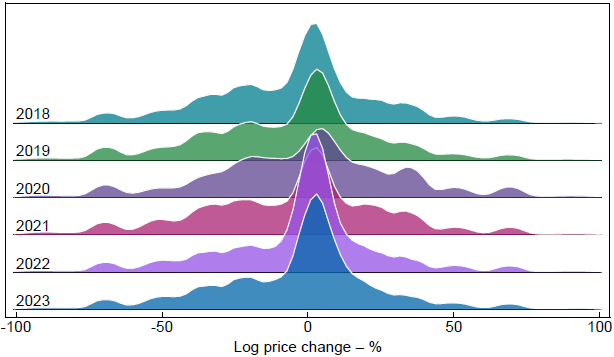
Note: Imputed regular prices.
Sources: ABS; Authors' calculations.
| Advertised | Regular | ||||
|---|---|---|---|---|---|
| Item-weighted | Firm-weighted(a) | Item-weighted | Firm-weighted(a) | ||
| 2018 | 10 | 12 | 11 | 21 | |
| 2019 | 8 | 10 | 10 | 20 | |
| 2020 | 7 | 11 | 9 | 17 | |
| 2021 | 15 | 18 | 48 | 22 | |
| 2022 | 6 | 14 | 11 | 27 | |
| 2023 | 7 | 12 | 12 | 18 | |
|
Note: (a) Cross-firm CPI-weighted mean calculated using fixed effects regressions to control for volatility in firm composition. Sources: ABS; Authors' calculations. |
|||||
During the high-inflation period, the distribution of regular price changes became more centralised, with a higher frequency of smaller adjustments and a decline in kurtosis. This pattern is consistent with theoretical and empirical work showing that higher inflation reduces the relative cost of frequent price changes, leading firms to adjust prices more often but potentially by smaller amounts.[35] However, interpreting these shifts is not straightforward. While visual inspection suggests a greater share of small price changes during the high-inflation period, kurtosis levels are broadly similar to pre-pandemic values. This makes it difficult to draw firm conclusions from these measures about whether price rigidity was ultimately higher or lower than before the pandemic. Moreover, changes in the nature of the shocks driving marginal costs could also influence the distribution of price changes.
This highlights some of the challenges in using distributional statistics to infer changes in price-setting behaviour. Estimates of kurtosis are highly sensitive to changes in sample composition and outlier values. For example, combining subgroups with different variances – even if each has the same kurtosis – can inflate the overall measure. While our firm-weighted metrics attempt to control for compositional shifts by focusing on within-firm changes, variation in the number of items per firm could also still affect results. More broadly, measurement error – whether from prices being captured inaccurately or irregular data collection – can bias kurtosis estimates. So while our distributional measures offer useful insights, they should be interpreted with caution and complemented by more robust methods as in our Section 4.
Footnotes
As a robustness test, we run a version of the item-weighted yearly kernel distributions holding the firm sample fixed between 2019 and 2023. The measured shape of distributions is not significantly different, nor is the evolution of changes in distributions over time. That said, there is some variation in the height of various peaks in the distribution away from the centre. This suggests the need for caution in interpretating sales-related peaks; that is, the relative height of the peaks is affected by compositional change in which firms are sampled over time. [34]
For theoretical support, see Alvarez, Lippi and Oskolkov (2022) and Cavallo et al (2024). For empirical evidence, refer to the recent studies cited in Section 2. [35]