RBA Annual Conference – 2013 The Economics of Shadow Banking Manmohan Singh[*]
1. Introduction
The past decade has witnessed rapid growth in financial intermediation that involves interaction between banks and non-banks. Coined under the rubric of ‘shadow banking’ the nexus between banks and non-banks is largely seen as a form of regulatory arbitrage. However, this is an incomplete view since there is genuine economic demand for these services. This paper attempts to explain the economics that support the demand for and supply of services in this market, the systemic risks that can arise, and regulatory and broader policy implications.[1]
To formulate a policy response to shadow banking, one needs to understand the ‘nuts and bolts’ of how these markets work. Shadow banking centres on the collateral intermediation function underpinning the plumbing of the financial markets. This includes the financial lubrication provided by intraday debits and credits, and cross-border payments of ‘cash or cash equivalents’ (i.e. money plus collateral) to meet margin and other obligations. Collateral underpins a wide range of financial transactions: secured funding (mostly provided by non-bank investors), repurchase agreements (or repos) and hedging (primarily with over-the-counter (OTC) derivatives). Since acceptable collateral is becoming increasingly scarce, a key shadow banking function is to mobilise and re-use collateral to support a large volume of transactions. Much of the ‘capital’ used in shadow banking, in the form of margins and over-collateralisation (via haircuts), does not make it onto the balance sheet. However, this capital remains ‘shadowy’ and not as easy to quantify as the Basel Committee's 8 per cent capital on the balance sheet for banks.
A globally integrated financial system needs to be able to manage counterparty risk. As aggregate economic activity rebounds and as regulations on the traditional banking system are tightened, the role of shadow banking will gain traction.
To the extent that many shadow banking activities have valid and valuable economic and financial market rationales, regulation should not be so strict as to undermine the benefits of shadow banking. However, this does not mean that a policy response is unnecessary, since systemic risk needs to be contained. In 2012, the Financial Stability Board (FSB) articulated an agenda to deal with regulatory weaknesses, spillovers and systemic risk in shadow banking (FSB 2012).[2] Short-term wholesale funding markets remain vulnerable five years after the failure of Lehman Brothers. In July 2013, Governor Daniel Tarullo, Member of the Board of Governors of the Federal Reserve System, reiterated that ‘a major source of unaddressed risk emanates from the large volume of short-term securities financing transactions in our financial system, including repos, reverse repos, securities borrowing, and lending transactions’ (Tarullo 2012, 2013).
The analysis allows four components of a comprehensive policy response to be outlined: (i) addressing systemic risks within the shadow banking system; (ii) addressing demand-side pressures and how to accommodate a shortage of safe and liquid assets; (iii) dealing with ‘puts’ to taxpayers from shadow banks, the focus of much recent regulatory action; and, most importantly, (iv) considering potential macroeconomic, monetary and quasi-fiscal implications.
Section 2 outlines a basic analytical framework for understanding what the shadow banking sector is and how it interacts with the traditional banking system. Section 3 describes the role of the shadowing banking sector in recycling collateral and the implications for this function of the potential shortage of assets that can be used as collateral. It also discusses collateral use and re-use (or, velocity) and how it affects non-bank funding to the banking sector. Section 4 summarises views on the shortage of safe assets. In an era of quantitative easing (QE) and regulatory proposals demanding more safe assets, this section proposes increasing collateral velocity to bridge the gap between demand and supply. Section 5 introduces the role of central banks in the non-bank/bank nexus since they are now (and will be in the near future) a major player in the collateral market. Section 6 highlights the risks that may still be inherent in the structure of the shadow banking sector that may require taxpayer bailouts. Section 7 concludes with some policy suggestions on how shadow banking affects monetary policy, quasi-fiscal policy and financial stability.
2. Basic Analytical Framework
Bank credit to ultimate borrowers is either funded by the equity of the banking system or by the funding that non-banks (e.g. households, pension funds and insurers) provide to the banking system. Following Shin (2010), this can be depicted as

where yi denotes the total lending to ultimate borrowers by bank i. The first term on the right-hand side denotes the total funding to the banking sector provided by non-banks (or, outside claimholders), where ei is the equity of bank i, zi is the fraction of non-bank funding that bank i receives, and λi is the leverage of bank i. The second term on the right-hand side denotes the total equity of the banking system.[3]
The traditional view of a banking system is that total funding from non-banks (the first term on the right-hand side) is relatively ‘sticky’. In other words, it is often assumed that non-bank funding to banks predominantly reflects households' deposits only (or M2), which grow steadily in line with evolution in household wealth (Adrian and Shin 2010; Shin 2010).[4] Thus, non-bank funding to banks is assumed to not vary much.
Under this assumption, rapid increases in the aggregate volume of credit supplied through the banking system must come via increased leverage (λi) which – due to the ‘stickiness’ of total non-bank funding and the stable nature of M2 – are assumed to come from increases in interbank claims.
This view, however, ignores the significant funding that banks receive from the asset management complex; this is not fully captured in monetary aggregates like M2. Even when household deposits are sticky, the presence of non-bank firms and intermediation through the shadow banking system allows leverage to rise quickly in both individual banks and the banking system as a whole.[5] In the United States, the gross volume of funding from non-banks that was intermediated by banks may have been as high as US$25 trillion and US$18 trillion at the end of 2007 and 2010, respectively. In other words, non-banks' funding to banks involves much more than just households and their deposits.
So, even with relatively stable M2, the banking system can become highly leveraged, not necessarily by increased interbank lending, but through the portfolio choices of the asset management complex. Unlike short-term household funds – which are primarily in M2 liabilities – short-term investments of asset managers are primarily in the form of non-M2 liabilities.[6] In turn, the supply of privately guaranteed non-M2 liquid assets is by and large a function of the aggregate volume of short-term claims.[7]
The term zi in Equation (1) can be expressed as

where zh is the fraction of funding that bank i receives from households, and zk is the fraction of funding that bank i receives from non-bank financial institutions.
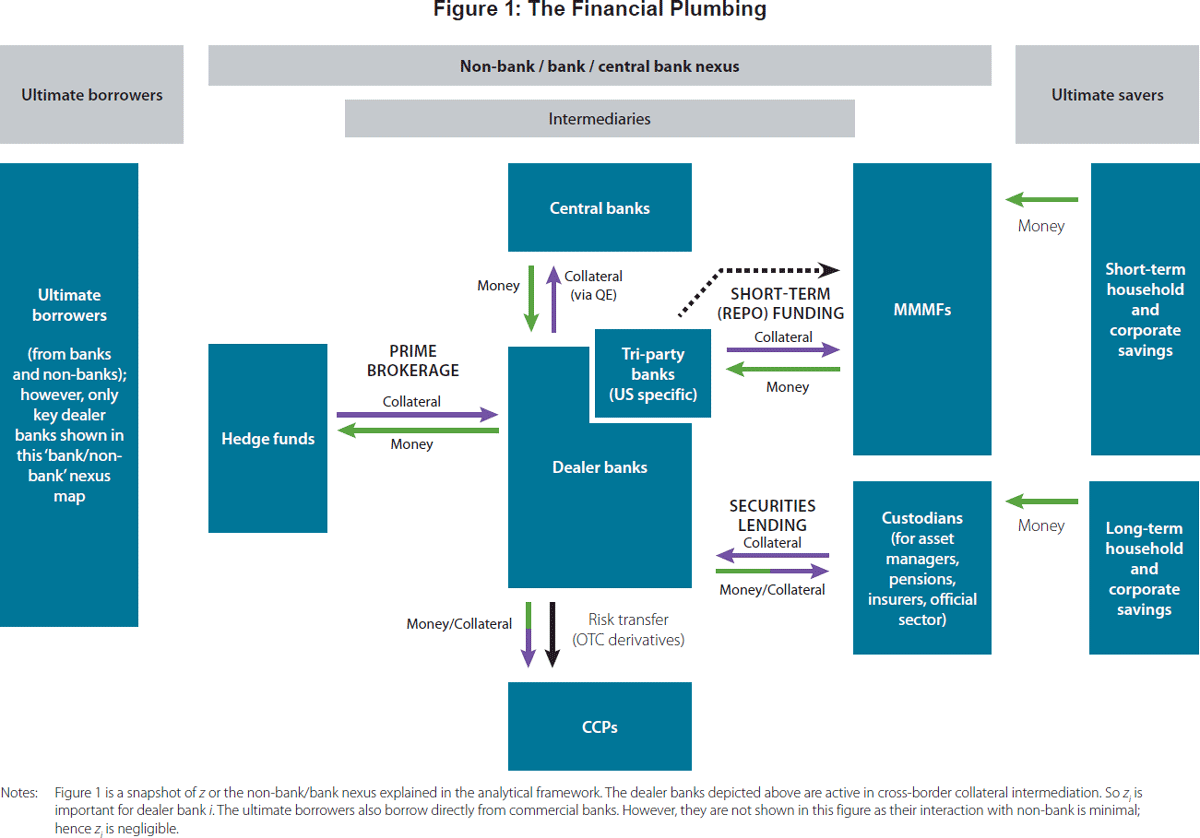
Figure 1 highlights the non-bank/bank nexus, which includes collateral velocity and leverage, that is key to understanding shadow banking.[8]
- Ultimate borrowers (Figure 1, left column), include corporations, households and government.
- Ultimate savers (Figure 1, right column), include short-term household and corporate savings and long-term investors through the asset management complex (insurance, pension funds).
- Dealer banks, which play a central role in intermediating collateral and money flows. These dealer banks connect the non-bank space, including recent central bank QE-type activities, and funnel collateral or money between various non-banks (money market mutual funds (MMMFs), hedge funds, pension funds, insurers, official sector accounts) and from non-banks to central banks.
3. Collateral Use and Re-use
Collateral provides the financial lubrication that allows intraday debits and credits to be made, and financial markets traditionally use ‘cash or cash equivalent’ (i.e. money plus collateral) to meet margin and other obligations. In addition, a great deal of short-term financing is generally extended by private agents against financial collateral. Financial collateral does not have to be rated AAA or AA; as long as the securities (i.e. debt or equity) are liquid, marked to market, and transferred under a legally enforceable cross-border master agreement, they will be considered ‘cash equivalent’. Pledged financial collateral is difficult to map but is a key component of financial plumbing.
The collateral intermediation function of the shadow banking sector is likely to become more important over time. In the short term, increased counterparty risks (as evidenced during 2007–2008 and in Europe today) make secured funding more attractive. In the longer term, with more arms-length transactions in an increasingly integrated global financial system, market participants are seeking the security of collateral to underpin a wider range of claims. New regulations are also likely to increase the demand for collateral-based operations.
The use and re-use of pledged financial collateral facilitates financial transactions and contributes towards the supply of credit to the real economy. Analogous to the traditional money-creation process, i.e. the lending-deposit-lending process based on central bank reserves, there is a multiplier effect. Collateral is like high-powered money, where the haircut is equivalent to the reserve ratio, and the number of re-pledges (the ‘length’ of the collateral chain) is equivalent to the money multiplier. The aggregate volume of re-pledged collateral reflects both the availability of ‘source’ collateral as well as the re-use rate of source collateral. Although collateral-backed credit does not increase the money supply, it does affect the real sector and the monetary policy transmission mechanism (Singh 2013a).[9]
The stock of collateral and its velocity (the intensity with which it is re-used) are both fundamental to understanding the financial plumbing in the shadow banking world. Since the failure of Lehman Brothers in 2008, the increase in aversion to counterparty risk and related issues have led to a significant drop in pledged collateral among the major US and European globally active banks and this market is not rebounding. This stems from a decline in both the collateral that is pledged for re-use and the associated re-use factor.[10]
The volume of collateral transactions has declined over the five years since the start of the crisis, from US$10 trillion in 2007 to US$6.0 trillion in 2012, while the stock of collateral has declined from US$3.4 trillion to US$2.8 trillion (Table 1). The stock of collateral can decline as investors become more concerned about counterparty risk, making them less willing to lend securities and more content to leave collateral sitting safely in segregated accounts. It can also be affected by central bank measures, such as large-scale asset purchases, which drain good quality collateral from the system, or a widening of the pool of collateral-eligible assets which increases the pledge-ability of these assets as collateral to the central banks (Singh and Stella 2012).
| Year | Sources | Volume of secured transactions |
Velocity | ||
|---|---|---|---|---|---|
| Hedge funds | Others | Total | |||
| 2007 | 1.7 | 1.7 | 3.4 | 10.0 | 3.0 |
| 2010 | 1.3 | 1.1 | 2.4 | 5.8 | 2.4 |
| 2011 | 1.3 | 1.05 | 2.35 | 6.1 | 2.5 |
| 2012 | 1.8 | 1.0 | 2.8 | 6.0 | 2.2 |
|
Sources: IMF staff estimates; The Risk Management Association; Singh (2011, 2012a) |
|||||
Collateral velocity – defined as the volume of secured transactions divided by the stock of source collateral – is affected by counterparty concerns and general risk aversion (due to higher haircuts), which then manifest as restrictions on the re-use of collateral. The velocity of re-use is an important concept and a key determinant of zi in Equation (1). Velocity can therefore change, like the velocity of money: it was 3 at end 2007, 2.4 at end 2010 and 2.2 at end 2012.
The collateral intermediation function of shadow banking is important within the financial system and, to the extent that it supports credit, it is also important for the real economy (although quantifying the economic importance is complex).[11] When collateral use drops, financial intermediation slows, with effects similar to the drying up of interbank markets (Adrian and Shin 2009; Singh 2012a). The velocity of re-use is an important concept and a key determinant of zi in the analytical framework of Section 2. The next section discusses the potential for a shortage of collateral eligible assets and the options available to policymakers to resolve any issues.
4. Shortage of Safe/Liquid Assets
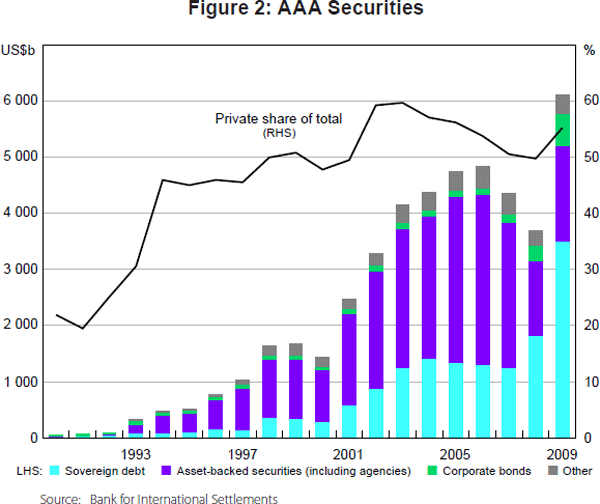
In the lead up to 2007, there was an increase in demand for safe assets. However, the supply of truly safe assets is relatively price-inelastic. This made the equilibrium price of government-guaranteed safe assets very high (and their yields very low or negative), creating incentives for the system to create private AAA-rated assets (Figure 2).[12]
Accordingly, a number of academics and policymakers have advocated correcting situations of excess demand for safe assets directly by having the government expand the supply of safe, short-term liquid instruments to crowd out those supplied by the shadow banking system (Ricks 2011; Gourinchas and Jeanne 2012; IMF 2012). In their models, the government is in a better position than the private sector to issue safe assets due to its power to tax, and the authors suggest that any excess demand can be met by offering more short-term debt. This would reduce demand pressures to create potentially relatively less safe private assets and remove a major source of systemic risk.
However, adjusting the supply of short-term government debt can come with some challenges, particularly related to debt management. Authorities may have to depart from widely accepted minimal cost rules in debt management (Garbade 2007). By issuing more short-term paper than would otherwise be necessary, the government would also take on some interest rate and operational risks from the private sector. An alternative to the government issuing more ‘safe assets’ at a cost to debt issuance, or increasing private sector supply, would be to increase the velocity of good collateral (i.e. high-quality liquid assets (HQLA)).
There may be other conceptual and practical limitations to the effectiveness of demand-side policies. It is unclear whether it is appropriate for the government to engage in creating financial market assets with the sole purpose of catering to a particular investment clientele.[13] For example, this may create moral hazard in that the private sector may come to expect that the government will accommodate its demand for specific types of assets.
5. New Entrants to Financial Plumbing: Central Banks
In recent years, the official sector has inadvertently absorbed good collateral and has become an integral participant in the non-bank/bank nexus. In particular, when central banks buy securities, for example via QE, one of the immediate effects is to increase bank deposits. In the United States, the Federal Reserve System (the Fed) has, in practical terms, bought securities from non-banks, not banks, and so QE has added to M2. Whether banks retain those additional deposits or convert them into other liabilities (or, by calling in loans, reduce or moderate the growth of their balance sheets) is an open question. This section discusses how QE-type efforts convert what had been HQLA (or good collateral) available to financial markets into additional bank liabilities (Singh 2013a).
5.1 Price of money and price of collateral
In some countries, such as the United States and the United Kingdom, the price of money and money market rates are not market-determined due to the payment of interest on excess reserves (IOER) at the central bank, which is available only to depository institutions. This creates a wedge between banks and non-banks that do not have access, and thus affects other short-end rates. For example, in the United States, the government-sponsored enterprises (GSEs) – that is, Freddie Mac and Fannie Mae – and other non-depository institutions are not eligible to deposit excess reserves at the Fed and thus do not have access to IOER. This has resulted in market segmentation and creates a wedge in money market rates because overnight rates for depository institutions cannot trade below the floor of the corridor, while the rates for non-depository institutions can. Thus the effective federal funds rate, which is calculated using all overnight transactions, can also fall below the floor.[14] This wedge between IOER and the effective federal funds rate is important; the federal funds rate was 9 basis points on 29 July 2013, quite some distance from expectations of an initial 25 basis points increase in policy rates. Compare this deviation of 16 basis points to the average daily absolute deviation of effective federal funds rate from their policy target of 3 basis points before the crisis (Stella 2013)!
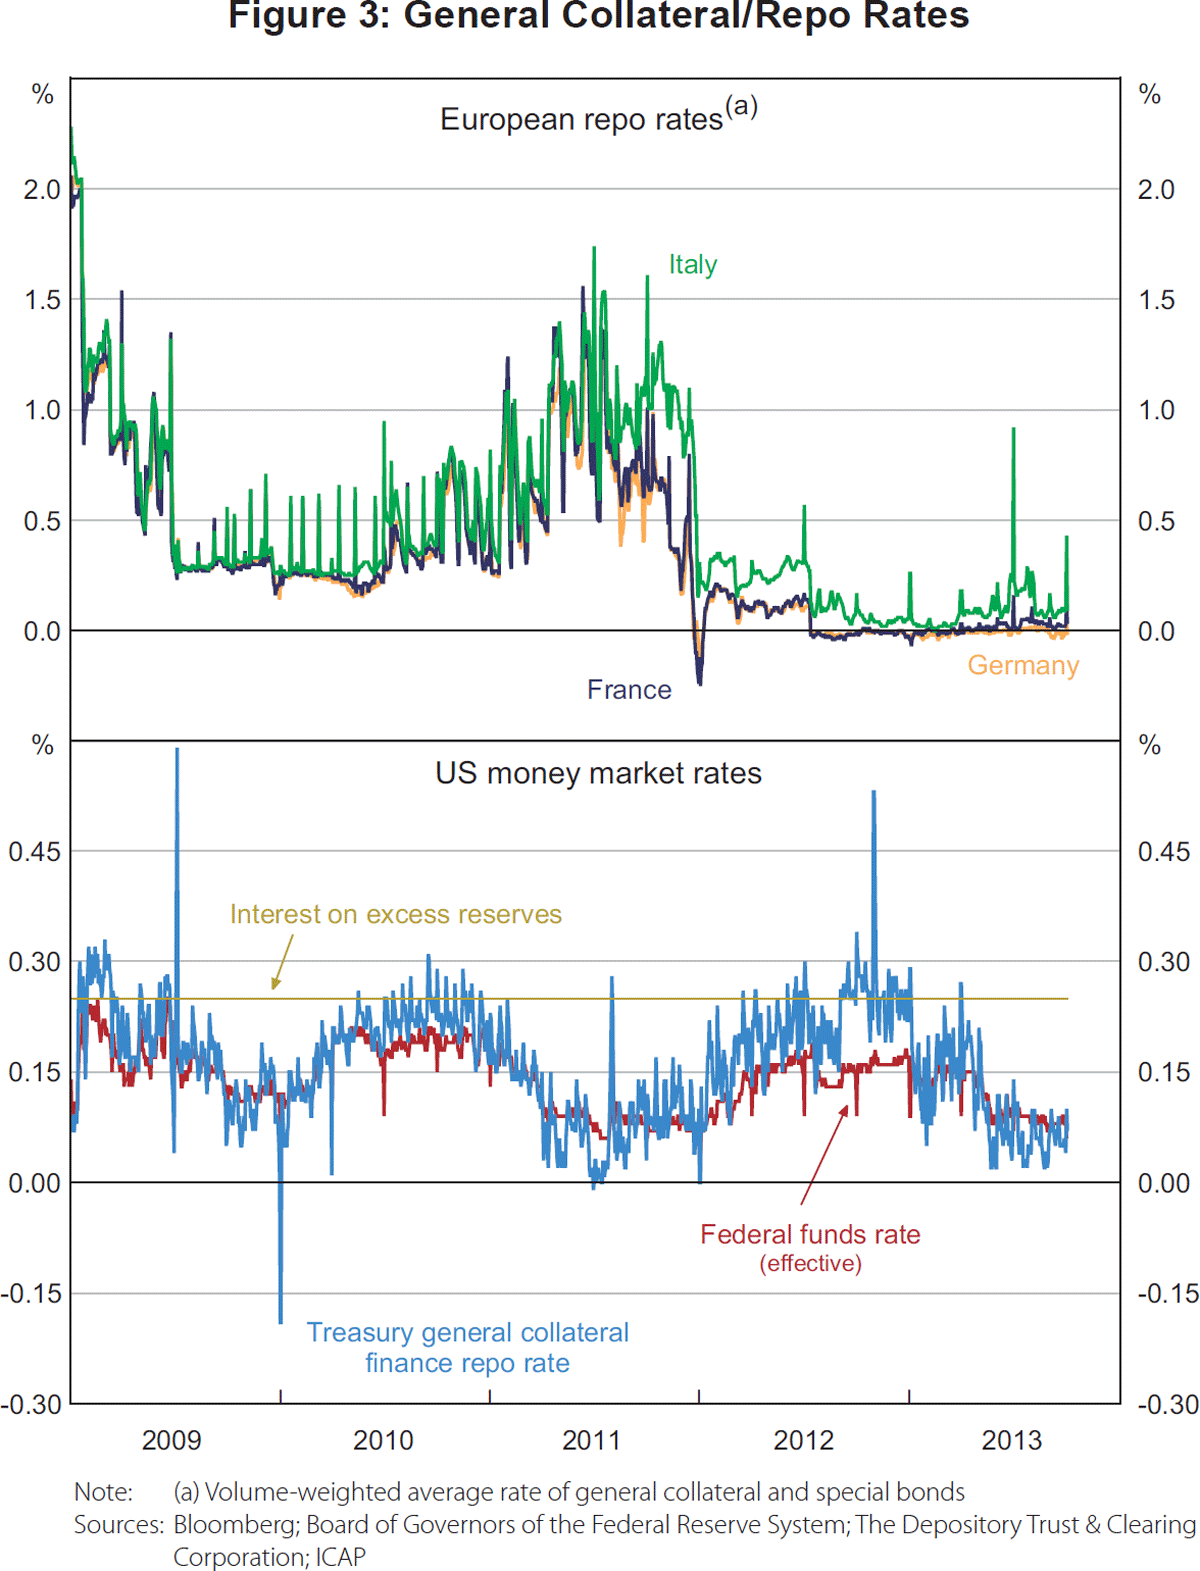
Now consider collateral or repo rates. Recall that the collateral rate (or repo rate) is the rate at which cash is lent against collateral for an agreed tenor. It is agreed upon by the two parties at the ‘start of repo’. Typically, a shortage of eligible collateral lowers repo rates; an abundance of collateral increases repo rates. Thus, the repo rate is a benchmark for collateralised transactions that underpin the financial plumbing between dealer banks and non-banks.
In theory, the price of ‘good collateral’ should not vary across assets except due to technical factors.[15] However, there is a wedge between comparable repo rates in the United States and the euro area (Figure 3). This is mainly because in the United States IOER and ‘Operation Twist’, which increased the supply of Treasury bills in 2012, have led to short rates remaining positive, whereas collateral/repo rates in some European countries, including Germany, France, the Netherlands, Denmark and Switzerland, have recently dipped below zero.[16]
5.2 Collateral and monetary policy – via the IS-LM framework
It is instructive to consider these developments using the classic textbook IS-LM framework. The recent collapse in financial collateral (by an estimated US$4–5 trillion), among other factors, has significantly shifted the IS curve in, lowering output to YB and decreasing the real interest rate (Figure 4). In recent years, QE efforts have shifted the LM curve to the right to accommodate this decline, until the LM curve eventually intersects with the IS curve at the initial output level, YA. The LM shift due to QE is sizeable (and continuing) and, combined with the inward shift of the IS curve, real interest rates may be well below zero. Due to distortions in money market rates (that are above zero in nominal terms), however, we do not see sub-zero real rates.
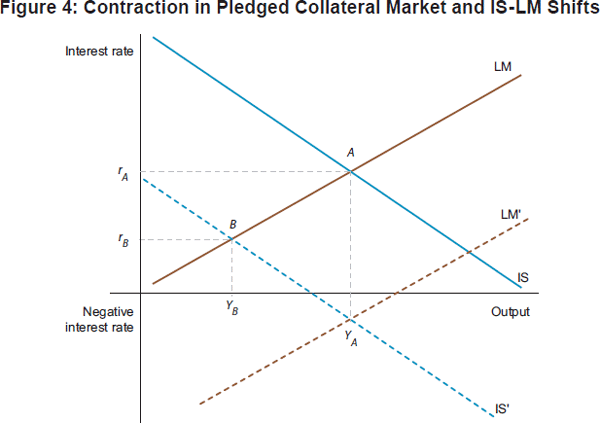
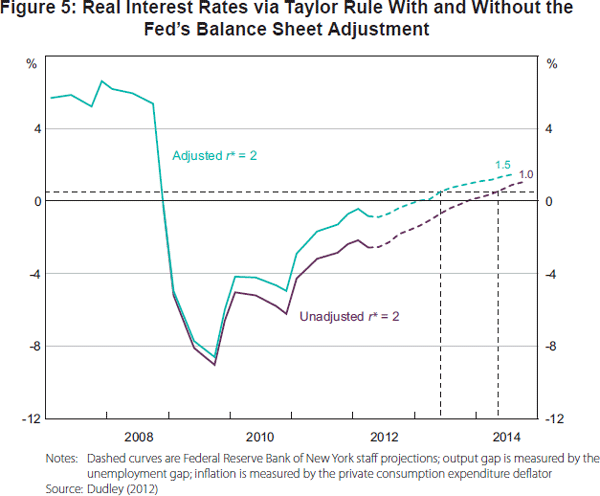
A recent speech by New York Fed President Bill Dudley suggests that the Fed's QE actions may have lowered nominal rates by an additional 150–200 basis points (Dudley 2012). So unadjusted real rates (i.e. if the Fed's balance sheet had remained at US$800 billion where it was around 2007) may be much lower than the adjusted real rates (due to the expanded balance sheet via QE) that are officially announced and that do not reflect the rate cuts embedded within QE (Figure 5). Given that the three most recent tightening cycles in the United States have averaged close to 400 basis points, this suggests the next tightening cycle could increase the policy rate to 2 per cent if it starts from minus 2 per cent. This suggests that the intersection of LM' and IS' is at YA and, analytically, in Figure 4, at approximately minus 2 per cent.
5.3 Central banks and repo markets
The past few years since the failure of Lehman Brothers have seen major central banks take out good collateral from markets and replace it with central bank balances (except the ECB which has provided central bank balances in return for bad collateral). Sooner or later, these balance sheets will unwind – either voluntarily when central banks reverse their policy stances, or involuntarily as the securities held by central banks mature or roll-off. Analytically, this will move the LM curve to the left. Simultaneously the rate of release of collateral (in lieu of money) will move the IS curve up. So an unwind of QE will increase both the (money) interest rate and the (collateral) repo rate.[17] As both rates move up, policymakers will attempt to avoid creating a wedge between them. Looking forward, it will be paramount that central banks gain back their ‘policy rate’, typically set by macro factors underlying the Taylor rule, such as output gap, inflation forecasts, etc.
Since central bank balance sheets are presently bloated with collateral, some (e.g. the Fed) have envisaged an ‘unwind’ that may occur in parallel and overlap with the path of projected rate increases.[18] However, the collateral/repo rate will need to be contained below the policy rate to avoid inflationary dynamics.[19] Thus repo rates will remain an important gauge of market conditions when central banks unwind. Analogous to a coiled spring, the larger the QE efforts the lesser the control central banks may have on the ‘wedge’ between repo rates and their policy rate (e.g. IOER). This may have financial stability implications, since the repo curve is a good indicator for how collateral flows between banks and non-banks.
Box A: Pledged Collateral and Money Aggregates
Annual reports of large banks suggest that financial collateral (including collateral re-use) is sizeable and comparable with monetary aggregates such as M2 or broad money. Taking into account collateral use/re-use in addition to M2 or the monetary base in the United States, United Kingdom and euro area, financial lubrication was over US$30 trillion before the failure of Lehman Brothers (with one-third comprising pledged collateral).[1] The subsequent decline in both available collateral and associated re-use of collateral was sizeable (an estimated US$4–5 trillion). This is the difference between the magenta and blue lines in Figure A1. Note that the increase in M2 due to QE does not substitute for loss in financial collateral, especially if QE involves the purchase of good collateral, such as US Treasuries (Singh and Stella 2012).[2]
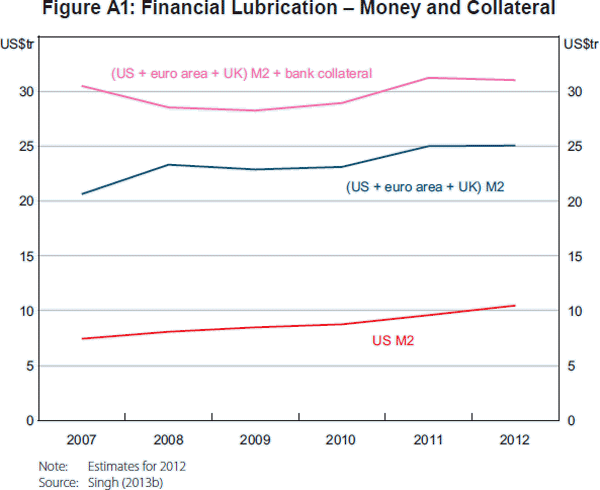
The ‘kinks’ in the blue line in Figure A1 show M2 expansion due to QE. As at the end of 2012, overall financial lubrication (M2 + bank collateral) had rebounded to approximately US$30 trillion, but the ‘mix’ is more in favour of money (around 80 per cent of financial lubrication). Not only does money have lower velocity than pledged collateral, but much of it ‘sits’ as excess reserves with central banks (Singh 2011). Thus a rebound in the pledged collateral market may be more effective in easing liquidity constraints in financial markets than further QE. For example, the Fed's balance sheet has over US$1.8 trillion in excess reserves of large banks that does not contribute fully towards financial lubrication; these reserves can circulate in the interbank market, but cannot circulate between banks and non-banks. More importantly, the net cost or benefit of QE will become apparent when central banks address the trade-offs that need to be made in the unwind of QE securities on their balance sheets (or, when they elect not to unwind but instead to continue to ‘carry’ the collateral until it matures).
6. Some ‘Puts’ that have Remained at Large
In this section – an intended detour – we highlight the key non-banks that, due to their interconnectedness with the dealer banks, may (again) benefit from taxpayer support during the next financial crisis, despite attempts to rein in such ‘puts’. What are these puts and why do they continue to exist? We discuss the typical players in the shadow banking literature that may access the ‘puts’: hedge funds, money market funds, central counterparties (CCPs) that will inherit OTC derivatives from dealer banks, and the tri-party repo entities (specific to the United States). Providing puts, ex ante, for fear that the ex post bailout may be even more expensive encourages moral hazard and potential regulatory arbitrage. The key non-banks that engage with dealer banks in the shadow banking system are identified in Figure 1.
6.1 Hedge funds
One source of systemic risk (and risk to the public safety net) in collateral intermediation is the liquidity exposure of dealer banks to customers such as hedge funds. Dealer banks routinely use some collateral obtained from customers (e.g. rehypothecation of collateral received from hedge funds) for their own funding. A customer withdrawal may then have liquidity implications for the dealer bank, which will have to find new sources of collateral or liquidate its own positions (Duffie 2010). Runs by prime brokerage clients (typically hedge funds) demanding the return of their collateral were a major source of instability for dealer banks in 2008 (including all stand-alone US investment banks, such as Bear Stearns, Lehman Brothers and Merrill Lynch), ultimately leading to large central bank and government support measures. Now, new regulations monitoring large non-banks are in place (in the United States) and non-bank SIFIs are also being designated by other regulators.[20] Since the failure of Lehman Brothers, the Financial Services Authority (now the Prudential Regulation Authority and the Financial Conduct Authority) has also come a long way in articulating the UK's rehypothecation rules to hedge funds domiciled in its jurisdiction.
6.2 Dealer banks' non-depository affiliates
The ‘puts’ to the safety net are especially significant when a dealer bank is also a depository institution. This creates the scope to shift risks between the depository and non-depository parts of the business (Singh 2012b), which potentially subsidises shadow banking activities by reducing the funding cost.[21] Such conglomeration also creates conflicts and regulatory challenges, and increases risks to the taxpayer.[22] Yet, to date there is no comprehensive framework for regulating broker-dealers that is as well-articulated as the one that exists for banks.[23] Thus, systemic risks and puts to the safety net from dealer banks are likely to persist.
6.3 Money market mutual funds (MMMFs)
There is also need for progress on MMMFs. Although smaller than before the financial crisis, the US money fund industry remains systemic and fragile. It offers ‘redeemable at par’ guarantees that cannot, as the crisis demonstrated, be supported in times of stress when asset values drop. In the crisis, this necessitated government support (McCabe 2011). Reforms currently being contemplated include lowering the average asset maturity of MMMFs, introducing capital requirements, requiring a floating NAV (as is largely the case in Europe), and using two-class claims on assets (one redeemable at par and the other contingent on the NAV). Choices are still to be made. In the meantime, MMMFs remain a significant source of systemic risk: in the United States, the government might (again) be forced to step in to limit the spillovers from a run as happened in 2008 (McCabe et al 2012). Interestingly, constant NAV in Europe is only allowed for short-term MMMFs (Ansidei et al 2012); these MMMFs operate with a very short weighted-average maturity (WAM) and weighted-average life (WAL) – the logic is sound that anything beyond short term should not be constant or ‘par’ (Ansidei et al 2012).
6.4 Qualified financial contracts
Qualified financial contracts (QFCs) take the form of derivatives and repos. Prevailing legal rules, such as the ‘safe harbour’ provision, allow some QFCs to be exempt from ‘automatic stay’ during bankruptcy, i.e. they are prioritised in reorganisation because they are deemed to be too interconnected with financial markets and any reformulation in bankruptcy could be disruptive. This exemption reduces market discipline and effectively subsidises the contracts' counterparties (dealer banks and the wider shadow banking system) at a cost to other creditors and the public safety net. While there is little to suggest that legal changes are imminent, recent studies highlight that the exemption status might not be economically justified (Bliss and Kaufmann 2005; Bolton and Oehmke 2011; Summe 2011).
- OTC derivatives move to CCPs. At the G20 meeting in Pittsburgh in 2009, it was decided that a critical mass of dealer banks' derivative-related risks would be moved to CCPs (which were until then viewed under the rubric of payment systems). This is a huge transition, primarily to move the risk from OTC derivatives outside the banking system. These new entities may also be viewed as ‘derivative warehouses’, or concentrated ‘risk nodes’ of global financial markets.[24] On average, each of the key dealer banks in Figure 1 carried about US$100 billion of derivative-related tail risk around Lehman's demise – this is the cost to the financial system from the failure of a dealer bank, where tail risk is measured by ‘residual’ derivative liabilities of a dealer bank (i.e. after netting and collateral – see Appendix A for details). Yet, instead of addressing the derivatives tail risk, the present regulatory agenda is focused on offloading all (or most) of the derivatives book to CCPs (Singh 2010).[25] CCPs have also been incorrectly regarded as utilities.[26]
- Tri-party repo. A distinct part of the collateral intermediation process, the tri-party repo (TPR) market, can present a different set of systemic risks. TPR is a major source of wholesale funding for banks and dealer banks, especially in the United States, where volumes approach US$1.8 trillion (down from US$2.7 trillion in 2007). In the US TPR market, one of the two intermediaries (either JPMorgan or Bank of New York) facilitates repo operations between counterparties, some of which are primary dealers, by providing intra-day overdraft facilities. Reforms to TPR are in motion, but under current arrangements the intraday position constitutes a risk to the intermediaries – and indeed is the reason Bank of New York is designated a SIFI. This highlights the ‘put’ faced by taxpayers. Since the TPR market differs from the bilateral pledged collateral market (which is truly mark-to-market and is the main subject of this paper), Appendix B describes the TPR market more fully. In continental Europe and the United Kingdom, TPR activity has increased in recent years to roughly €1.1 trillion, largely due to multinational companies keeping money overseas and recent counterparty risk concerns regarding large banks. Four tri-party agents intermediate this market: Euroclear and Clearstream, two ‘utility-type’ systems owned by users or a stock exchange, and Bank of New York and JPMorgan.
7. Policy and Macro Implications of Shadow Banking
Shadow banking is highly procyclical, which may have adverse real-sector consequences. For example, secured lending and repos rely on mark-to-market prices and margins/haircuts that adjust over the financial cycle; in the extreme, some collateral may become unacceptable during periods of turmoil. Also, shadow banking services give rise to greater financial system interconnectedness, which may help to reduce idiosyncratic risk through diversification but also exposes the system to spillovers in the event of large shocks (Acemoglu, Ozdaglar and Tahbaz-Salei 2012). The merit of proposals to reduce procyclicality via ex ante haircut schedules is not clear; this will be impossible to implement in bilateral collateral agreements as it can distort market-based price-setting for pledged collateral – the essence of financial plumbing![27]
Shadow banking is likely to have important interactions with monetary policy. Just as interest rate transmission can be impaired if the banking system is weak, the broader channels of monetary policy transmission depend on well-functioning capital markets, including shadow banking.
The state of private, safe asset supply and the stock and velocity of collateral can therefore affect monetary policy transmission, with macroeconomic consequences. And monetary policy can affect risk-taking in shadow banking. When the interest rate is low, a steeper yield curve that increases the pay-off to maturity transformation and risk-taking can trigger an expansion of shadow banking activity, potentially leading to financial fragility (Adrian and Shin 2010; Singh and Stella 2012).
And, during crises, shadow banking may require public support, with possible fiscal implications.[28] During and after the financial crisis, the Fed had to support dealer banks and MMMFs via various facilities. While in some cases ultimate fiscal implications were limited, the contingent liabilities and risks of such operations were significant. Unless the systemic risks in shadow banking are addressed, these contingent liabilities (or ‘puts’) will remain in place, with perhaps larger actual costs in future crises.
Addressing risks in the shadow banking system is a work in progress for regulators and policymakers, and research has yet to catch up fully with the issues (see Appendix C).[29] Current regulatory approaches are actively pushing banks away from short-term, secured, wholesale funding markets and giving them incentives to issue more deposits and term funding. The likely result would be that riskier activities move outside the banking system (proprietary desks, hedge funds, and OTC derivatives to CCPs, to name a few), and into the shadow banking world.
Also if there is a shortage of safe/liquid assets, collateral transformation is likely to fill the void, but this will increase the nexus between banks and non-banks. As new regulations take effect, the demand for HQLA is likely to be accommodated by the 10–15 dealer banks that intermediate between banks and non-banks (Figure 1). This would entail ‘connecting’ clients (such as pension funds) that have good collateral with, for example, a hedge fund that does not have good collateral but needs to post collateral acceptable to a CCP. In general, central banks, sovereign wealth funds, and long-term asset managers require collateral that has low volatility, but is not necessarily highly liquid. These entities should be net providers of liquidity to the financial system. On the other side are banks, hedge funds and mutual funds that have a dramatically shifting need for liquid, ‘good’ collateral. So a market for collateral upgrades, or collateral transformation, in theory, could work (if not constrained by leverage and liquidity ratios). It should be noted that collateral transformation will further ‘interconnect’ the financial system. Thus, going forward, understanding and correctly mapping the shadow banking system will become even more important for policymakers.
Appendix A: Over-the-counter Derivatives – Risk Transfer from Banks to CCPs
OTC derivatives markets straddle regulated systemically important financial institutions and the shadow banking world. Recent regulatory efforts focus on moving OTC derivatives contracts to CCPs. A CCP will be collecting collateral and netting bilateral positions. While CCPs do not have explicit taxpayer backing, they may be supported in times of stress. For example, the US Dodd-Frank Act allows the Federal Reserve System to lend to key financial market infrastructures during times of crisis. Even in the absence of clearing mandates, incentives to move OTC contracts could come from increasing bank capital charges on OTC positions that are not moved to CCPs (BCBS-IOSCO 2012).
The notional value of OTC contracts is about US$600 trillion, but while much cited, that number overstates the still very sizeable risks. A better estimate may be based on adding ‘in-the-money’ (or gross positive value) and ‘out-of-the money’ (or gross negative value) derivative positions (to obtain total exposures), further reduced by the ‘netting’ of related positions. Once these are taken into account, the resulting exposures are currently about US$3 trillion, down from US$5 trillion (see Table A1). However, when a dealer bank fails, its ‘out-of-the money’ positions are the real risk to the remaining counterparties (of the failed bank) who are de facto unhedged. Thus from the perspective of reducing taxpayer liability, exposure to dealer banks' ‘out-of-the money’ positions needs to be eliminated (which would be half the BIS figures shown in Table A1; Singh (2011)).
| Gross market value | ||||||||||||||
|---|---|---|---|---|---|---|---|---|---|---|---|---|---|---|
| 2008 | 2009 | 2010 | 2011 | 2012 | ||||||||||
| H2 | H1 | H2 | H1 | H2 | H1 | H2 | H1 | H2 | ||||||
| Total | 35,281 | 25,314 | 21,542 | 24,673 | 21,296 | 19,518 | 27,285 | 25,392 | 24,740 | |||||
| Foreign exchange contracts | 4,084 | 2,470 | 2,070 | 2,524 | 2,482 | 2,336 | 2,555 | 2,217 | 2,304 | |||||
| Interest rate contracts | 20,087 | 15,478 | 14,020 | 17,533 | 14,746 | 13,244 | 20,001 | 19,113 | 18,833 | |||||
| Equity-linked contracts | 1,112 | 879 | 708 | 706 | 648 | 708 | 679 | 645 | 605 | |||||
| Commodity contracts | 955 | 682 | 545 | 457 | 526 | 471 | 487 | 390 | 358 | |||||
| Credit default swaps | 5,116 | 2,987 | 1,801 | 1,666 | 1,351 | 1,345 | 1,586 | 1,187 | 848 | |||||
| Unallocated | 3,927 | 2,817 | 2,398 | 1,788 | 1,543 | 1,414 | 1,977 | 1,840 | 1,792 | |||||
| Gross credit exposure (a) | 5,005 | 3,744 | 3,521 | 3,578 | 3,480 | 2,971 | 3,912 | 3,668 | 3,626 | |||||
|
Note: (a) Gross market values have been calculated as the sum of the total gross positive market value of contracts and the absolute value of the gross negative market value of contracts with non-reporting counterparties; gross credit exposure is after taking into account legally enforceable bilateral netting agreements Source: Bank for International Settlements |
||||||||||||||
Another important metric is the under-collateralisation of the OTC market. The BIS estimates that the volume of collateral supporting the OTC market is about US$1.9 trillion. Assuming a collateral re-use rate between 2.2 and 3.0, the dedicated collateral is some US$700–900 billion. Some counterparties (e.g. sovereigns, quasi-sovereigns, large pension funds and insurers, and AAA corporations) are often not required to post collateral. The remaining exposures will have to be collateralised when moved to a CCP to avoid creating puts to the safety net. As such, there is likely to be an increased demand for collateral worldwide.
Appendix B: The Tri-party Repo Market
A tri-party repo (TPR) operation is an arrangement whereby a clearing bank acts as an intermediary for two repo counterparties. Around 50 to 70 per cent of repo operations in the United States are cleared using TPR, with recent volumes approaching US$1.8 trillion, much below the US$3 trillion in 2008.[30] The TPR market is a major source of wholesale funding for banks and dealer banks. The US market is serviced by two clearing banks, Bank of New York and JPMorgan, both determined ‘systemic’ by the FSB. Pledged collateral is held with custodians and cannot be re-pledged. The TPR arrangement has several advantages as it allows market participants to exchange collateral baskets, and also to outsource risk management (haircut calculation, margin calls, and substitution), pricing, and other ancillary tasks.
A distinguishing feature of the US TPR market is the daily unwind process. Borrowers want to have access to their pledged securities for routine daily trading purposes. This is enabled by the daily unwind, where at the start of the trading day collateral is returned to borrowers and cash to lenders, even if these were pledged under term transactions. Collateral and cash are then returned to the clearing bank before close of business. Since borrowers nevertheless have financing needs during the day, a clearing bank may extend intraday overdrafts on an unsecured basis (although regulators may require that banks call for collateral to support such overdrafts). This means that risks associated with lending are fully transferred twice during a full day: they are with ultimate lenders and secured overnight, and with the clearing bank and unsecured during the day.
The unwind process creates multiple risks. Clearing banks carry large-scale unsecured exposures relative to their capital. Since money is returned to them daily, the lenders see their position as short-term and money-like, even for term contracts. Given counterparty risk, however, the arrangement is inherently as vulnerable as other private safe asset arrangements, and indeed only official sector support helped avoid a run during the financial crisis similar to that experienced by prime money market mutual funds.
Current regulatory efforts are focused on limiting the duration of intraday credit by pushing the unwind to later in the day and improving intraday collateral management (Copeland, Martin and Walker 2010). Still, the intraday exposures remain large (of up to $100 billion on average per counterparty) and operationally difficult to reduce. This may preclude an unwinding of the role played by Bank of New York and JPMorgan – hence the TPR market may remain a ‘put’ to taxpayers. In continental Europe and the United Kingdom, TPR activity has increased in recent years to roughly €1.1 trillion due to multinational/corporate treasuries keeping money overseas and counterparty risk concerns regarding large banks. The key agents, Euroclear and Clearstream, do not provide intraday financing.
Appendix C: Flow of Funds Data and Limitations
Banking sector and other financial data are captured in flow of funds (FoF) statistics, such as those produced by the US Federal Reserve System. Yet aspects that describe the banking sector's nexus with the non-banks are not covered by the FoF statistics. This short appendix attempts to highlight some of the salient aspects of the US FoF statistics to show that, even in mature markets like the United States, there are ‘data gaps’ in financial statistics that need to be complemented by a rigorous analysis of off-balance sheet statistics, and linkages with other sectors that are outside the regulatory perimeter.
First, special investment vehicles, off-balance sheet entities, were sizeable ahead of the 2007–2008 financial crisis. Although they are picked up in the FoF data, these data are aggregated. Presently, there is no way of using FoF data to trace back the banking sector's off-balance sheet liabilities to asset-backed commercial paper (ABCP) and MMMFs. Hedge funds' holdings of financial assets are buried in the FoF data on the ‘household’ sector. By aggregating and netting across all banks, the FoF loses relevant information. For example, securities lending on line 130 of the FoF is shown ‘net’ in line 20, and thus would not highlight a large positive build-up of exposure in, say, Bank X, and a negative build-up in, say, Bank Y. Thus there are limitations in using the FoF to detect early warning signals of stress in the banking sector.
Second, derivatives market developments are also difficult to track in the FoF. Financial statements do not provide the under-collateralisation (or margin shortfall) of derivative positions. Further, entities book their derivatives transactions differently. Among the recent additions to the ‘banking community’, Goldman Sachs maintains most of its plain vanilla derivatives books in the bank, while its equity and commodities derivatives are conducted out of the brokerage subsidiary. In the case of Morgan Stanley, most of its (notional) derivatives positions were still being conducted outside the commercial bank. The FoF accounts presently only reflect the flow of savings and investment of an economy. Derivatives unbundle risks associated with the securities that transmit the flow of savings and investments. To adequately track the workings of modern financial systems, the FoF will ultimately have to include ‘satellite’ accounts that track the flow of risks and collateral.
Third, more granularity is needed in the breakdown of short-term money market instruments. FoF data use the term ‘open market paper’ to capture money market instruments such as financial, non-financial and ABCP, Treasury bills, agency discount notes, etc. Not only is the breakdown of short-term instruments insufficiently granular, but it is impossible to track important details regarding holdings of short-term instruments (e.g. money funds', securities lenders' or corporate Treasurers' holdings of short-term investments). In summary, instruments of maturity transformation and the holders of risks related to maturity transformation are close to impossible to track through the FoF accounts.
Fourth, bank holding companies such as Citibank, JPMorgan, Deutsche Bank, Goldman Sachs and Morgan Stanley are not fully reflected in banking statistics. FoF shows all elements of the holding company (bank, dealer, asset manager, etc) but ‘separates’ the holding company's balance sheets and then aggregates all banks in one sheet; all dealers in another sheet, etc. This aggregation loses the overall picture of the holding company; hence the need to go back to the banks' 10Q/10K returns to see the build-up of all business positions of the bank holding company from its various components under one roof.
Overall, non-bank linkages with the banks are not fully captured in FoF statistics. Thus FoF data need to be augmented by other information that is usually buried in the footnotes to financial statements.
Footnotes
Responsibility for any errors rests with the author. [*]
FSB (2011) defines shadow banking broadly as ‘credit intermediation involving entities and activities outside the regular banking system’. While measures of shadow banking differ considerably, the system is large, comparable in size to traditional banking and continuing to grow. [1]
Prior to the crisis, much of the discussion of shadow banking was on securitisation and the upgrade of assets, including: the use by banks of affiliated investment vehicles to offload credit risks (and economise on capital); credit and liquidity guarantees with too little provisioning; and investments in structured products where capital charges did not reflect underlying risks (Gorton and Metrick 2010; Kane 2012; Acharya, Schnabl and Suarez 2013). This paper will not repeat this literature but rather is forward looking and thus will focus on forthcoming issues. [2]
This notation does not fully accord with current accounting and regulatory conventions. For example, from a regulatory point of view, until Basel III is implemented, leverage refers mostly to on-balance sheet leverage. Under Basel III, several off-balance sheet items will come onto balance sheets by 2017. [3]
Adrian and Shin (2010, p 8) note that ‘M2 … is a good proxy for the total stock of liquid claims held by ultimate creditors against the financial intermediary sector as a whole’ and later demonstrate that M2 has been slow moving or stable over time, expanding ‘by a factor of 2.4 since 1994’. Shin (2010, p 8) notes that ‘[t]he total debt liabilities of the banking sector to the household creditors can be expected to be sticky, and would be related to total household assets … For the purposes of short-term comparative statics, we could treat it as a constant’. [4]
Leverage is typically measured on a gross basis and interbank lending on a net basis. As an example, suppose Bank A wants to buy a million dollars of securities from a non-bank firm using funding received from Bank B (on the basis of the collateral of the securities). Further suppose that Bank B refinances from Bank C and that Bank C in turn refinances with Bank D, itself funded by an ultimate non-bank saver (i.e. household or mutual fund). Assets of Banks A, B, C and D each rise by $1 million, for a total of $4 million – gross interbank lending/borrowing of $3 million and financing from non-banks of $1 million. Since capital has not changed, bank leverage goes up. [5]
Since the money holdings of asset managers are ultimately the claims of households, it follows that households ultimately fund banks through both M2 and non-M2 instruments. It is important to note, however, that while households' direct holdings of M2 instruments reflect their own investment decisions, their indirect holdings of non-M2 instruments are not a reflection of their direct investment choices, but the portfolio choice and investment management techniques of their fiduciary asset managers. [6]
See Pozsar and Singh (2011) for another interpretation of z. [7]
There are other commercial banks (not shown in Figure 1) that are not active in collateral intermediation but connect ultimate savers to ultimate borrowers via syndicated loans, letters of credit, and traditional banking services. These are not the global systemically important financial institutions (G-SIFIs). Rather, they span the small, medium-sized and even global non-dealer banks. In the analytical framework described above, the business operations of these commercial banks (generally) do not interact with non-banks via derivatives, securities lending, repo agreements or prime-brokerage activities. Hence the zi for commercial bank i will not be significant. However, the ultimate borrowers (yi) will borrow from both types of banks. [8]
The term re-pledged is a legal term and means that the dealer receiving the collateral has the right to re-use it in its own name (i.e. the recipient takes title). Title transfer is essential to collateral velocity. In the bilateral pledged collateral market, contracts that span repo, securities lending, OTC derivatives and customer margin loans involve title transfer. [9]
Since cross-border funding is important for large banks, the state of the pledged collateral market needs to be considered when setting monetary policy (Debelle 2012). [10]
For example, a pension fund adept in securities lending may augment returns to its pensioners in the real economy. As another example, a hedge fund may bid for an IBM bond issue, since it has funds via its prime broker (in lieu of collateral posted). A higher number of bidders lowers IBM's cost of bond issuance, thereby benefiting the real sector. [11]
As documented by Duffee (1996) and Greenwood, Hanson and Stein (2012), investors will pay a ‘premium’, i.e. accept a lower yield, for government-guaranteed securities, as they offer a preferred combination of safety and liquidity. [12]
For example, Claessens et al (2012) argue that the supply of Treasury bills should increase to accommodate demand from MMMFs since there is a shortage of safe assets. Recall, the US Treasury discontinued 30-year bonds in the early 2000s due to a primary surplus in the Clinton years – the Treasury did not factor in the demand for duration coming from pension funds and insurers. It should also be noted that the role of government policy in fine-tuning debt issuance is diminished when debt levels are either high or capped (Greenwood et al 2012). [13]
Following the failure of Lehman Brothers, the Fed introduced IOER for depository institutions. This was intended to place a ‘floor’ (minimum bid) on short-term liquidity in the corridor system. See Bech and Monnet (this volume). [14]
Technical issues include, among other things, ‘home’ bias, the relative liquidity/depth/size of euro area and US collateral markets, different QE policies, and cheapest-to-deliver collateral. See Fegatelli (2010) for a discussion of the euro area collateral market. [15]
Siloed collateral has zero velocity by definition. Market sources indicate that good euro area collateral (including equity and corporate bonds) is being purchased by some central banks and therefore ‘removed’ from the market; this a drag on European Central Bank efforts to keep the collateral re-use rate high. [16]
There is likely to be an asymmetry between the pace at which the Fed acquired collateral from the market under QE and the pace at which it will unwind its holdings. It is useful to make the distinction between ownership and possession – this is, after all, the collateral market we're talking about. Treasury bonds and agency mortgage-backed securities have a number of different characteristics (e.g. fixed duration, credit quality, liquidity). These securities can therefore perform many different functions (markets can buy ‘pure’ duration; sell duration short; or transfer possession to meet collateral needs, etc). The Fed has been absorbing these securities from the market with the sound macroeconomic objective of taking duration out of the economy (the portfolio balance channel), but duration is a function of ownership, not possession. The Fed can't let the ownership of these securities go back to the private market until the economy is strong enough to handle the duration (which is why the Fed is likely to unwind its holdings only slowly). Duration, however, isn't the service that the market needs. The economy needs the collateral services that these securities can offer, which transfers with possession, not ownership. The Fed needs a way to transfer possession to the market without ownership. Current SOMA (System Open Market Account) lending doesn't fit the bill, as it is a Treasury-for-Treasury swap executed to cover shortages in specific issues. The Fed has therefore proposed a reverse-repo program for the unwind of its balance sheet (contingent on balance-sheet space at banks and non-banks, amid a tighter regulatory environment). Most of the securities bought under the QE program were acquired from non-banks (via the banks). Banks were largely a conduit for QE securities, and with Basel III regulations at the door, there is limited appetite for these securities. Whether non-banks will have balance-sheet space and appetite to buy them back is the key question. [17]
See exit strategy minutes as per FOMC (2011). [18]
In the United States, the repo rate could differ from IOER depending on the rate of release of collateral via reverse repos, an important unwinding avenue that has been suggested by the Fed. If the Fed unwinds, the eligible counterparties for reverse repos (RRs) now include not only banks but also non-banks such as the GSEs and selected MMMFs. The repo rate will be determined by the size of RRs, along with the broader supply and demand conditions in the market. A number of regulatory initiatives under the rubric of shadow banking, primarily in the United States, will influence this process. These include, among others, altering the operating model of the MMMFs by removing the requirement to maintain a constant net asset value (NAV) and reforming the GSEs and the tri-party repo system. The balance sheet capacity of the ‘shadow banking’ system is, however, crucial if collateral needs to be unwound from central banks, given constraints on banks' balance sheets arising from Basel III capital, leverage and liquidity ratios. The Fed's trial reverse repo program is largely between the Fed and non-banks, which cannot rehypothecate the collateral they receive. The Fed thus controls collateral velocity, which effectively prevents repo rates from going over the interest rate paid on excess reserves. Even if there were sufficient balance sheet space, the ability of the Fed to engage in RRs could be limited as sizeable RRs could lead repo rates to significantly exceed the IOER, in turn generating inflationary dynamics or expectations thereof. Therefore, a balance will need to be struck between the price of money (IOER) and the price of collateral (repo rate) (Singh 2013b). [19]
See Auer (2012). In the United States, the SEC's Rule 13c3 and Regulation T cap use of client funds by dealer banks. The United Kingdom has no such caps. [20]
For example, in the United States, after Bank of America and Merrill Lynch merged, the OTC derivatives book of Merrill Lynch was ‘moved’ to the depository part of the merged entity. As a consequence, taxpayers may now provide a stronger backstop to the bank's overall derivatives activities. [21]
Since the crisis, all dealer banks have had access to central bank liquidity facilities through related commercial banks, even though the depository part can represent as little as 5 per cent of the group's overall balance sheet (the highest is 60 per cent; see Singh (2012b)). This offers stability of funding, but increases moral hazard, as a dealer bank can shift risky assets to its bank subsidiary. More generally, dealer banks may have both the incentive and the capacity to increase risks in more extreme ways than do commercial banks. The financial crisis has made it clear that the regulation and supervision of broker-dealers was not sufficiently rigorous, and orderly resolution remains a challenge. [22]
In the United States, the Dodd-Frank Act gives authorities powers to move a systemically important broker-dealer under the supervision and regulation of the Federal Reserve System. This may strengthen supervision by making it more comprehensive, but it does not address how to effectively regulate a dealer bank – that is, a broker-dealer that is an integral part of a banking group. Note that in the United States and elsewhere, while the safety net can extend to the whole SIFI, the broker-dealer operations can dwarf its banking part; for example, deposits of US and EU SIFIs – that is, the bank part – are often less than a third of the overall assets of the SIFI in the bank holding company. Similarly, while the Dodd-Frank Act enables an orderly liquidation of a dealer bank by the Federal Deposit Insurance Corporation, the precise processes have neither been fully articulated in theory nor tried in practice. At the same time, the Dodd-Frank Act has tightened the rules of lender-of-last-resort support to non-banks (Tucker 2012). Individual firm assistance is no longer available, although broad-based lending programs are still allowed in systemic crises, subject to approval by the Treasury Secretary. [23]
There are many proposals on trying to unwind SIFIs; it is a difficult (if not an impossible) task. So creating new SIFIs such as CCPs should be backed by sound economics. [24]
At a hearing of the House Committee on Financial Services, former FDIC Chair Shelia Bair testified to being ‘surprised at the lack of concern over the designation of “financial market utilities”, and particularly Section 806 which permits the Federal Reserve to provide safety net access to designated financial market utilities’ (Bair 2013). [25]
The revenue/benefits from OTC derivatives come from three sources: the origination fee plus netting on books plus the clearing fee. Banks will still keep all of the origination fee, plus some of the netting (from OTC derivatives that do not clear). A utility has two characteristics: (a) government backstop but (b) at negotiated ‘economic rents’. So for CCPs to be utilities, all three revenue components identified above (which comprise the total economic rent) should be negotiable. But banks will never forego the origination or structuring fee; this is the biggest piece. The negotiation between regulators and banks is such that this fee will remain undisclosed – usually buried under the line item FICC (fixed income, currency and commodities) of their annual reports. Regarding CCPs as utilities is not appropriate unless they control the full spectrum of ‘economic rents’. [26]
Credit Support Annexes that accompany OTC derivative contracts, or master agreements that underpin cross-border repo and securities lending are privately negotiated bilateral agreements in which regulators should not intervene. Such contracts include the ‘legal wheels of title transfer’ and are designed to make financial collateral akin to money so that market participants can settle obligations (e.g. accounts, margins) using cash or cash equivalents. [27]
As the rate cycle will increase from near zero rates, a higher monetary policy rate will also increase quasi-fiscal costs (for the Fed and Bank of England that provide interest on excess reserves). [28]
However, synonymous with the assumption that shadow banking is a pejorative term, much of the collateral intermediation is assumed to be risky by financial regulators. [29]
The bilateral pledged collateral market is not trivial. For example, hedge funds (HF) are increasingly funding themselves via repo. HF repo is estimated (on average) at about US$750–900 billion (Singh 2012b); given that UK hedge funds are about 25 per cent of the market – the US market accounts for about US$600 billion and the rest of the world for the balance. If the present size of the TPR market is US$1.8 trillion, and HF repo in US is about US$600 billion, then without considering securities lending, TPR is about 70 per cent of the repo market. However, securities lending is akin to repo (as legally they are very similar). Estimates of US securities lending is about US$800 billion; Europe is about US$200 billion. Thus the non-TPR market may be 45 per cent of overall repo-like activities (which is US$1.4 trillion/US$3.2 trillion). [30]
Footnotes Box A
Japanese Government Bonds are generally not used in the cross-border pledged collateral market; hence, Japan is not included here. [1]
Although there is a continuum between good and bad collateral, for simplicity we define C1 as good collateral in all states of the world, which can be converted to money (M) at no haircut. C2 is collateral that under normal market conditions is ‘good’ but loses its value in adverse states of the world. During a crisis, C1 (such as US Treasuries or Bunds) and M may continue to be acceptable at par, but all other securities cease to be liquid. To the extent that central banks merely substitute central bank money (M) for assets that have retained their value as collateral (C1), not much liquidity relief is achieved. In order to provide effective liquidity relief for the system, central bank money and liquid collateral must be injected against illiquid or undesirable assets (C2); the supply of unencumbered collateral has to increase. Central banks may become subject to a form of Gresham's Law (i.e. ‘bad collateral will drive out good collateral from markets’) if they prove slow or reluctant to loosen their collateral policies. Just as water finds its own level, collateral in the market domain generally finds its economic rent when it is pledged for re-use. [2]
References
Acemoglu D, A Ozdaglar and A Tahbaz-Salei (2012), ‘Systemic Risk and Stability in Financial Networks’, unpublished manuscript, Massachusetts Institute of Technology.
Acharya VV, P Schnabl and G Suarez (2013), ‘Securitization without Risk Transfer’, Journal of Financial Economics, 107(3), pp 515–536.
Adrian T and HS Shin (2009), ‘Collateral Shortage and Debt Capacity’, unpublished manuscript.
Adrian T and HS Shin (2010), ‘The Changing Nature of Financial Intermediation and the Financial Crisis of 2007–09’, Federal Reserve Bank of New York Staff Report No 439, rev April.
Ansidei J, E Bengtsson, D Frisson and G Ward (2012), ‘Money Market Funds in Europe and Financial Stability’, European Systemic Risk Board Occasional Paper Series No 1.
Auer L (2012), ‘Testimony of Deputy Assistant Secretary Lance Auer’, Testimony before the House Financial Services Financial Institutions Subcommittee Hearing entitled ‘Implementing Title I of the Dodd-Frank Act: The New Regime for Regulating Systemically Important Nonbank Financial Institutions’, Washington DC, 16 May.
Bair S (2013), ‘Testimony of Sheila C. Bair Chair of the Systemic Risk Council and Former Chair of the Federal Deposit Insurance Corporation’, Testimony before the House Committee on Financial Services Hearing entitled ‘Examining How the Dodd-Frank Act Could Result in More Taxpayer-Funded Bailouts’, Washington DC, 26 June.
BCBS-IOSCO (Basel Committee on Banking Supervision and Board of the International Organization of Securities Commissions) (2012), Margin Requirements for Non-Centrally-Cleared Derivatives, Consultative Document, Bank for International Settlements, Basel.
Bliss RR and GG Kaufman (2005), ‘Derivatives and Systemic Risk: Netting, Collateral, and Closeout’, Federal Reserve Bank of Chicago Working Paper No WP2005-03.
Bolton P and M Oehmke (2011), ‘Should Derivatives be Privileged in Bankruptcy?’, NBER Working Paper No 17599.
Claessens S, Z Pozsar, L Ratnovski and M Singh (2012), ‘Shadow Banking: Economics and Policy’, IMF Staff Discussion Note SDN/12/12.
Copeland A, A Martin and Michael Walker (2010), ‘The Tri-Party Repo Market before the 2010 Reforms’, Federal Reserve Bank of New York Staff Report No 477.
Debelle G (2012), ‘On Europe's Effects on Australian Financial Markets’, Address to Bloomberg Seminar, Sydney, 14 February.
Dudley B (2012), ‘Conducting Monetary Policy: Rules, Learning and Risk Management’, Remarks at the C. Peter McColough Series on International Economics, Council on Foreign Relations, New York, 24 May.
Duffee GR (1996), ‘Idiosyncratic Variation of Treasury Bill Yields’, The Journal of Finance, 51(2), pp 527–551.
Duffie D (2010), ‘The Failure Mechanics of Dealer Banks’, The Journal of Economic Perspectives, 24(1), pp 51–72.
Fegatelli P (2010), ‘The Role of Collateral Requirements in the Crisis: One Tool for Two Objectives’, Banque Central du Luxembourg Working Paper No 44.
FOMC (Federal Open Market Committee) (2011), ‘Minutes of the Federal Open Market Committee June 21–22, 2011’, Board of Governors of the Federal Reserve System, Washington DC.
FSB (Financial Stability Board) (2011), ‘Shadow Banking: Scoping the Issues’, April.
FSB (2012), ‘Strengthening Oversight and Regulation of Shadow Banking: An Integrated Overview of Policy Recommendations’, Consultative Document, 18 November.
Garbade KD (2007), ‘The Emergence of “Regular and Predictable” as a Treasury Debt Management Strategy’, Federal Reserve Bank of New York Economic Policy Review, 13(1) pp 53–71.
Gorton G and A Metrick (2010), ‘Regulating the Shadow Banking System’, Brookings Papers on Economic Activity, Fall, pp 261–297.
Gourinchas P-O and O Jeanne (2012), ‘Global Safe Assets’, BIS Working Paper No 399.
Greenwood R, SG Hanson and JC Stein (2012), ‘A Comparative-Advantage Approach to Government Debt Maturity’, Harvard Business School Working Paper No 11–035.
IMF (International Monetary Fund) (2012), ‘Safe Assets: Financial System Cornerstone?’, in Global Financial Stability Report: The Quest for Lasting Stability, World Economic and Financial Surveys, IMF, Washington DC, pp 81–122.
Kane E (2012), ‘The Inevitability of Shadowy Banking’, Paper presented at the Federal Reserve Bank of Atlanta 2012 Financial Markets Conference ‘The Devil's in the Details’, Stone Mountain, 9–11 April.
McCabe PE (2011), ‘An A-/B-Share Capital Buffer Proposal for Money Market Funds’, unpublished manuscript, Board of Governors of the Federal Reserve System.
McCabe PE, M Cipriani, M Holscher and A Martin (2012), ‘The Minimum Balance at Risk: A Proposal to Mitigate the Systemic Risks Posed by Money Market Funds’, Federal Reserve Bank of New York Staff Report No 564.
Pozsar Z and M Singh (2011), ‘The Nonbank-Bank Nexus and the Shadow Banking System’, IMF Working Paper No WP/11/289.
Ricks M (2011), ‘Regulating Money Creation After the Crisis’, Harvard Business Law Review, 1(1), pp 75–143.
Shin HS (2010), ‘Financial Intermediation and the Post-Crisis Financial System’, BIS Working Paper No 304.
Singh M (2010), ‘Collateral, Netting and Systemic Risk in the OTC Derivatives Market’, IMF Working Paper No WP/10/99.
Singh M (2011), ‘Velocity of Pledged Collateral: Analysis and Implications’, IMF Working Paper No WP/11/256.
Singh M (2012a), ‘The (Other) Deleveraging’, IMF Working Paper No WP/12/179.
Singh M (2012b), ‘“Puts” in the Shadow’, IMF Working Paper No WP/12/229.
Singh M (2013a), ‘The Changing Collateral Space’, IMF Working Paper No WP/13/25.
Singh M (2013b), ‘Collateral and Monetary Policy’, IMF Working Paper No WP/13/186.
Singh M and P Stella (2012), ‘Money and Collateral’, IMF Working Paper No WP/12/95.
Stella P (2013), ‘Orchestrating the Exit’, Stellar Consulting LLC – A Research Blog, 31 July. Available at <stellarconsultllc.com/blog/wp-content/uploads/2013/07/Orchestrating-the-Exit.pdf>.
Summe K (2011), ‘An Examination of Lehman Brothers' Derivatives Portfolio Post-Bankruptcy and Whether Dodd-Frank Would Have Made Any Difference’, Hoover Institution, Stanford University, Working Group on Economic Policy, Resolution Project draft paper.
Tarullo DK (2012), ‘Shadow Banking After the Financial Crisis’, Keynote address to the Federal Reserve Bank of San Francisco Conference on Asian Banking and Finance ‘Challenges in Global Finance: The Role of Asia’, San Francisco, 11–12 June.
Tarullo DK (2013), ‘Dodd-Frank Implementation’, Testimony before the United States Senate Committee on Banking, Housing, and Urban Affairs, Hearing on ‘Mitigating Systematic Risk Through Wall Street Reforms’, Washington DC, 11 July.
Tucker P (2012), ‘Shadow Banking: Thoughts for a Possible Policy Agenda’, Speech given at the European Commission High-Level Conference ‘Towards a Better Regulation of the Shadow Banking System’, Brussels, 27 April.