Bulletin – May 2002 Statement on Monetary Policy
Download the complete Statement 930KB
Since the beginning of this year there has been a clear shift in sentiment regarding prospects for the world economy. Forecasts for global growth have been revised upwards, and the large downside risks that were prevalent earlier in the year have generally dissipated. It now appears that most economies passed their weakest point late last year or early this year, although the recovery in 2002 embodied in current forecasts is generally relatively modest.
The turnaround has been most marked in the United States, where the economy grew strongly in the March quarter following modest growth in the December quarter, confirming that the slowdown in 2001 was quite mild and short-lived. This does not, of course, mean that the imbalances affecting the US economy have been fully resolved. The corporate sector in particular is still facing difficulties, and there are also doubts as to whether household spending growth can continue at its recent pace. Hence there remain risks to growth, and a somewhat slower pace can be expected in the remainder of the year. Even so, the recovery to date has exceeded earlier expectations. Monetary and fiscal policy settings are assisting growth and confidence has improved.
Conditions are also looking more promising in other parts of the world. The recovery in the US and improved conditions in the technology sector have contributed to a rebound in most east Asian economies in the early part of this year. In addition, domestic demand in these countries has been bolstered by the policy stimulus put in place last year. Cyclical conditions in Europe appear to be lagging those in the US, but there are signs that growth has resumed in recent months. There have also been signs of stabilisation in Japan. Although considerable downside risks remain, there has been an encouraging pick-up in the export-oriented sector of the Japanese economy, with manufacturing production increasing in the March quarter for the first time in over a year.
In contrast to most other economies, the Australian economy continued to grow strongly, despite the contractionary effect of the global slowdown. GDP grew by slightly more than 4 per cent over 2001, and appears to have sustained a similar pace of growth to date in 2002. In part, this relative strength has reflected the absence of a number of imbalances that have been retarding growth in other countries, particularly the US (for a comparison of the US and Australian economies, see Box A).
The latest indications are that household spending is still expanding at a robust pace, and conditions appear supportive of a continuation of this trend. Consumer confidence is high, and the strong growth in employment over the first part of this year should help sustain further growth in household spending in the period ahead, although this may to some extent be offset by rising petrol prices. While some of the recent strength in the labour market may have reflected postponement of hiring by businesses late last year when growth prospects were less promising, there does seem to have been a marked turnaround in labour market conditions since the beginning of the year. Forward indicators of labour demand remain favourable, with surveys of business hiring intentions at high levels and measures of job vacancies stronger in recent months.
Household spending has also been supported by increases in wealth, primarily resulting from rising house prices. House price rises of around 15 to 20 per cent have been recorded in a number of cities over the past year and, while increases of this magnitude are not exceptional for a single year, strong price rises have been ongoing for several years. Hence the cumulative increases over the past five years have been substantial, and are similar in real terms to those that occurred over the second half of the 1980s. Associated with the general rise in house prices in recent years has been a rapid expansion in household borrowing, which grew by 16½ per cent over the past year. A continuation of this trend clearly carries the risk of households, at some point, becoming overstretched.
The strength of house prices at present appears to be decoupled from trends in house-building activity. There are signs of over-supply in some areas of the market, and forward indicators of the housing sector have for some time been indicating that activity will slow in the second half of the year. At the same time, other parts of the economy are likely to strengthen, so that the composition of growth can be expected to change during the course of the year. Exports are likely to strengthen in line with an improving international outlook, and a rebound in business investment is also in prospect.
Businesses have become significantly more optimistic since the beginning of the year and balance sheets are in a healthy position, given the solid growth in profits that has occurred over the past year. Combined with the low cost of financing, these factors have contributed to a significant upgrade in investment intentions. In addition, there are a number of large infrastructure projects already underway or soon to commence which should also contribute to robust growth in output in the period ahead.
With global economic prospects improving in recent months, financial markets in many countries have begun to price in monetary tightening in the year ahead, in expectation that central banks will look to restore interest rates to more normal levels after the substantial easings that took place last year. A number of central banks have already begun to raise official interest rates.
This swing in interest rate expectations was also evident in Australia. In fact, with the Australian economy surprising most observers with its resilience, and maintaining a growth rate substantially faster than that of other developed economies, expectations of monetary tightening built quite quickly. As late as February, markets were pricing in the likelihood of a prolonged period of steady interest rates, but by early May they were expecting increases in official rates of about one percentage point over the course of this year. The Bank's decision to raise official rates by ¼ percentage point, to 4.5 per cent, in its May Board meeting had therefore been largely anticipated by markets.
The relative strength of the Australian economy has also been reflected in other ways in financial markets. Share prices in Australia, despite recent falls, remain more robust than in other countries, as company profits here have held up better than elsewhere. Also, there has been a significant increase in demand for Australian dollars, resulting in a rise in the exchange rate of about 5 per cent against the US dollar and a little less in trade-weighted terms.
The inflation outcome in the March quarter was broadly in line with the outlook presented in previous Statements, and showed that inflation remained close to the top of the target range. The increase in the CPI in the quarter was boosted by a number of seasonal influences, including the price of Pharmaceuticals and education, as well as a further large rise in the cost of overseas travel, while petrol prices again fell slightly in the quarter and, over the past year, have reduced the rise in the CPI. Over the year these influences have roughly offset one another, so that underlying inflation is probably about the same as CPI inflation.
The recent rise in international oil prices, if sustained, should boost the CPI over the next few quarters both through the direct impact on households and possibly indirectly through increased pressure on business margins. At the same time, upstream cost data suggest that other sources of pressure on business margins may have eased for the time being (except for rising insurance premiums and utility prices).
In the past few years the broader trend in inflation has been upward, with the inflation rate (excluding tax effects) gradually rising from under 2 per cent in 1998 to around 3 per cent in the most recent couple of quarters. This trend has in part reflected the substantial depreciation of the Australian dollar that took place over the 1997–2000 period. These exchange-rate effects have been expected to fade gradually, and, with domestic cost pressures well contained, recent Statements have presented a relatively benign inflation outlook, stating that inflation would decline to around the middle of the target band over the course of 2002. The Bank's assessment is that this outcome is still likely over the coming year, particularly given the recent tendency of the Australian dollar to appreciate, which should help further dampen inflation pressures in the tradable sector. However, the significant strengthening in the domestic economy that has become evident in recent months suggests that the longer-term risks to the inflation outlook have increased, with upward pressures on inflation likely to predominate beyond the end of this year. Over the course of 2003, inflation is expected to rise back toward the top of the target band, as a continuation of rapid growth in demand and activity would see capacity constraints start to put upward pressure on wages and prices.
During 2001 the Bank reduced interest rates to historically low levels, reflecting principally a deteriorating international outlook and the potential risks that this posed to the Australian economy, while at the same time Australia was judged to have a relatively benign inflation outlook. In recent months the economic climate has clearly changed, with the Australian economy proving very resilient to these forces and global prospects improving. Against this background the Board concluded at its May meeting that the previous setting of monetary policy was no longer appropriate. Maintaining the cash rate at such a low level risked amplifying inflationary risks and fuelling other imbalances that could jeopardise a continuation of the current economic expansion. The decision to raise the cash rate by 25 basis points was aimed at reducing these risks, and thereby enhancing the prospects for sustained growth with low inflation.
Box A: Comparing the Recent Economic Performance of Australia and the US
Economic conditions in Australia and the US have diverged markedly over the past couple of years. The US economy experienced a sharp slowdown in 2001 – with year-ended growth in GDP declining from around 5 per cent in mid 2000 to ½ per cent in December 2001 – before beginning to recover towards the end of the year (Graph A1). In Australia, economic growth slowed in the second half of 2000, with year-ended growth in GDP reaching a trough of 1½ per cent in the December quarter 2000, before rebounding strongly to over 4 per cent by the end of 2001. Much of the slowdown in Australia reflected the large swing in dwelling investment associated with the changes to the tax system in the middle of 2000 – excluding dwelling investment, year-ended growth in output only declined to 2½ per cent.
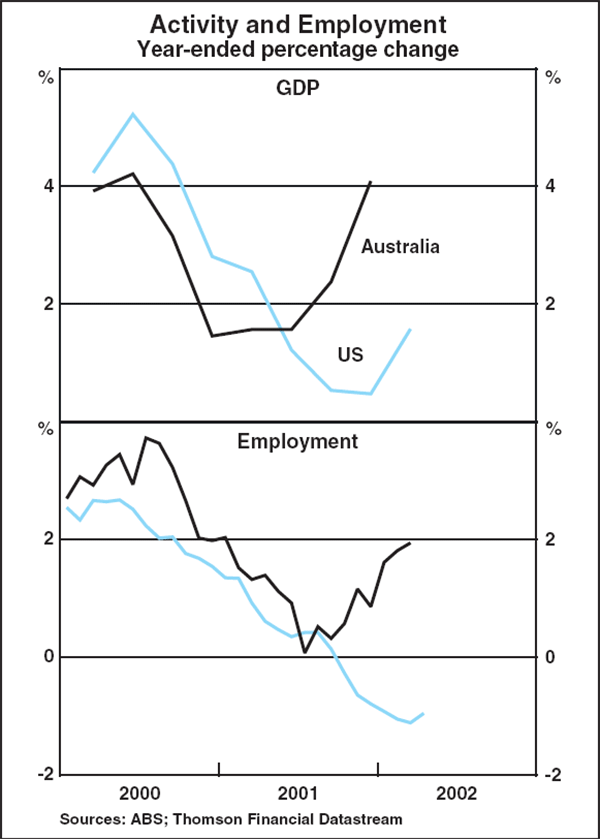
This disparity in the growth rates of the two economies is reflected in the labour market, where employment has increased by nearly 2 per cent in the year to the March quarter in Australia, while over the same period it has declined by around 1 per cent in the US. The index of consumer sentiment in Australia has been much stronger than similar indices in the US. In part reflecting the differing levels of resource utilisation, underlying inflation has picked up in Australia over the past couple of years to be just under 3 per cent, while in the US the CPI (excluding food and energy) has remained steady through this period and is currently a little under 2½ per cent (Graph A2).
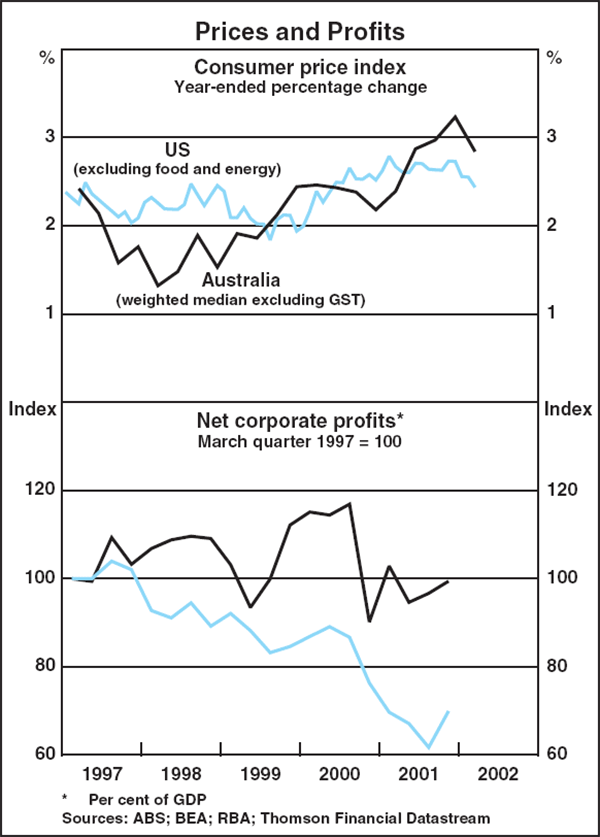
The divergence of the two economic cycles, in part, reflects a number of imbalances in the US economy, particularly relating to the corporate sector, that are not present in the Australian economy. Over 2001, corporate profits in the US declined by over 6 per cent but, over the same period, grew robustly in Australia. Consequently, the profit share in the US has declined in the past two years to be well below its long-run average, whereas in Australia the profit share has remained relatively constant around its historical average.
This contrast between the corporate sectors in the two countries has been reflected in their share markets. The Australian share market reached an historical high in March 2002 and has risen by 8 per cent over the past two years. It is currently only 4 per cent below its peak. Since reaching its peak in March 2000, the US share market has fallen by around 30 per cent.
International Economic Developments
Global economic conditions have improved in recent months, driven mainly by a pick-up in the US and several Asian countries. In the US it seems clear that the trough in activity was in the September quarter 2001 and a recovery is now underway. In particular, demand in the information technology and communications (ITC) sector, which was the major source of weakness in the 2001 slowdown, is picking up. This has benefited a number of countries in the Asian region, but domestic demand is also recovering in these economies reflecting the policy stimulus put in place last year. The slowdown in Europe has lagged that of the US, yet there are some indications of improvement. In contrast, conditions in Japan remain weak, though there are some tentative signs of stabilisation.
The IMF and Consensus forecasts released in April suggest a recovery in world growth to around 2¾ per cent in 2002 and a further pick-up to around 4 per cent next year (Table 1). If this were to eventuate, the trough in growth in 2001 will have been shallower than that recorded in the global recessions of the early 1980s and 1990s. However, the rebound expected over the course of 2002 is expected to be modest, with growth in G7 countries not returning to around its long-run average until the end of 2003 (Graph 1). This reflects the fact that in contrast to earlier slowdowns, household consumption and activity in the housing market in the industrialised countries has remained resilient, buoyed by stimulatory macroeconomic policies, strong growth in incomes and the decline in oil prices through 2001. Accordingly, households may be somewhat overstretched and the boost in household spending that is normally associated with the recovery phase of the cycle is likely to be more muted this time.
| 2002 | 2003 | |||
|---|---|---|---|---|
| 2000 | 2001 | IMF forecasts (April 2002) | ||
| United States | 4.1 | 1.2 | 2.3 | 3.4 |
| Euro area(a) | 3.4 | 1.5 | 1.4 | 2.9 |
| Japan | 2.2 | −0.4 | −1.0 | 0.8 |
| China | 8.0 | 7.3 | 7.0 | 7.4 |
| Other Asia(a) | 7.5 | 1.2 | 3.4 | 4.7 |
| G7(b) | 3.6 | 1.1 | 1.5 | 2.8 |
| World(b) | 4.7 | 2.4 | 2.8 | 4.0 |
|
(a) GDP weights Source: IMF |
||||

There are risks on both sides of this outlook. On the downside, any further decline in asset markets, particularly in the US, could result in a retrenchment of business investment and household spending. A further deterioration in the outlook for Japan would also pose a risk to the recoveries in the rest of Asia. The political tensions in the Middle East could have a significant impact on the global recovery were oil prices to rise substantially from current levels (see ‘Oil Price Developments’ below). On the other hand, notwithstanding the recent upward adjustments to some official interest rates, macroeconomic policy settings could remain very accommodative and, as a result, the recovery might be stronger than is currently forecast.
North America
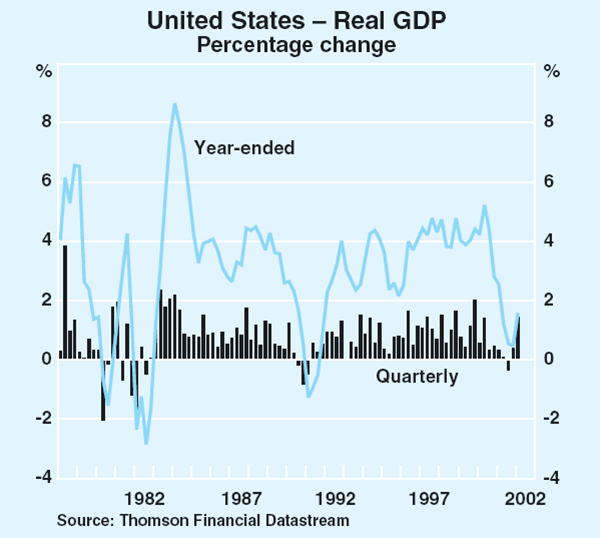
Output in the US grew strongly in the March quarter, with GDP increasing by 1.4 per cent, to be 1.6 per cent higher over the year, implying that the downturn in 2001 was relatively mild and short-lived (Graph 2). Household consumption continued to contribute to growth and public demand again grew strongly, particularly defence-related spending (Table 2). Economic conditions in the business sector were mixed. Inventories made a large contribution to growth in the March quarter. However, business investment continued to fall – particularly investment in buildings and transport equipment – though business spending on ITC equipment rose for the first time in over a year.
| March quarter 2002 |
Year to: | |||
|---|---|---|---|---|
| September 2001 | March 2002 | |||
| Private consumption | 0.9 | 2.4 | 3.3 | |
| Residential investment | 3.7 | 3.9 | 4.6 | |
| Business investment | −1.5 | −5.8 | −10.7 | |
| Public demand | 1.9 | 3.4 | 5.8 | |
| Change in inventories(a) | 0.9 | −1.2 | −0.1 | |
| Net exports(a) | −0.4 | 0.0 | −0.5 | |
| – Exports | 1.7 | −9.2 | −9.2 | |
| – Imports | 3.7 | −6.8 | −3.9 | |
| GDP | 1.4 | 0.5 | 1.6 | |
|
(a) Contribution to GDP growth Source: Thomson Financial Datastream |
||||
The ongoing strength of the household sector into the new year reflected the boost to household incomes from the additional income tax cuts from 1 January and the withdrawal of home equity through mortgage refinancing late last year. However, the pace of consumption growth has slowed from the very strong rate of late last year, in part reflecting the recent pick-up in oil prices which is likely to have dampened households' non-oil consumption. Consumer sentiment has also levelled out.
The unemployment rate rose to 6 per cent in April (Graph 3). The manufacturing sector has continued to shed jobs, though the pace of losses has slowed considerably and the employment component of the Institute of Supply Management (ISM) index is around its highest level since late 2000. Employment has increased modestly in the services and government sectors.
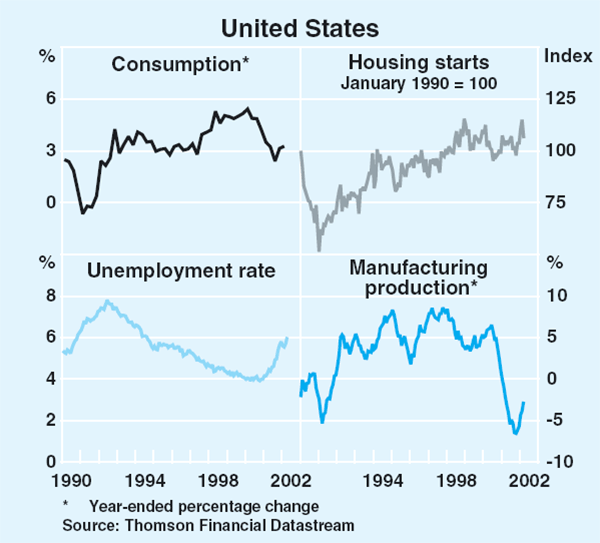
Manufacturing production increased for the first time in over a year in the March quarter, with ITC production rising by 4 per cent. Manufacturers' overall sentiment according to the ISM index has improved markedly in recent months to be significantly above 50, a level associated with increasing production.
Consumer price inflation, after reaching a low of 1.1 per cent earlier in the year reflecting the decline in energy prices over the course of 2001, increased slightly to 1.4 per cent over the year to March. Core inflation, which excludes food and energy, has eased slightly to be around 2½ per cent over the past year, though this reflects divergent trends in goods and services prices (Graph 4). Growth in the national accounts measure of core inflation has also slowed over the past year. Wage outcomes have begun to drift lower, with growth in the wages and salaries component of the employment cost index continuing to ease.
Reflecting its assessment that the outlook for prices remains benign, the US Federal Reserve has maintained its accommodative monetary policy stance, leaving official interest rates at 1¾ per cent since last December. Nevertheless, the Fed moved its balance of risks from being on the ‘downside’ to ‘neutral’ at its March meeting. Fiscal policy remains stimulative with further assistance provided in the March quarter, by means of income tax cuts and increased defence and terrorist-related spending. An additional US$50 billion stimulus package (equivalent to ½ a per cent of GDP) was also enacted in March, which included an extension of unemployment benefits by 13 weeks, the provision of tax incentives for business and further assistance to the recovery effort in New York City.
Growth in the Canadian economy has gained momentum, with industrial production in the three months to February rising by close to 1 per cent. The recovery in the US has helped, with Canadian motor vehicle manufacturers, in particular, benefiting from the strength in US motor vehicle sales. Low official interest rates have also contributed to strong growth in household spending. Citing stronger-than-expected economic growth in Canada and the US, the Bank of Canada raised official interest rates for the first time in this cycle – by 25 basis points to 2¼ per cent – in April. The Bank lowered official interest rates by 375 basis points in 2001.
Asia-Pacific
Japan
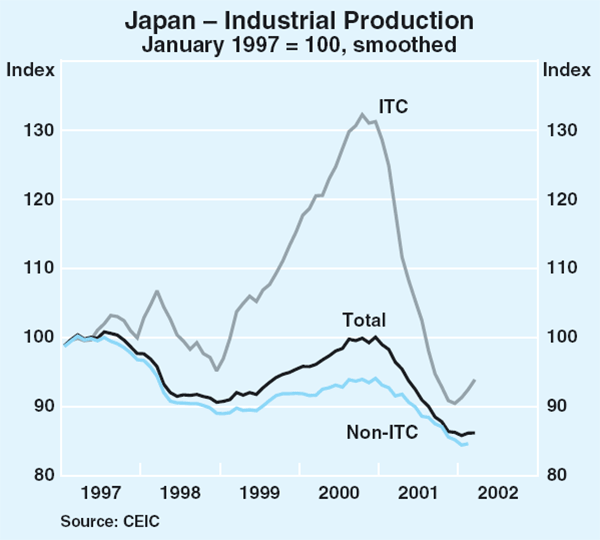
The Japanese economy contracted further towards the end of last year, with output in the December quarter almost 2 per cent lower than in the same period a year earlier. Nevertheless there are some tentative indications that conditions have stabilised in the new year. The Tankan survey suggests that business sentiment has steadied, with manufacturers' sentiment unchanged in the March quarter and the rate of decline in other sectors slowing. Foreign machinery orders have picked up over the past couple of months, albeit from very low levels, and some indicators of activity in the ITC sector have improved, reflecting the pick-up in global demand (Graph 5). The depreciation of the Japanese yen late last year should also provide some support for the export-oriented sectors. This demand, to date, has been met by a rundown in inventories. Business investment is expected to remain weak for quite some time, consistent with low rates of capacity utilisation.
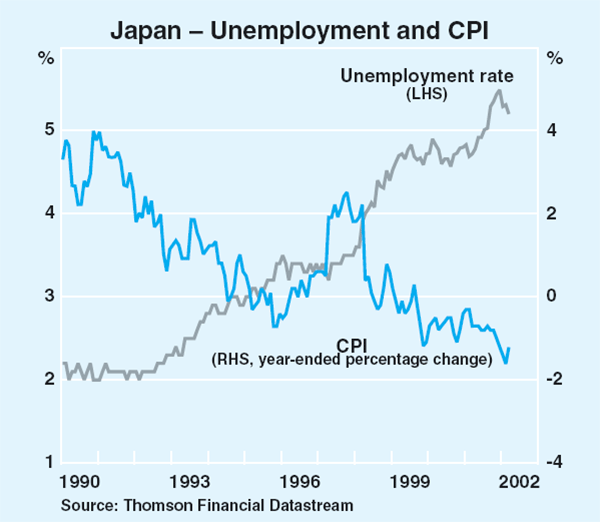
In line with developments in the business sector over the past year, the labour market continued to deteriorate. Employment fell by around 1½ per cent in the year to the March quarter, its sharpest fall in year-ended terms in 25 years. The unemployment rate was 5.2 per cent in March, only slightly below the peak of 5.5 per cent reached in December (Graph 6). With wages also falling, household incomes have contracted. Consumer prices continue to fall, with CPI deflation 1.2 per cent over the year to March.
Non-Japan Asia
Economic prospects for the rest of Asia have improved, consistent with firming global demand for ITC products, the turnaround in the US and stimulative macroeconomic policies. A return to growth in exports across much of Asia boosted GDP for the region as a whole in the December quarter with the rise in export volumes particularly pronounced in Korea, Taiwan and Thailand. Strength in domestic demand accounted for much of the growth in China, India, Indonesia and the Philippines. The strength in domestic demand mainly reflected increases in consumption; private investment continued to decline across the region reflecting the build-up of spare capacity over the past year or so.
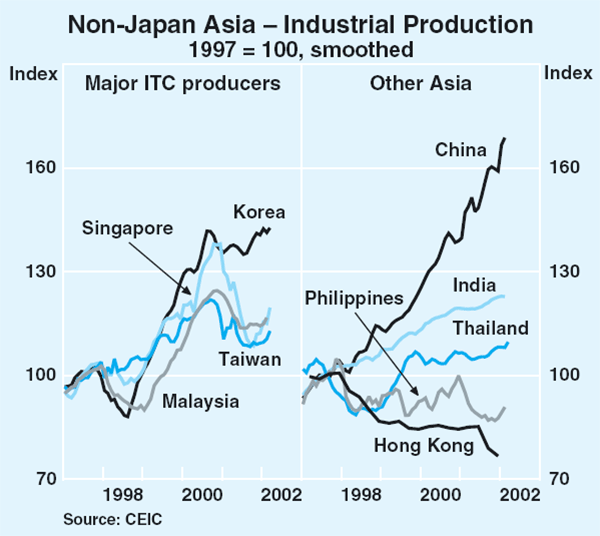
The pick-up in manufacturing output, which was evident towards the end of last year, has continued into 2002. Industrial production in aggregate rose by around 3 per cent in the three months to February, though for Taiwan, Malaysia, Singapore and the Philippines it remains well below the peaks recorded in the second half of 2000 (Graph 7). Much of the recent pick-up was driven by the recovery in the ITC sector, with ITC production in the four major ITC-producing countries back around early 2001 levels. Korea has fared much better than the other ITC producers partly because its exports as a share of GDP, and ITC exports as a share of total exports, are smaller than for the other major ITC producing countries.
The divergences in industrial production are also evident in labour markets across the region. Unemployment rates have continued to increase in Hong Kong, Singapore and Taiwan this year to be somewhat higher than those reached during the Asian financial crisis. In contrast, the unemployment rate in Korea reached its lowest level in four years earlier this year (Table 3).
| Inflation rate | Unemployment rate | |||
|---|---|---|---|---|
| Year to latest | Latest | Movement over past year | ||
| Korea | 2.5 | 2.9 | −1.3 | |
| Malaysia | 2.1 | 3.7 | 0.7 | |
| Philippines | 3.6 | 10.6 | −0.3 | |
| Taiwan | 0.2 | 5.3 | 1.3 | |
| Singapore | −0.9 | 4.5 | 2.1 | |
| Hong Kong | −2.1 | 7.0 | 2.5 | |
| China | −0.8 | .. | .. | |
| Thailand | 0.4 | .. | .. | |
| Indonesia | 13.3 | .. | .. | |
Consumer price inflation in most countries across the region has risen slightly in the early part of this year, after declining for much of 2001. The latest increase is due partly to the rise in oil prices and to seasonal volatility associated with demand around the Chinese New Year. Hong Kong and China, with exchange rates pegged to the US dollar, have experienced significant price falls over the past year, though Singapore has also recorded a price fall.
New Zealand
Domestic demand in New Zealand has been growing strongly in recent quarters, and both consumer and business confidence have returned to pre-September levels. CPI inflation was 2.6 per cent over the year to the March quarter, with increased housing costs and food prices accounting for most of the rise in the index. With inflation now towards the top end of the Reserve Bank of New Zealand's target range the RBNZ has increased the official cash rate in two steps by a total of 50 basis points to 5¼ per cent.
Europe
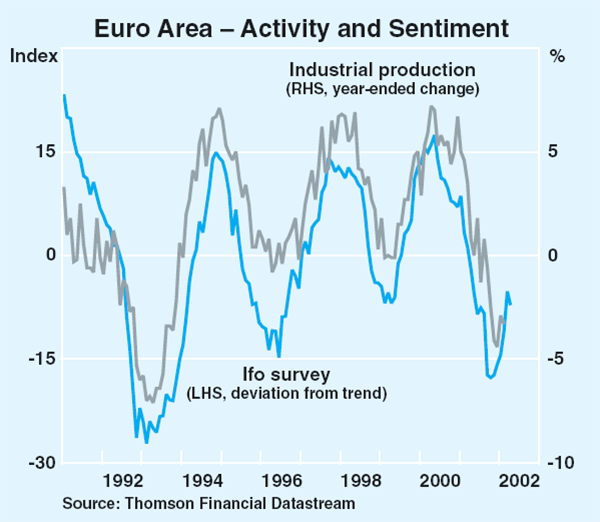
There is some evidence that business conditions have improved in the euro area after output in the December quarter declined for the first time since March 1993. In Germany, where the slowdown was most pronounced, business sentiment has recovered in the early months of 2002, with the Ifo survey measure of business confidence now rising back towards its long-run average (Graph 8). This should eventually translate into increased capital spending, as investment as a share of GDP in Germany is currently at its lowest level since re-unification. Industrial production has also risen in the other major countries, most notably in France and Spain.
Consumption in the euro area weakened over the course of 2001, though not by as much as recorded during previous slowdowns. Employment growth has slowed in the major euro area economies over the past year and a half, with particular weakness evident in Germany. However, with some of the smaller economies still creating jobs, and participation rates falling, the unemployment rate for the euro area in aggregate has remained near 10-year lows for much of the period. Consumer sentiment has also improved.
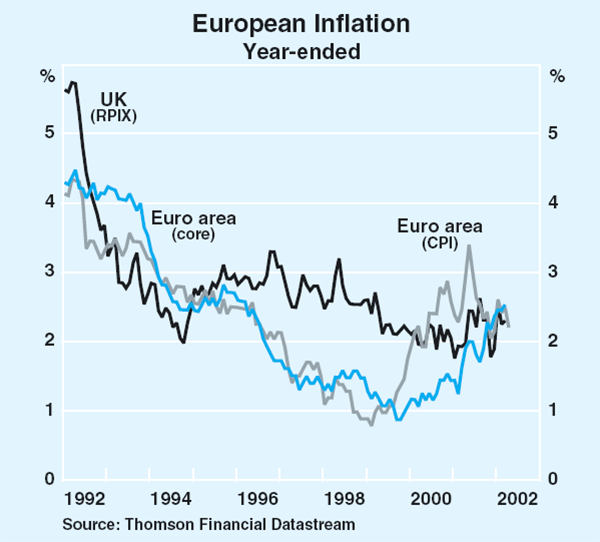
Euro area inflation has edged higher over the past few years with both the CPI and core measures of inflation currently around 2¼ – 2½ per cent (Graph 9). The volatility in euro area CPI inflation over the past year or so mainly reflects the impact of large movements in food and energy prices.
Output in the UK was little changed over the December and March quarters. Manufacturing production appears to have stabilised in recent months, though it remains nearly 6 per cent lower than a year ago. The services sector remains supportive of growth, in line with continuing increases in household spending. The latter has been boosted by low interest rates and rising house prices, as well as an historically low unemployment rate. Year-ended inflation (excluding mortgage payments) has been steady at around 2¼ per cent over the past couple of months, with increased fuel prices offsetting the impact of lower food prices.
Oil price developments
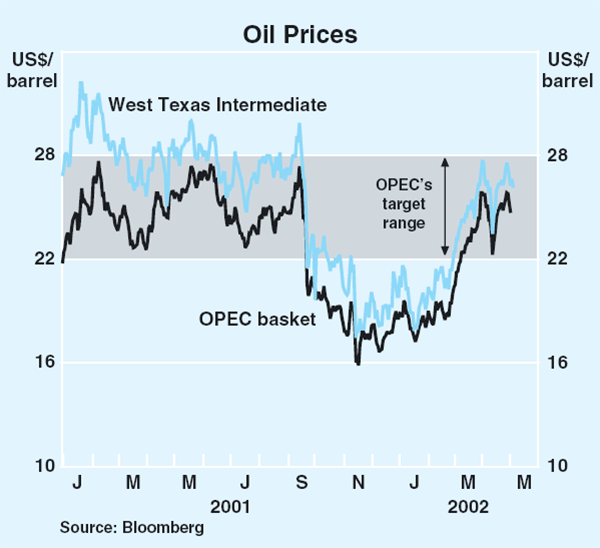
Oil prices have risen sharply over the past few months, returning them to the middle of OPEC's target band (Graph 10). The price of West Texas Intermediate crude oil averaged US$26 per barrel during April, which is 50 per cent higher than the low point reached in November 2001, but around the levels prevailing during most of 2001. The rise was prompted by reports of improved prospects for world growth, particularly following the release of fourth-quarter GDP figures for the US. OPEC's announcement in March that it would maintain supply cuts until mid 2002, combined with limited production cuts from Russia, lent further support to prices, as did heightened tensions in the Middle East, including the threat of US military action against Iraq. The increase in oil prices has begun to show up in inflation in the major industrial countries, removing some of the disinflationary impulse from declining oil prices in the latter months of 2001.
International and Foreign Exchange Markets
Short-term interest rates
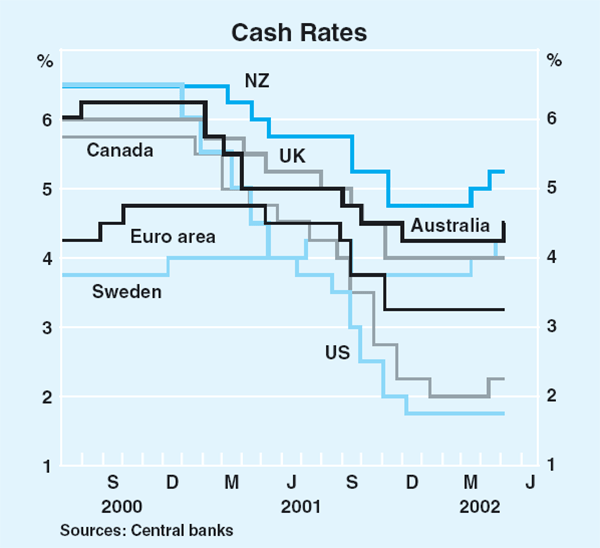
The cycle of global monetary easing that began in early 2001 had largely ended by the end of that year, as global economic prospects had begun to improve. The focus of financial markets has since switched to the issue of how quickly central banks would ‘normalise’ rates. The first moves were in March, when the Reserve Bank of New Zealand and Sweden's Riksbank each increased policy rates by 25 basis points. Both these central banks tightened further in April, and were joined by the Bank of Canada, which also increased its policy rate by 25 basis points (Table 4, Graph 11). As interest rates in most economies are near historical lows, market expectations are that there will be a series of increases over the coming year.
| Current level Per cent |
Cumulative reductions in down cycle |
Increases in policy rates | |||
|---|---|---|---|---|---|
| March | April | May | |||
| US | 1.75 | −475 | |||
| Canada | 2.25 | −375 | 25 | ||
| UK | 4.00 | −200 | |||
| Australia | 4.50 | −200 | 25 | ||
| NZ | 5.25 | −175 | 25 | 25 | |
| Euro area | 3.25 | −150 | |||
| Sweden | 4.25 | −50 | 25 | 25 | |
| Japan | 0.00 | −25 | |||
|
Sources: Central banks |
|||||
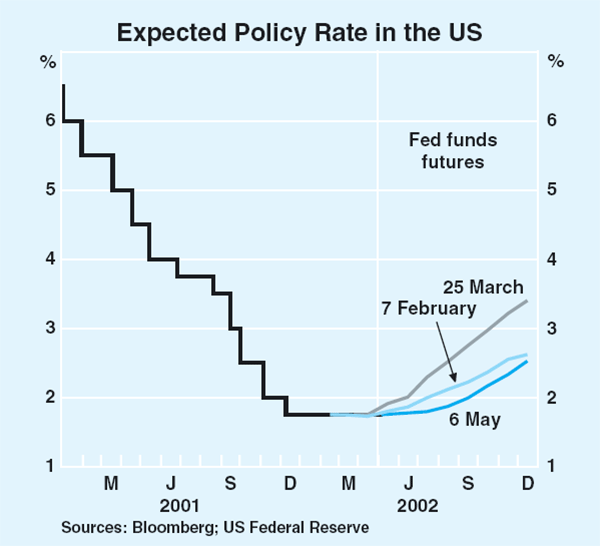
At its March meeting, the US Federal Reserve removed the easing bias that had been in place for the previous 15 months. Financial markets initially interpreted this (and a series of stronger-than-expected data releases) as an indication that the Federal Reserve was preparing the ground for an increase in official rates at its 7 May meeting. However, since then, softer data and comments from Federal Reserve officials have seen expectations of monetary tightening in the US pushed back to the second half of the year.
The Fed funds futures market is now reflecting expectations of a cumulative increase of around 75 basis points by end 2002 (Graph 12). Given the low starting point for the Fed funds rate – a 40-year low of 1.75 per cent – the implied level at end 2002 would remain substantially below the average level over the past 10 years.
The European Central Bank and the Bank of England have also signalled that the balance of risks has moved over recent months away from future economic weakness, leading to expectations of increases in official interest rates this year.
Japan remains the exception among the major economies, with market analysts continuing to call for further monetary easing to tackle deflation. With official interest rates having fallen to zero some time ago, the focus of policy has been the level of bank reserves at the Bank of Japan. These have risen sharply over the past year. Policy was last changed in February when the central bank increased its monthly purchases of Japanese government bonds by ¥200 billion to ¥1 trillion, and said that it would supply ample liquidity above the reserves target of ¥10–15 trillion to ensure stability ahead of the end-March close of the financial year.
Short-term interest rates in most emerging markets have been relatively stable over the past three months, although Argentina has been a noticeable exception in the wake of its January devaluation. Short-term interest rates in that country have risen to 110 per cent in April, from around 30 per cent a year earlier.
Long-term interest rates
Long bond yields around the world have, on balance, increased over recent months. Yields on US government 10-year debt increased substantially in February and March on better-than-expected economic data, although part of this increase was reversed in April as economic data turned softer and expectations of increases in policy rates were scaled back (Graph 13). Recently, yields on 10-year bonds have been around 5.1 per cent, about the same as they were a year ago, but well up on their low of 4.2 per cent in November 2001.
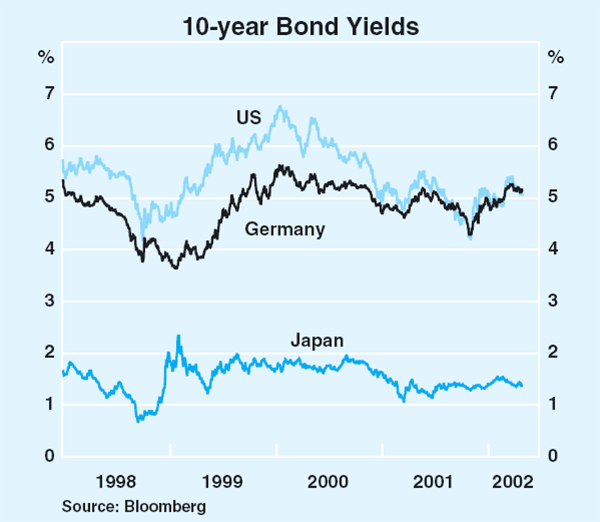
In European bond markets, yields have followed a similar pattern to that seen in the US; they increased substantially in February and March but have since fallen back somewhat.
As has often been the case over the past few years, movements in yields on Japanese government bonds have followed an independent course reflecting the specific circumstances of the Japanese economy. They rose in January and February in the lead-up to the end-March close of the Japanese financial year, on concerns that the year end might precipitate problems in the financial sector. They subsequently fell back, however, as it became clear that the new financial year would begin without event. More recently, yields have risen again, following Standard and Poor's April downgrading of Japan from AA to AA−, with a further downgrade expected from Moody's.
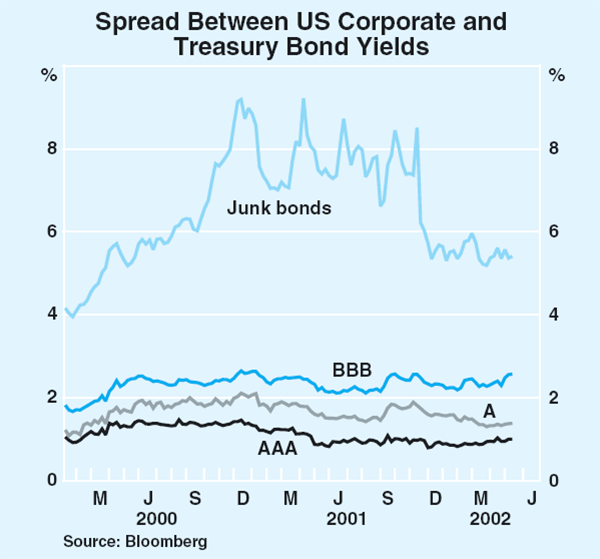
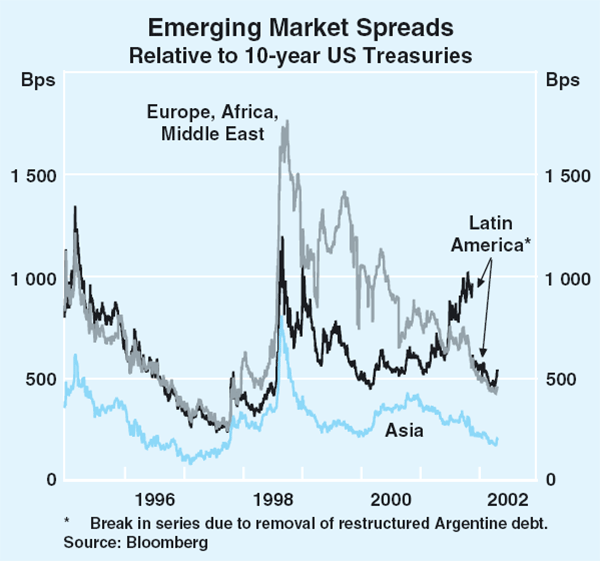
Risk aversion has generally moderated in global markets over recent months. This has been most evident in the ongoing decline in yield spreads (relative to US government bond yields) on emerging market debt and in low-rated corporate debt (Graphs 14 and 15). Despite the continuing crisis in Argentina, spreads on sovereign debt in all the major regions have continued to narrow (although Latin American spreads increased a little in April). Emerging market spreads are generally at their lowest levels in around four years.
Equity markets
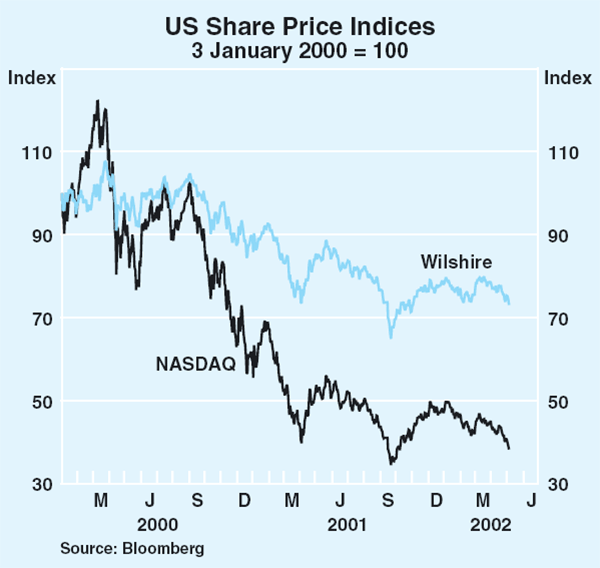
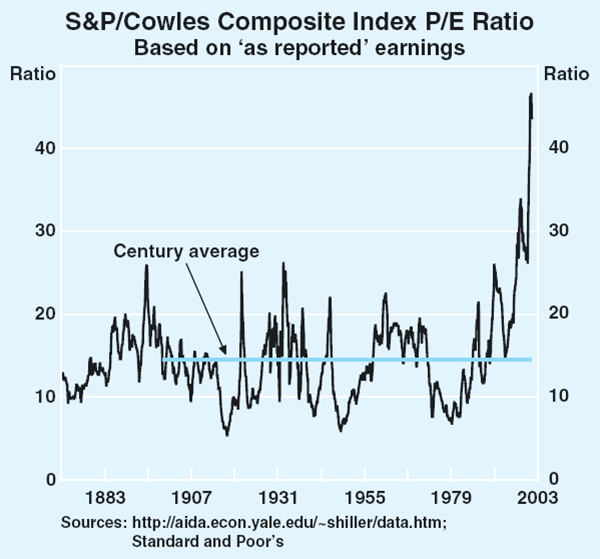
Equity markets in major countries have been fairly subdued over the past three or four months. In the US, the Wilshire Index (the broadest measure of US share prices, accounting for over 90 per cent of listed companies) is down by a net 6 per cent in 2002 while the NASDAQ is down by around 19 per cent (Graph 16, Table 5). Two factors seemed to be working to cause share prices to fall. The first was that earnings announcements by companies during the current quarterly reporting season have tended to disappoint market expectations, and in some cases were accompanied by warnings about the outlook. Earnings concerns were particularly noticeable in the tech sector. Second, there seemed to be a growing realisation that equity valuations are still very high by historical standards and, unless there is a strong recovery in profits soon, share prices would need to correct substantially to restore P/E ratios to anything approaching normal levels. The current P/E ratio for the S&P 500, at around 45, is unprecedented in over 130 years of history (Graph 17). The long-run average for this series is just under 15.
| Change since 2000 peak |
Change over 2001 |
Change in 2002 |
|
|---|---|---|---|
| United States | |||
| – Wilshire | −32 | −12 | −6 |
| – S&P 500 | −31 | −13 | −8 |
| – NASDAQ | −69 | −21 | −19 |
| Euro area | |||
| – STOXX | −36 | −20 | −6 |
| United Kingdom | |||
| – FTSE | −25 | −16 | −1 |
| Japan | |||
| – Topix | −38 | −20 | 5 |
| Canada | |||
| – TSE 300 | −33 | −14 | −1 |
|
Source: Bloomberg |
|||
Share prices in most other major countries have also been subdued over recent months. Both the Euro STOXX index (a broad index of over 300 major Euro area companies) and the FTSE 100 are down in the year to date. In contrast, the Japanese Topix index has strengthened substantially over the past three months, after touching 17-year lows in early February. While some of this strength was attributed to the introduction of restrictions on short sales and rumoured government activity, the market has also benefited from some more positive economic indicators, particularly industrial production and exports.
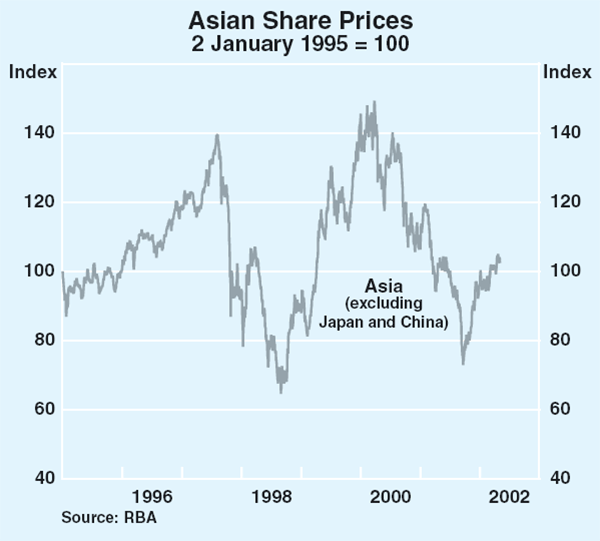
In contrast to the performance of most developed country equity markets, emerging market equities have shown some modest gains over the past three months, boosted by improving economic conditions in most countries and signs of a strengthening world economy. Asian share prices are up an average 6 per cent since early February (Graph 18), while Latin American share prices are up around 2 per cent on average.
Exchange rates
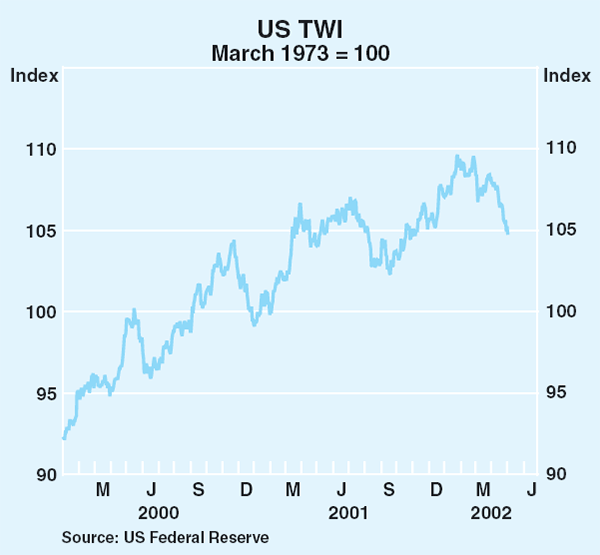
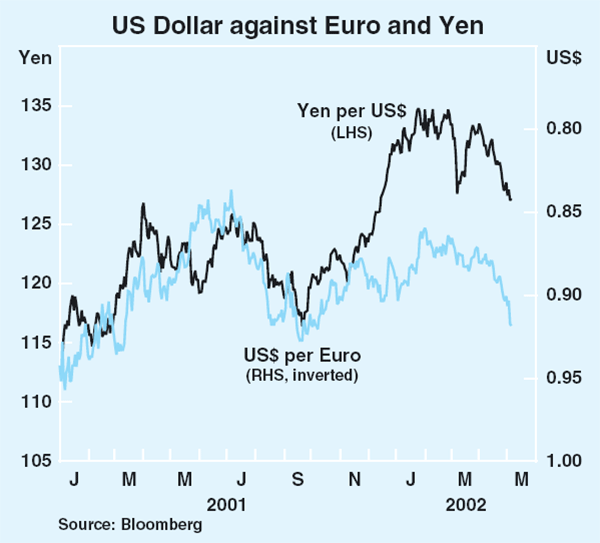
Signs that the US economy might be recovering more quickly than the rest of the world were reflected in US dollar strength early in 2002, but the currency has since weakened. The dollar fell by around 4½ per cent in trade-weighted terms in the three months to early May (Graph 19). Analysts have cited various factors as contributing to this recent fall, including weakness in the US share market, indications that US interest rates will be increased more gradually than earlier thought, and the renewed deterioration in the US trade position.
The recent weakness of the US dollar has been fairly broad-based, with all major currencies strengthening against it since early February. The yen and euro each appreciated around 6 per cent against the dollar in this period (Graph 20). Indeed, apart from dollar weakness, there have been only small changes in cross rates among the major foreign currencies.
Most emerging market currencies have been relatively stable over the past three months. The most notable exception remains the Argentinean peso, which has weakened 68 per cent against the US dollar since the currency board was abandoned in early January, falling from parity to around 3.1 pesos per dollar. This fall is of the same order as that experienced by Russia and Indonesia after their crises, and is significantly larger than those in other countries which experienced financial crises.
Australian dollar
The Australian dollar has gradually appreciated over the past three months, and traded near a 15-month high of around 54 US cents in early May (Graph 21). Although the 6 per cent appreciation seen this year against the US dollar in part reflected a generalised weakening of the latter currency, the Australian dollar also appreciated by a modest amount against other major currencies (around 2 per cent against the yen and the euro). The trade-weighted index (TWI) has risen by about 3 per cent over the past three months and is currently near its highest level since January 2001.
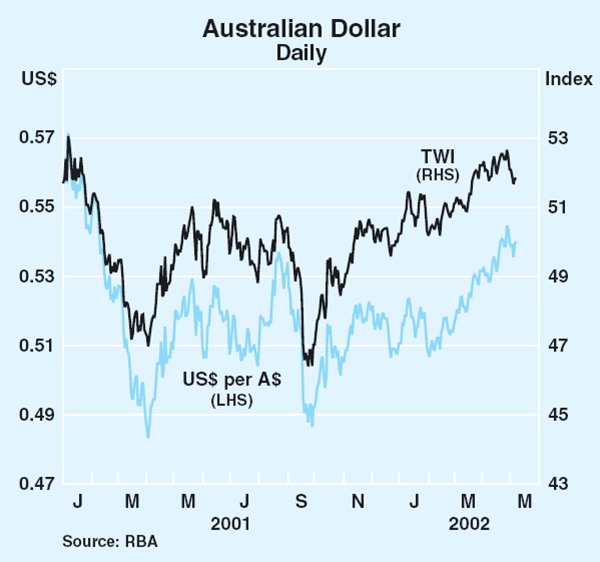
A range of factors has helped the exchange rate to strengthen in recent months. On the international front, there has been an improvement in the global outlook, which has resulted in stronger commodity prices. The RBA index of commodity prices is at its highest level in SDR terms since October 1997. The strength of the Australian economy more broadly has also supported the exchange rate, as it has caused interest differentials to move in the dollar's favour and has underpinned a relatively strong equity market. Portfolio equity flows into Australia exceeded outflows by Australian funds managers over 2001, and market participants report substantial net purchases of equities by foreign investors over the first four months of the year, which may also have lent support to the Australian dollar. (See Box B for a more general discussion of equity flows and the exchange rate.)
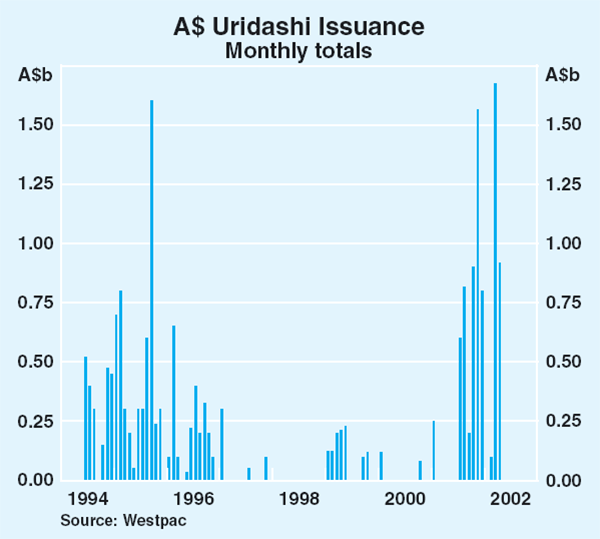
Demand by Japanese investors for A$ bonds remains strong. Issues of Australian dollar Eurobonds directly to Japanese retail investors (A$ Uridashi) were close to A$3 billion in the first four months of the year (Graph 22). This is the highest rate of issue since the mid 1990s when interest rates also favoured Australian investments.
With conditions in the foreign exchange market orderly and the exchange rate strengthening in recent months, the Bank's purchases of foreign exchange and earnings on reserves have exceeded its sales to the Commonwealth Government. As a result, the Bank's transactions in foreign exchange have added to net reserves. At the end of April, net reserves stood at $7.7 billion, compared with $6.8 billion in January. In addition to these outright transactions, the Bank has slightly reduced its foreign exchange swap transactions as it has been better able to handle domestic liquidity flows by domestic market operations. Swaps outstanding are currently $27 billion compared with $30 billion in January. Gross holdings of reserves have fallen correspondingly.
Box B: Some Facts on Australian Investment Abroad
Over the past five years, the value of funds invested offshore by Australian funds managers has increased from $53 billion to $127 billion.[1]
Some commentators have pointed to rising investments abroad as a factor contributing to the fall in the Australian dollar over this period. Others have gone further to argue that, because funds under management are increasing quickly and the proportion invested offshore is rising, this will be a negative long-term influence on the Australian dollar.
This Box puts recent flows by funds managers in perspective and concludes that there is no empirical support for these conjectures.
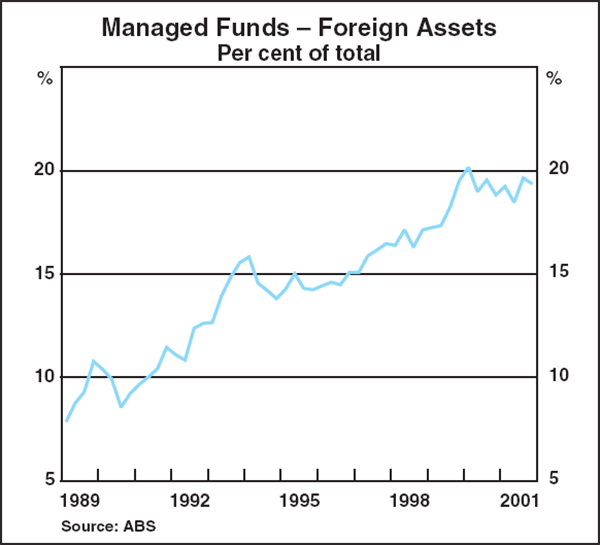
The proportion of funds invested abroad by funds managers has been rising throughout the period for which figures are available (since the late 1980s). The ratio was about 10 per cent in those earlier years, and has now risen to about 20 per cent (Graph B1). Throughout this period, the exchange rate has risen and fallen on several occasions, so any correlation with the exchange rate is, at best, a loose one.
The same process has been taking place in other countries, as part of the globalisation of financial markets. As such, the international flow of funds is not just one way; Australia is also the recipient of funds from foreign funds managers.
Foreign investment statistics published by the Australian Bureau of Statistics give some indication of the relative magnitude of these flows. Over the past decade, Australian portfolio equity flows abroad have averaged $3.5 billion a year, while foreign portfolio equity flows into Australia have averaged about twice that amount (Graph B2). That is, in net terms, more funds have been flowing into Australia than flowing out.
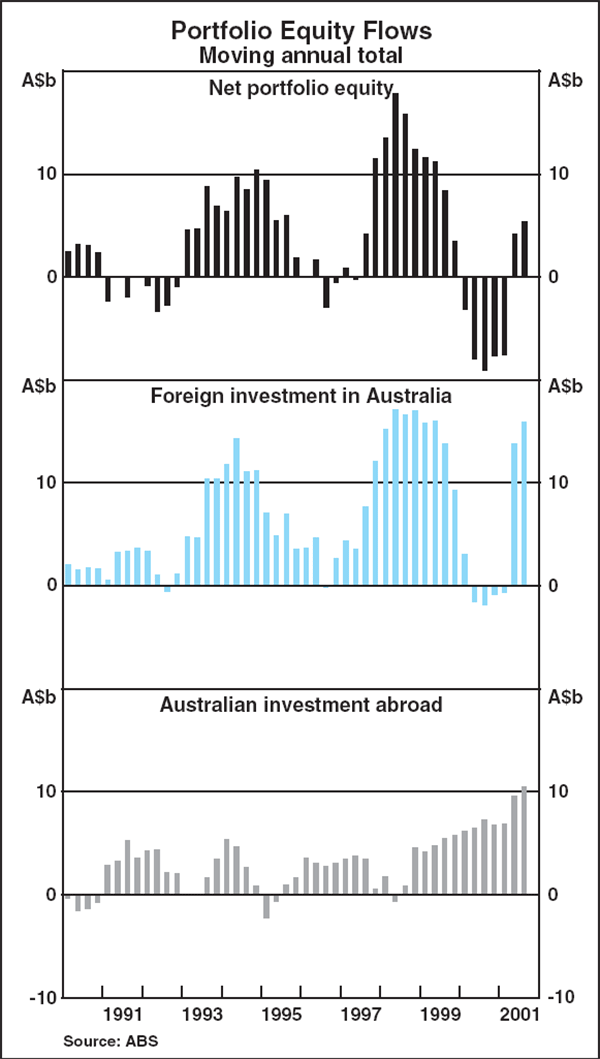
What is clear from the graph, however, is that foreign flows into Australia are quite variable. Inflows completely ceased during 2000, for example, a period when the Australian equity market became quite unfashionable among international investors who at that time were still focused on technology stocks.
While the exchange rate of the Australian dollar fell during 2000, suggesting that the cessation of foreign flows into Australia did influence the exchange rate, there does not appear to be any systematic relationship between these investment flows and the exchange rate. In 1997 and 1998, for example, when the currency was also falling, equity flows into Australia were rising strongly and Australian portfolio investment abroad fell. Both these were the reverse of the flows that might have been expected to result in exchange rate weakness.
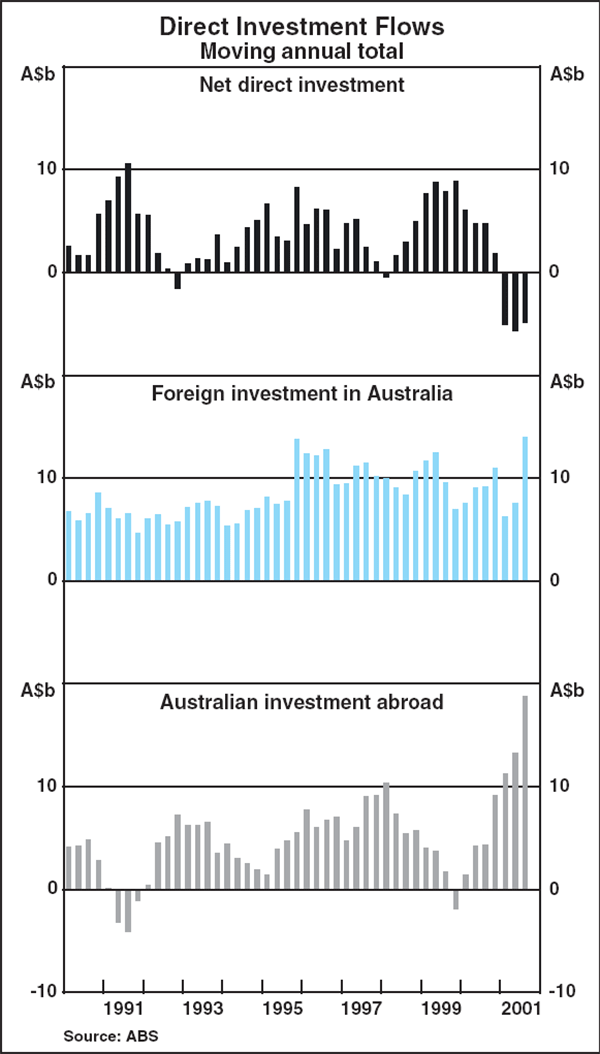
One of the reasons why there is no systematic relationship between these portfolio flows and the exchange rate is that they are only part of the overall capital flows into and out of Australia. Direct investment by companies, and overseas borrowing and lending, are also important. Over the past year, foreign direct investment abroad by Australian companies was about twice as large as investment abroad by funds managers (Graph B3). Reliable conclusions about the exchange rate therefore cannot be drawn simply on the basis of portfolio flows.
Some commentators have also pointed to the increased flow of funds abroad, both by funds managers and companies, as a sign of a lack of investment opportunities in Australia. But this ignores the flows from abroad coming into Australia, which on balance have greatly exceeded the outflows from Australia. The existence of a current account deficit provides the overriding evidence that Australia has an excess of investment opportunities over savings.
Rather than being a sign of some structural deficiency in the Australian economy, the flows of investment abroad should, more appropriately, be seen as part of the internationalisation of the economy. This process is taking place in most developed countries and brings many benefits to the economy. It does not imply depreciation of the domestic currency or a problem with domestic asset markets. In particular, at the same time as Australian money is looking abroad, fund managers in many other countries are also looking to invest internationally, and many of these are finding Australia an attractive place to invest.
Domestic Economic Activity
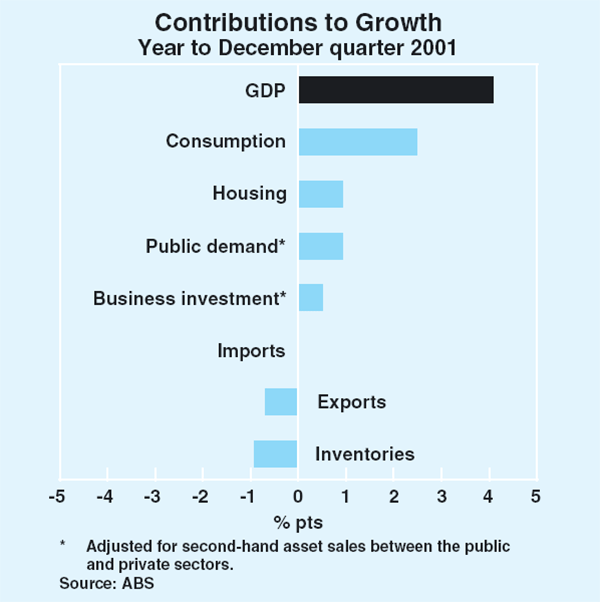
Against the background of a global slowdown, the Australian economy recorded good growth during 2001. GDP rose by 1.3 per cent in the December quarter to be 4.1 per cent higher than a year earlier (Table 6, Graph 23). Over the course of the year, the composition of growth shifted markedly from external demand to domestic demand. In the December quarter, domestic demand increased by 2.1 per cent, driven by the recovery in business investment, higher public demand and strong growth in consumption. This more than compensated for the decline in exports that resulted from the downturn in the global economy. Output growth has also become more broad-based among the states.
| Year-ended | |||
|---|---|---|---|
| December quarter 2001 |
June quarter 2001 |
December quarter 2001 |
|
| Private final demand(a) | 2.1 | −1.0 | 5.6 |
| Consumption | 1.3 | 2.8 | 4.2 |
| Dwelling investment | 4.1 | −29.7 | 21.5 |
| Business investment(a) | 5.7 | −4.8 | 4.5 |
| Public final demand(a) | 2.0 | 0.2 | 4.0 |
| Domestic final demand | 2.1 | −0.8 | 5.2 |
| Change in inventories(b) | 0.6 | 0.1 | −0.9 |
| Exports | −3.2 | 3.8 | −3.3 |
| Imports | 4.4 | −5.5 | 0.0 |
| Net exports(b) | −1.5 | 2.0 | −0.7 |
| Gross domestic product | 1.3 | 1.6 | 4.1 |
|
(a) Adjusted for second-hand asset sales between the public and private
sectors Source: ABS |
|||
The outlook for the Australian economy remains positive. The world economy is showing evidence of a modest recovery, which should help to support a pick-up in exports. A high level of consumer confidence and the improvement in the labour market should boost household incomes and underpin further strong growth in consumption through 2002. The main force expected to dampen growth in the second half of this year is a downturn in dwelling investment, as the strength in new building activity of recent quarters abates and moves more closely in line with underlying demand for housing. Against this, however, the sound position of corporate balance sheets, improved profitability and the low cost of business finance should sustain the incipient recovery in business investment over the next two years.
Household consumption
Household spending increased by just over 4 per cent over the course of 2001 and by 1.3 per cent in the December quarter. While part of the recent strength has been associated with the rebound in housing activity, most categories of expenditure have recorded solid growth. Recent indicators suggest ongoing strength in aggregate consumption in the first months of 2002. Real retail sales, which account for more than a third of household consumption, rose by 1.6 per cent in the March quarter, to be 5 per cent higher than a year earlier (Graph 24). Households' purchases of motor vehicles moved strongly higher in the early months of 2002, rising by 11 per cent in the March quarter following relatively flat sales in 2001.
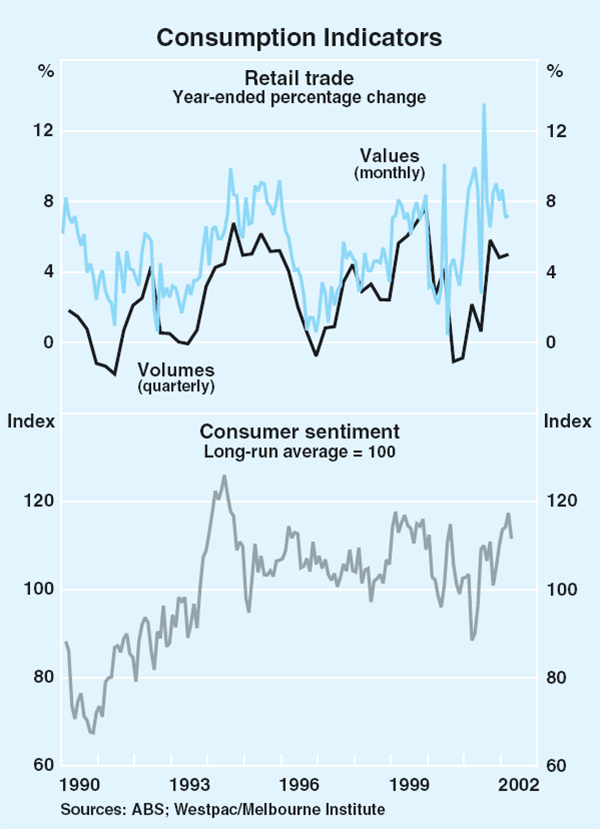
These generally favourable trends in consumption are consistent with the high level of consumer sentiment prevailing in recent months. According to the Westpac-Melbourne Institute survey, consumer sentiment has recovered strongly over the past six months to be well above its long-run average. Sentiment relating to personal finances over the past year, economic conditions over the coming year and attitudes towards buying a major household item have improved markedly in recent months.
While growth in household consumption has been strong, increases in real household disposable income – the main driver of consumption – have been relatively subdued, compared with recent years. Gross household income increased at an annual pace of 2.8 per cent in the second half of 2001. The deceleration in income growth mainly reflected subdued growth in employment and wages and a significant fall in dividend income, partly associated with the lowering of the corporate tax rate from 1 July, which encouraged payment of dividends in the first half of the year.
Three factors have enabled households to maintain solid consumption growth despite subdued nominal income growth. Firstly, household borrowing has been buoyant, with part of this borrowing being used directly for consumption. Second, higher asset values have added considerably to household wealth, and, when combined with an increase in the rate of housing equity withdrawal, have provided households with the scope to finance consumption. Finally, the decline in petrol prices in the second half of 2001 boosted real household incomes and thereby assisted households to spend.
More recently, and as detailed in the chapter on ‘International Economic Developments’, the stimulatory impulse from lower petrol prices has been reversed. Since January, crude oil prices have increased by 30 per cent. The significance of the impact of higher oil prices on consumption is difficult to quantify. One approach is to calculate the direct effect on household incomes. On this basis every 10 cent rise in the price of petrol at the pump reduces household purchasing power by around $300 per annum, equivalent to about ½ a per cent of average household disposable income. This figure, however, is likely to be an upper bound, since Australia is a net exporter of energy and consequently income for the economy as a whole (including, indirectly, some consumers) would be boosted as a result of higher oil prices.
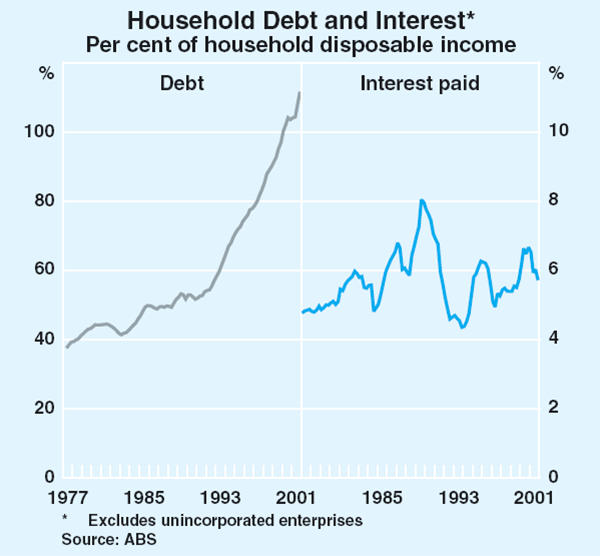
Household borrowing increased at an annualised rate of 15½ per cent over the six months to March, driven by borrowing for housing. The higher levels of household borrowing in recent years have led to a sharp rise in household debt since the mid 1990s. The interest burden, however, has remained around 6 per cent of household disposable income (Graph 25). On the other side of the household balance sheet, growth in asset values over 2001 was particularly strong, underpinned by gains in dwelling prices, while growth in equity prices remained solid, although well down on previous years (Table 7). The ratios of household assets and consumption to income are at very high levels by historical standards.
| Level $ billion | Annual growth per cent | ||
|---|---|---|---|
| December 2001 | 2001 | Average 1996–2000 | |
| Non-financial assets | 2,075 | 18.3 | 11.4 |
| – Dwellings | 1,896 | 18.7 | 12.2 |
| – Consumer durables | 179 | 14.3 | 4.6 |
| Financial assets | 1,268 | 7.0 | 12.5 |
| – Currency and deposits | 299 | 14.5 | 7.1 |
| – Equities and unit trusts | 247 | 9.0 | 23.1 |
| – Superannuation and life offices | 646 | 4.8 | 12.9 |
| – Other | 76 | −6.1 | 5.6 |
| Total | 3,343 | 13.7 | 11.8 |
|
Sources: ABS; RBA |
|||
Housing
The recovery in housing activity continued in the December quarter 2001, largely owing to low interest rates, strong demand among investors and government support for first-home buyers. Dwelling investment increased by 4.1 per cent in the December quarter, to be 21.5 per cent higher over the course of the year. Expenditure on alterations and additions fell slightly in the quarter, but remained 16 per cent higher over the year.
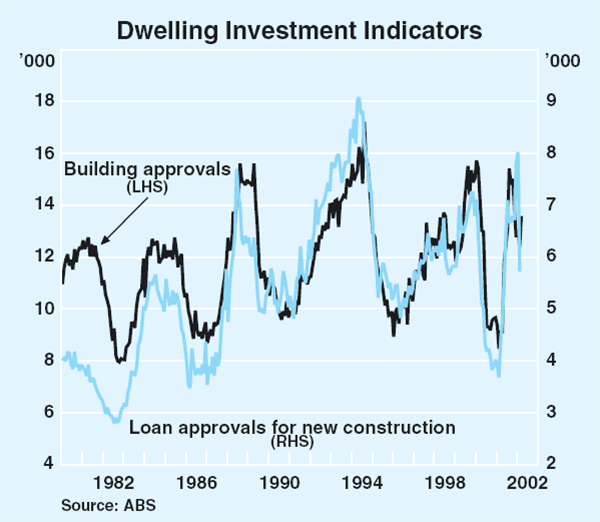
However, and as foreshadowed in the previous Statement, leading indicators of housing activity have now started to turn down and suggest that dwelling investment will peak around the middle of this year (Graph 26). Building approvals for houses have fallen by 13 per cent from the peak last August. These trends are mirrored in the value of loan approvals for new construction, which fell by around a quarter in February. The number of First Home Owner Grants paid also fell in March, largely reflecting the fall in Commonwealth Additional Grants for new dwellings that has occurred following the reduction in the additional grant from $7,000 to $3,000 on 1 January.
The expiration of the Commonwealth Additional Grant at the end of June will amplify the expected downturn in the housing cycle in the second half of 2002, since one consequence of the limited duration of the scheme has been to bring forward the decision of first-home buyers to purchase a new dwelling. The impact, however, is likely to be much more limited than that associated with the introduction of the GST, since the home ownership schemes only extend to first-home buyers. A potentially bigger downward force on future building activity is an oversupply of dwellings. The current extent of oversupply appears to be less than at the peak of previous housing cycles, but is evident in certain areas and especially for medium-density dwellings.
All published indices of house prices showed very strong increases in the December quarter, and the Commonwealth Bank/Housing Industry Association (CBA/HIA) measure recorded a further large increase in the March quarter. The ABS measure, which allows for the effect of compositional change in the sample of houses sold, rose by 3.8 per cent in the December quarter to be 15.5 per cent higher than a year earlier and follows strong house price growth over the past couple of years. The Real Estate Institute of Australia (REIA) and CBA/HIA measures of house prices also show large increases over the past year. The current cycle of house price rises has brought about a cumulative increase in prices in real terms similar to the experience of the late 1980s (see Box C). Moreover, unlike previous cycles in house prices, where there was considerable regional variation, all major capital cities have recorded strong house price increases.
The business sector
The improvement in output growth over the course of 2001 was concentrated in the goods production and distribution sectors, supported by the upswing in residential construction and strong retail trade activity, with flow-on effects to manufacturing and wholesale trade. The business services sector was dampened by a sharp slowdown in the communication industry, but overall has maintained a relatively solid pace of growth. Growth in household services increased, driven largely by health services and despite weakness in tourism, where fewer overseas arrivals since last August and a decline in domestic air travel led to a fall in output in hospitality services. Prohibitive public liability premiums or difficulty obtaining coverage have also affected the tourism and recreation industries, where the value of premiums paid is high relative to revenue.
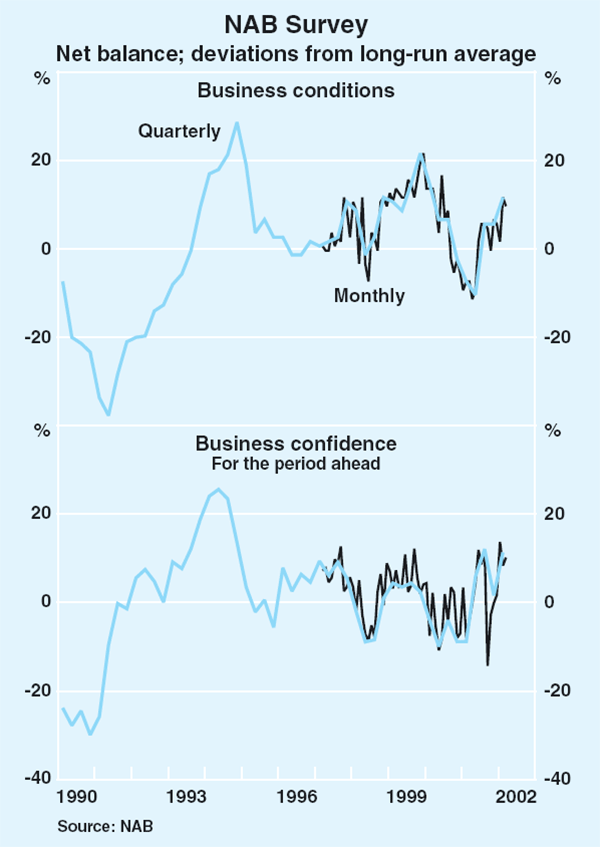
All major surveys of business conditions indicate that firms have shrugged off the pessimism linked to the global economic downturn during 2001, with current conditions consistent with robust growth in coming quarters. The NAB survey for the March quarter reported an improvement in trading conditions, profitability and employment and are at levels above their long-run average (Graph 27). Export sales, however, were reported to have deteriorated further in the quarter, suggesting that the slowdown in the global economy is still a drag on domestic growth. Business surveys covering the manufacturing sector, such as the ACCI-Westpac, AIG and the Dun & Bradstreet surveys, with the latter covering the wholesale and retail trade industries as well, also reported improved business conditions in the March quarter.
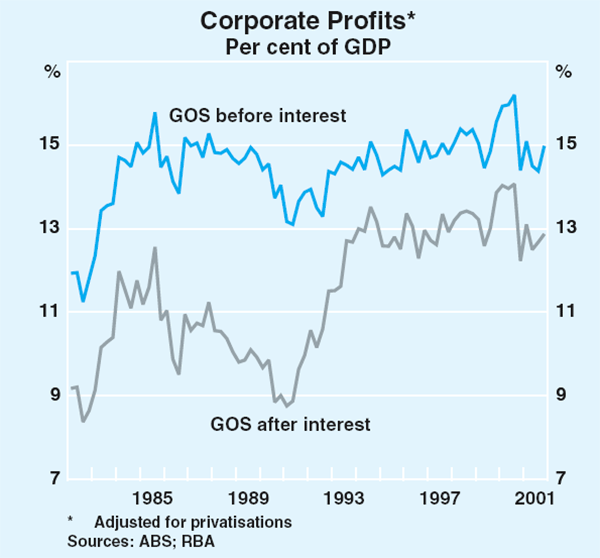
Corporate profits, as measured by gross operating surplus (GOS), increased by around 6 per cent in the December quarter, to be about 11 per cent higher than a year earlier. The quarterly rise was broadly based, reflecting continued strength in domestic demand, some evidence of moderation in margin pressures and a further rise in resource sector profitability. Small business profits were close to unchanged in the quarter, but were 10 per cent higher over the year, in line with buoyant conditions in the retail and housing sectors. As a share of GDP, corporate profits before interest increased to 15 per cent in the December quarter, which is slightly above the average level over the past decade (Graph 28).
The rise in corporate profits combined with relatively stable total disbursements – such as interest payments, taxation and dividend payments – resulted in total internal funding increasing strongly in the second half of 2001, which has been reflected in higher business deposits with intermediaries, and a reduced demand for business credit. With a pick-up in investment expenditure and intentions, there are now some signs of increased business borrowing activity. Business credit grew by 1.3 per cent on an annualised basis in the six months to March, after declining by a comparable amount in the previous six months, and net business loan approvals have risen sharply in recent months. The comparatively healthy performance of the Australian equity market continues to provide listed companies with an additional source of funding, and equity raisings remained at a firm pace in the March quarter. As a result of these trends in debt and equity issuance, the aggregate debt-to-equity ratio for the private non-financial corporate sector dropped considerably in the December quarter, and the interest burden remained low by historical standards.
The improvement in sentiment, higher corporate profits and the generally favourable balance sheet position of corporations appear to be providing the foundation for a recovery in business investment. Capital outlays increased by nearly 6 per cent in the December quarter, to be 4.5 per cent higher over the year. As a result, business investment as a share of GDP rose in the December quarter, although it remains at a low level (Graph 29). Most of the rise was in machinery and equipment expenditure, consistent with strong growth in underlying capital imports in the second half of 2001. Expenditure on intangible fixed assets also rose strongly in the December quarter, underpinned by higher mineral and petroleum exploration and investment in computer software, though growth remains well below the average during the 1990s. In contrast, expenditure on buildings and structures declined in the December quarter, mainly reflecting a fall in engineering construction.
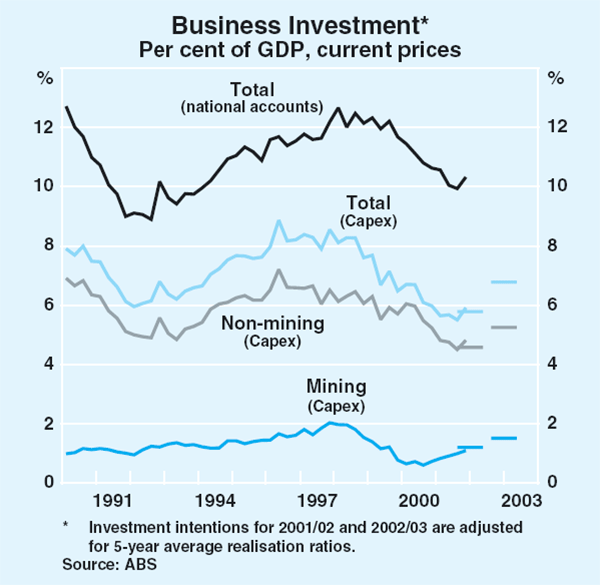
Looking forward, most business surveys and the ABS capital expenditure survey suggest a strong recovery in business investment next financial year. The first estimate of capital expenditure for 2002/03 implies that investment in machinery and equipment could grow by around 14 per cent in nominal terms, based on a five-year average realisation ratio, underpinned by mining and transport equipment investment. The communications industry, however, is likely to experience a reduction in capital expenditure in 2002/03, as subdued activity in this sector leads firms to scale back investment plans considerably.
The capital expenditure survey suggests an even more marked turnaround in investment expenditure on buildings and structures in 2002/03, following very steep falls at the end of 2000 and the beginning of 2001. Approvals and work yet to be done have continued their upward trend since late last year, with commencements returning to relatively high levels in the second half of 2001. Much of the growth in 2002/03 is expected to come from the finance and property and business services sectors, underpinned by an increase in office construction. Engineering construction by the private sector is expected to pick up strongly, particularly in the mining sector, following a number of major projects commencing in recent quarters, such as the fourth-train expansion of the North-West Shelf LNG plant, several coal-related projects and an alumina refinery. The recent commencement of a number of large public infrastructure projects will also be a significant addition to total investment spending in coming years. The favourable outlook for investment is supported by the Access Economics Investment Monitor, which has reported a sharp rise in the value of projects recently commenced and in the pipeline.
The labour market
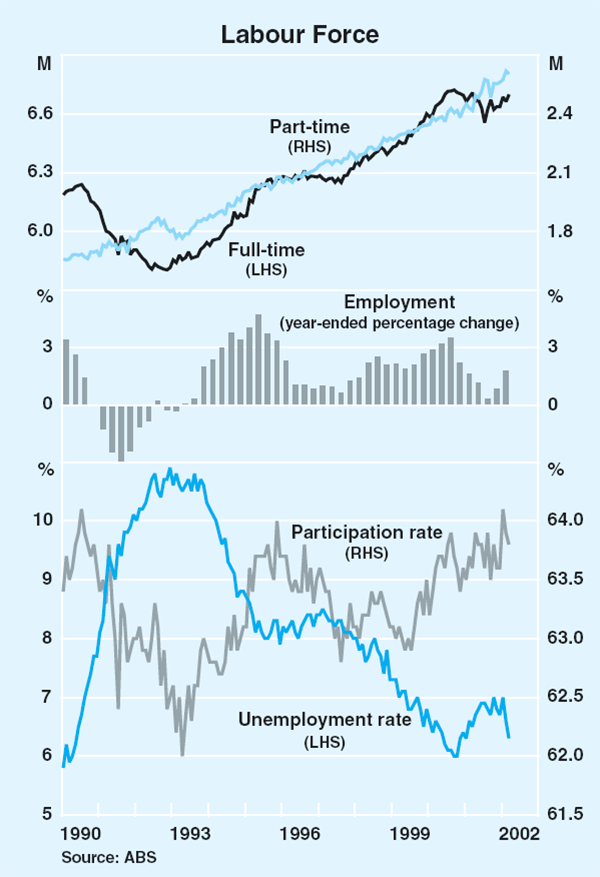
The labour market was slow to reflect the recovery in output growth during the second half of 2001. While output rose by 4.1 per cent through the year, employment increased by less than 1 per cent and the unemployment rate edged higher. Since the beginning of 2002, however, labour force data and indicators of labour demand have shown a major upturn. The recovery partly reflects delayed hiring activity from last year, but also the ongoing strength in domestic demand so far this year. In the March quarter, employment grew by 1 per cent, to be 1.8 per cent higher over the year, and by the month of March the unemployment rate had declined by ¾ of a percentage point from its recent peak of 7 per cent (Graph 30). Moreover, for the first time since mid 2000, full-time employment made a significant contribution to total employment growth, increasing by 0.8 per cent in the March quarter, to be around the level of a year ago. The strength in part-time employment growth evident throughout 2001 continued in 2002. The improvement in the labour market is evident in all the mainland states, especially Queensland (Table 8).
| Employment growth | Unemployment rate | ||||
|---|---|---|---|---|---|
| March quarter |
Year to March quarter |
March quarter |
Year-ended change(a) |
||
| NSW | 1.4 | 1.8 | 6.1 | 0.4 | |
| Victoria | 1.0 | 1.3 | 6.3 | 0.2 | |
| Queensland | 1.2 | 2.9 | 7.9 | −0.3 | |
| WA | 0.6 | 1.0 | 6.3 | −0.2 | |
| SA | 0.9 | 2.0 | 7.0 | −0.1 | |
| Tasmania | −0.8 | −1.4 | 8.6 | 0.0 | |
| Australia | 1.0 | 1.8 | 6.6 | 0.1 | |
|
(a) Percentage points Source: ABS |
|||||
Other indicators of labour market utilisation have also improved. This is evident in a pick-up in average hours worked per week, albeit from historically low levels. Wider definitions of unemployment, which include part-timers wanting to work longer hours and persons not in the labour force but willing and available for work, also fell in the March quarter.
Employment in the business services sector increased in the March quarter, although it remains well down on the levels of a year ago, particularly in those industries most exposed to the downturn in the ITC sector (Table 9). Construction employment also rose in the March quarter, as the housing recovery continued. Employment increases are also evident in industries that had been most exposed to the slowdown in tourism, especially accommodation, cafes and restaurants. Employment in the transport and storage sector, however, fell by 6.7 per cent in the March quarter, and manufacturing sector employment was flat in the quarter and has fallen by 3.2 per cent over the year, compared with the longer-term decline in this sector of around ½ per cent per annum over the past two decades.
| Growth | |||
|---|---|---|---|
| Share of total 2001 |
March quarter 2002 |
Year to March quarter 2002 |
|
| Goods production | 21 | 1.5 | 1.4 |
| Manufacturing | 12 | 0.0 | −3.2 |
| Construction | 7 | 3.2 | 8.1 |
| Goods distribution | 24 | −1.1 | 2.5 |
| Retail and wholesale | 20 | 0.2 | 4.3 |
| Transport and storage | 5 | −6.7 | −5.1 |
| Business services | 17 | 4.6 | −2.9 |
| Property and business services | 12 | 5.1 | −4.8 |
| Finance and insurance services | 4 | 0.1 | 4.4 |
| Communication services | 2 | 11.7 | −4.4 |
| Household services | 28 | 1.3 | 3.1 |
| Accommodation, cafes and restaurants | 5 | 4.7 | 0.0 |
| Education | 7 | 0.7 | 4.3 |
| Health and community services | 10 | 0.9 | 3.2 |
| Cultural and recreational services | 2 | 5.6 | 6.7 |
|
(a) For details of sector classifications refer to ‘Box A: The Service Sectors’ in the November 2001 Statement on Monetary Policy. Excludes agriculture and public administration. Source: ABS |
|||
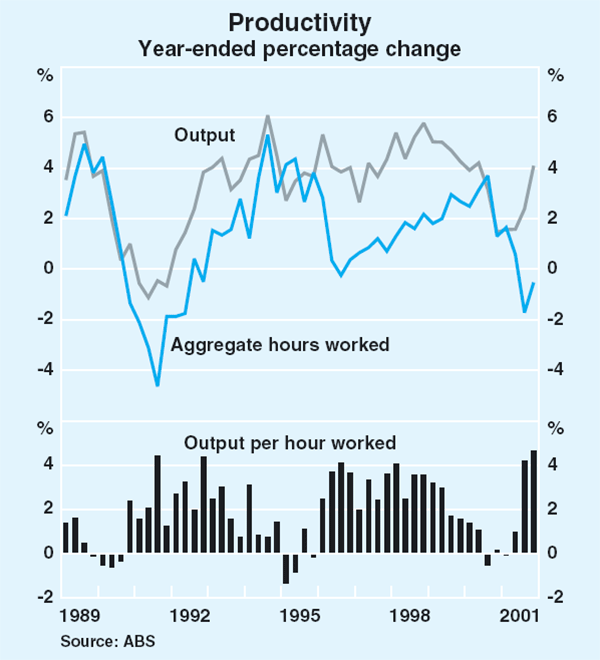
The pick-up in output growth over 2001, coupled with relatively weak employment growth, resulted in an increase in labour productivity, measured as output per person employed, of 1 per cent in the December quarter, to be 3.2 per cent higher than a year earlier. On an hours-worked basis, the rise in productivity is even more pronounced since average hours worked fell in the December quarter (Graph 31). This pick-up in productivity growth continues to reverse the cyclical decline seen in 2000. Looking through these temporary swings there is no sign that the trend in productivity growth since the mid 1990s has changed.
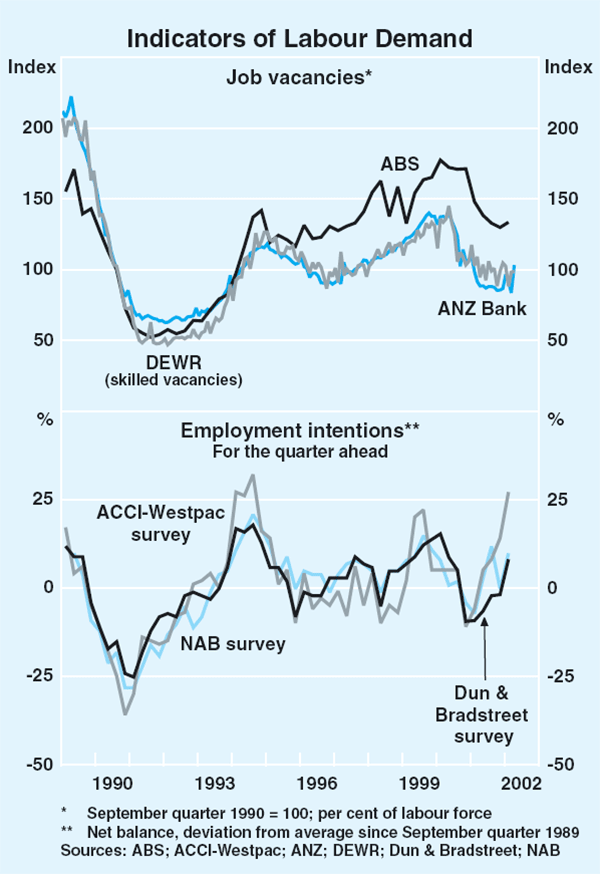
Forward-looking indicators of labour demand have improved over the past couple of months (Graph 32). Measures of hiring intentions from the NAB, ACCI-Westpac, Dun & Bradstreet and the AIG surveys have become increasingly positive and are at high levels. Looking through volatility in the series owing to the early timing of Easter, the ANZ newspaper-based measure has picked up significantly since the beginning of the year. The Department of Employment and Workplace Relations (DEWR) skilled vacancies series has remained roughly flat over the past year. The ABS employer-based measure of vacancies rose by 3.6 per cent in the March quarter, having fallen throughout 2001.
Box C: House Prices
House prices in Australia have been rising strongly for some time, with increases of the order of 15 to 20 per cent being recorded over the latest year in several of the major cities. While increases of that magnitude are not exceptional in a single year, a feature of the current expansion is that strong rates of increase have been sustained for several years, so that the cumulative increase in house prices has been substantial (Graph C1).
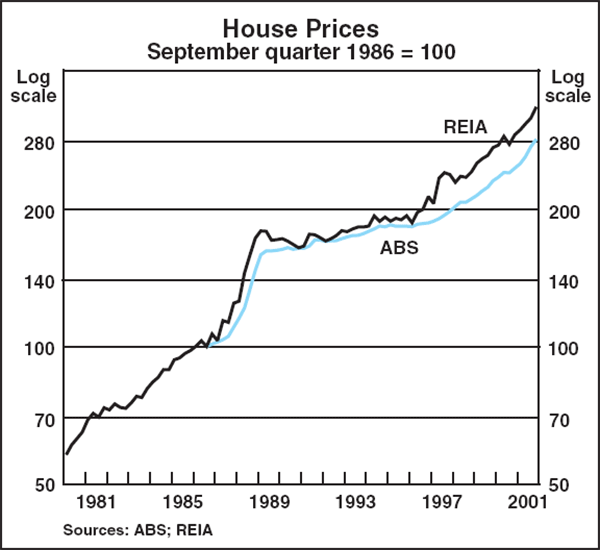
To put these increases in perspective, it is useful to compare the experience of recent years with the previous period of rapidly rising house prices, which occurred in the late 1980s. One important difference between the two periods is that most of the increase in house prices in the late 1980s was concentrated in a two-year period ending in the first half of 1989, a period of extremely rapid house price inflation. By contrast, the recent experience has been characterised by less extreme increases in any given year, but with strong rates of increase being sustained over a longer period. The cumulative movements in the two episodes are summarised in Table C1.
| Nominal | Real(a) | ||||
|---|---|---|---|---|---|
| Five years to: | Five years to: | ||||
| Mar 1989 | Dec 2001 | Mar 1989 | Dec 2001 | ||
| Sydney | 140.4 | 47.7 | 68.0 | 33.2 | |
| Melbourne | 122.2 | 93.1 | 55.3 | 74.1 | |
| Brisbane | 47.9 | 46.3 | 3.4 | 32.0 | |
| Adelaide | 43.9 | 37.4 | 0.6 | 23.9 | |
| Canberra | 42.8 | 42.5 | −0.2 | 28.5 | |
| Perth | 142.0 | 34.6 | 69.1 | 21.4 | |
| Darwin | na | 16.2 | na | 4.8 | |
| Hobart | na | 13.5 | na | 2.4 | |
| Australia(b) | 113.9 | 56.8 | 49.5 | 41.4 | |
|
(a) Deflated by the CPI excluding interest charges, adjusted for tax changes
and the introduction of Medicare Sources: ABS; RBA; REIA |
|||||
The aggregate nominal increase in house prices in the late 1980s period, at 114 per cent, was much larger than in the most recent five years, but this difference is largely accounted for by the fact that the general rate of inflation was higher. In real terms, the cumulative increases are of similar magnitude, at 49 per cent in the late 1980s compared with 41 per cent in the recent period. However, in the current period, house prices are still rising; the CBA/HIA measure recorded a further large rise in the March quarter 2002. Another noteworthy feature of these comparisons is the geographic spread of house price increases. The rise in prices in the late 1980s was heavily concentrated in Perth and Sydney (and to a lesser extent, in Melbourne), whereas this time house price rises have been experienced in most of the major cities, with particularly large increases in Melbourne.
An alternative benchmark for assessing house prices over time is to express them as a ratio to average earnings (Graph C2). This ratio rose rapidly in the late 1980s to peak at around 6½ in 1989 (that is, the average house price was 6½ times annual average earnings). It then fell for two years, and remained steady for a period in the early to mid 1990s. The ratio has been on a rising trend since 1996 so that currently, at just under 8 times earnings, it is well above its previous peak.
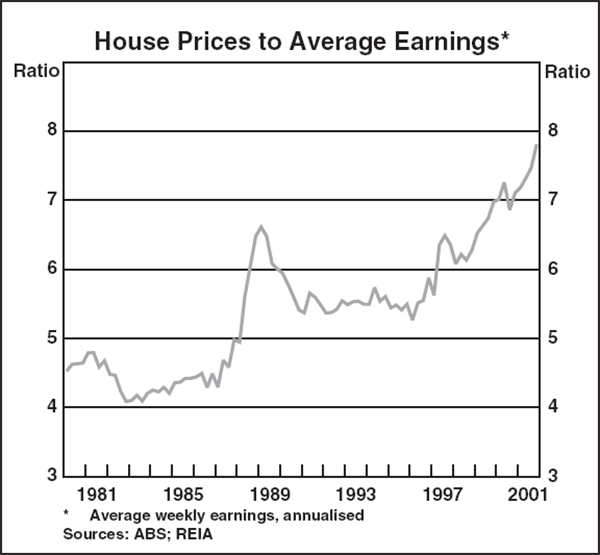
A rising trend in the ratio of house prices to incomes may in part be a natural consequence of improving living standards. As incomes increase, households can afford to devote an increasing share of their income to housing. The growth in the number of two-income households will have contributed to this trend. In addition, it appears that the rise in house prices in recent years partly reflects the adjustment to the low-inflation environment. The low nominal borrowing rates that have resulted from lower inflation (as well as increased competition in the home-lending market) have increased the scope of households to borrow by reducing the front-end hurdle of the standard home loan. This has been reflected in the rapid growth of household borrowing over the past five years.
But whenever an adjustment of this type occurs, there is the risk that prices may overshoot, as some purchasers extrapolate past movements as a guide to future capital gains. This may be occurring at present, since the low rental yield on property, and high rental vacancy rates, seem inconsistent with rapidly rising house prices. Moreover, further downward pressure on rental yields may be in prospect as additional dwellings under construction are completed, especially in the medium-density sector. Some of these properties will be made available for lease at a time when vacancy rates have risen in all capital cities to high levels. The rise in vacancy rates has been most pronounced in Sydney and Melbourne where they are now among the highest in the country, especially compared with their long-term average levels (Table C2).
| Latest(a) | Average since 1980 | High | Low | |
|---|---|---|---|---|
| Sydney | 3.8 | 2.3 | 4.1 | 0.8 |
| Melbourne | 4.8 | 2.7 | 5.2 | 1.0 |
| Brisbane | 2.2 | 3.9 | 7.7 | 0.5 |
| Adelaide | 2.1 | 3.0 | 5.7 | 0.9 |
| Perth | 4.6 | 3.6 | 8.6 | 0.8 |
| Canberra | 1.9 | 2.7 | 6.1 | 0.3 |
| Australia(b) | 3.4 | 2.8 | 4.5 | 1.4 |
|
(a) December quarter 2001, except for Brisbane, where March quarter 2001
applies. Source: REIA |
||||
Balance of Payments
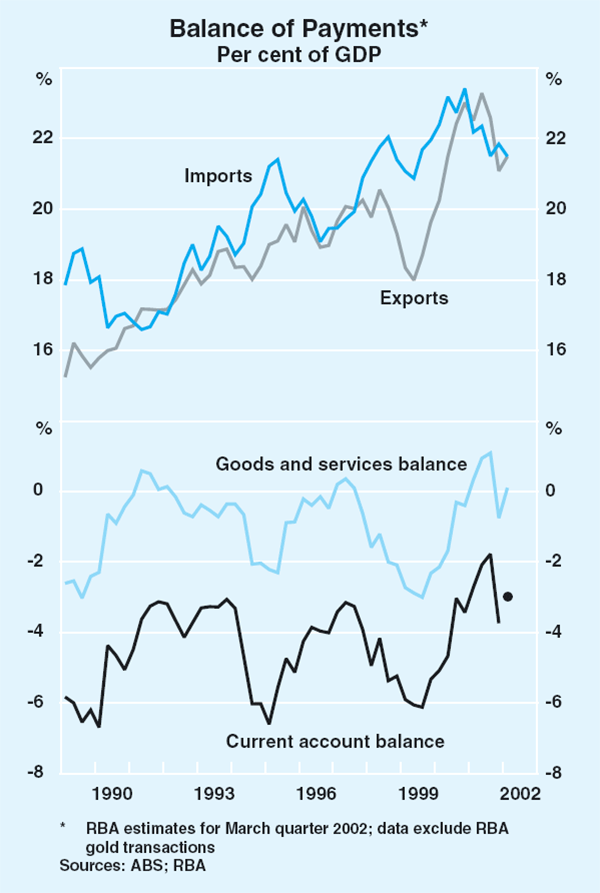
After contracting sharply towards the end of last year, Australia's exports recovered in the March quarter in line with the recovery in the world economy, so that the balance of trade returned to a small surplus in the quarter. Assuming that the net income deficit remained constant as a share of GDP, the deficit on the current account is likely to have narrowed from 3.7 per cent of GDP in the December quarter, to around 3 per cent in the March quarter (Graph 33).
In line with the softer growth in world trade, growth in Australia's merchandise exports to most markets has eased over the past year (Table 10). Exports to Japan have fallen, while growth in exports to Europe has slowed. Exports to east Asia (excluding Japan and China), after falling over much of the past year, have increased in the latest three months in line with improving economic conditions in the region.
| Growth | |||
|---|---|---|---|
| Share of total 2001 |
Year to March quarter 2001 |
Year to March quarter 2002 |
|
| East Asia (excluding Japan and China) | 26.6 | 18.8 | −2.8 |
| – of which Korea | 7.5 | 13.3 | −1.0 |
| Japan | 20.0 | 17.3 | −2.7 |
| EU | 11.8 | 17.4 | 2.7 |
| US | 10.2 | 15.9 | 7.4 |
| China | 6.5 | 26.6 | 9.5 |
| New Zealand | 6.1 | 6.9 | 14.7 |
| Middle East | 4.9 | 39.3 | 12.4 |
| India | 1.9 | 27.8 | 30.2 |
| World | 100.0 | 18.8 | 2.7 |
|
(a) Excludes gold Source: ABS |
|||
Over the past year, aggregate merchandise exports to the Middle East, China and India have increased by 13 per cent, compared with overall export growth of just under 3 per cent. Exports to the Middle East rose by 12½ per cent over the same period, following annual growth of almost 22 per cent on average over the past five years. The main export market within the Middle East is Saudi Arabia, which is Australia's largest market for exports of motor vehicles and a major market for exports of live animals. Last year Saudi Arabia purchased about $1.4 billion worth of motor vehicles, equivalent to about one-third of the total value of motor vehicles exported.
Exports to China have likewise grown at a rapid pace, rising by almost 10 per cent over the year to the March quarter 2002 to reach nearly $8 billion. This places China as Australia's fourth largest export destination. The major goods exported to China are metal ores, such as iron, copper and nickel, as well as cotton, wool and petroleum. China's recent accession to the World Trade Organisation should help sustain further rapid gains in exports to China.
While India is less significant in terms of the value of exports, ranked as Australia's 12th largest export market, exports to India have experienced one of the fastest growth rates, rising by 30 per cent over the year to the March quarter. Coal, metal ores and textile fibres, such as cotton and wool, are India's main imports from Australia.
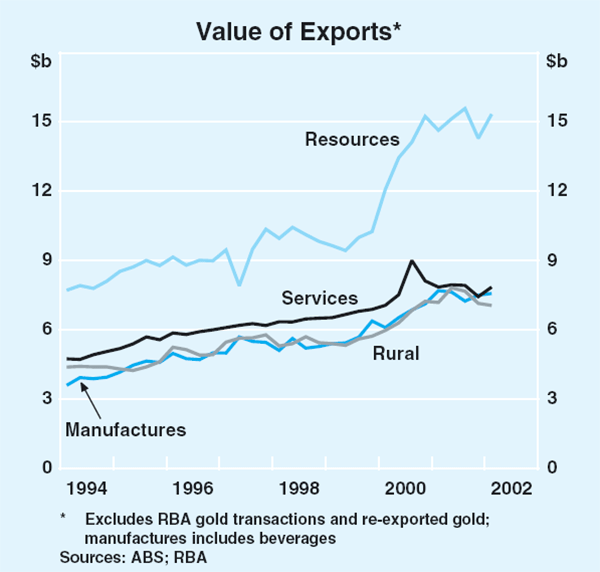
The rebound in export values in the March quarter was underpinned by a recovery in the value of resource exports, which had fallen sharply in the previous quarter (Graph 34). Exports of metal ores and minerals have been quite weak, though demand for aluminium and base metals is expected to improve this year owing to a recovery in demand in the major consuming regions of the US, Japan and Europe. The value of exports of coal, coke and briquettes has remained at a fairly high level over much of the past year, with capacity in the industry expected to rise modestly over the next few years as a result of increased profitability – in part a result of recent industry consolidation – and growing world coal demand; some stock rebuilding is also expected to occur. According to the Australian Bureau of Agriculture and Resource Economics (ABARE), mine production of gold is expected to fall slightly in 2002 following small declines in production in the two preceding years, primarily as a result of older mines coming to the end of their working life. Margins, however, remain quite positive, buoyed by the relatively high Australian dollar price of gold and reductions in production costs at new and existing mines.
The decision by the US to levy tariffs on steel products should have a relatively small direct effect on Australia's exports of steel, iron ore and coking coal, though the indirect effects could be larger. By volume, Australia produces about 1 per cent of world steel output, and exports account for a slightly smaller share of steel traded on the global market. Approximately one-quarter of Australia's iron and steel exports, worth about $400 million per annum, are destined for the US market; some 15 per cent of this will attract duty, since the steel tariffs apply only to specific types of steel beyond certain quantity thresholds. The indirect effect of the tariffs, however, may be significant. Australia faces more intense competition in third markets – the EU already has imposed tariffs of its own, ranging between 15 and 26 per cent, on imports of various steel products above a certain quota – and in the medium term the tariffs may lead to a lower volume of trade in commodities used in the production of steel, such as coal and iron ore.
Rural export values have fallen quite sharply over the past three quarters, albeit from a high level. As prices for rural commodities have remained firm, this has reflected quite a sharp fall in export volumes. Some of this fall is due to a reduction in the supply of wool as a result of historically low flock numbers and the rundown in the wool stockpile. According to ABARE, higher prices are expected to lead to a small rise in sheep numbers over the next year or two, though this is expected to be constrained by the significant capital investment undertaken by farmers who have switched to cropping from grazing over the past decade. The detection of mad-cow disease in Japanese cattle late in 2001 was a major setback for beef demand as consumer confidence in beef products was adversely affected (Japan accounts for more than one-third of Australia's beef exports). In contrast, a near record winter grain crop of almost 37 million tonnes is estimated to have been harvested in 2001/02.
Manufactured export values, which are sensitive to trading partner growth, have fallen in recent months and are around 2 per cent lower than the level in the March quarter 2001. The fall is the result of a decrease in the value of exports of machinery. In contrast, exports of transport equipment have risen by about 20 per cent over the past year and now account for 20 per cent of manufactured exports, compared with about 13 per cent in the mid 1990s.
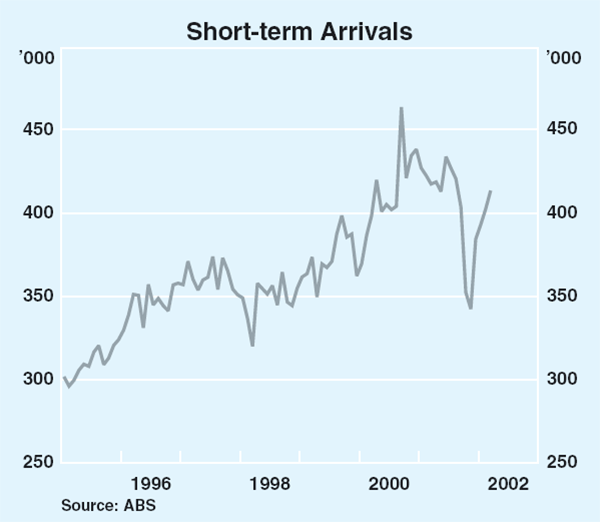
Service exports, which are also sensitive to trading partner growth, have fallen slightly in value terms over the year to the March quarter. A recovery in these exports, however, appears to be underway. Short-term visitor arrivals rose by about 12 per cent in the quarter and are now around 2 per cent below the level prevailing last August, prior to the disruption to international travel following the terrorist attacks in the US (Graph 35). The recovery in arrivals has been strongest for the UK, east Asia, and to a lesser extent, the US.
Reflecting the strength of the domestic economy, the value of imports has recovered slightly following a period of negative growth for much of 2001 (Graph 36). The value of consumption imports rose by around 1 per cent in the March quarter, boosted by increases in imports of toys, books and leisure goods; imports of motor vehicles declined in the quarter after recording a large increase in the December quarter. After growing strongly in the second half of 2001, capital imports declined slightly in the March quarter, despite a pronounced increase in imports of civil aircraft; capital imports are now 9 per cent higher than in the March quarter 2001. Imports of telecommunications equipment remain very weak. The shift in domestic demand from dwelling investment towards more import-intensive business investment is likely to increase demand for imports, as might growth in manufactured exports, as inputs to these exports are also quite import-intensive. Service imports have risen in recent months, but are 4 per cent lower over the past year.
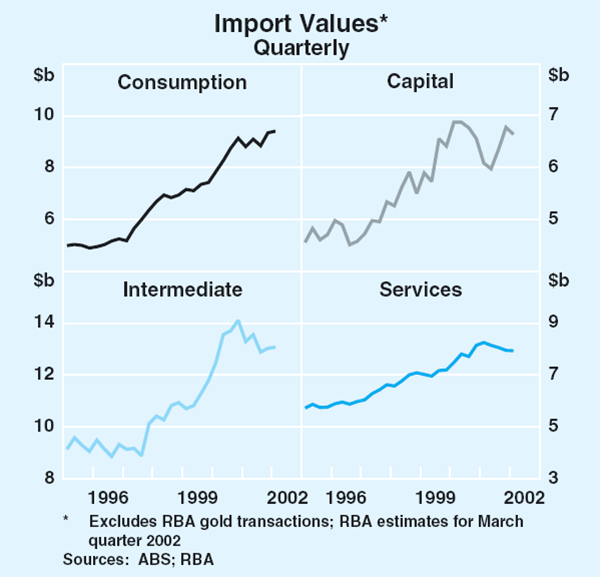
The net income deficit widened slightly in the December quarter to just below 3 per cent of GDP (Graph 37). This remains low in comparison with the past decade and a half, with the gradual accumulation of net foreign liabilities over that period being offset by the effect of lower global interest rates. Australia's total net foreign liabilities were little changed in the December quarter at around 60 per cent of GDP: net foreign debt fell to $326 billion in the December quarter, equal to 47 per cent of GDP, while net foreign equity rose slightly to be 13 per cent of GDP. The trend over the past two years of strong net debt inflows continued in the quarter, with net equity inflows relatively subdued.
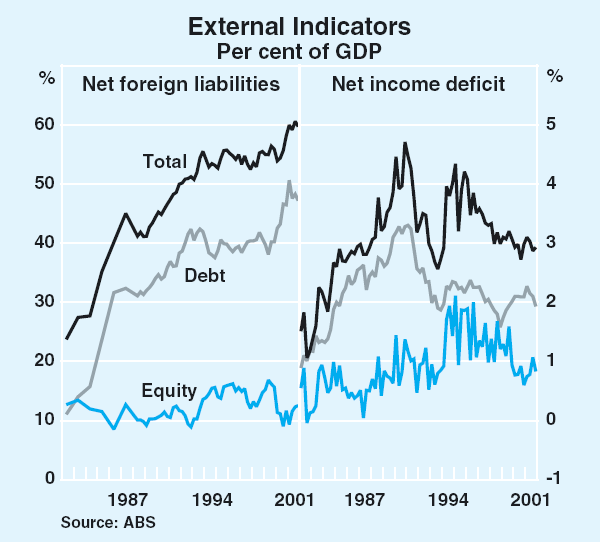
Commodity prices
Commodity prices have moved higher this year as world economic prospects have improved (Graph 38, Table 11). In addition, political tensions in the Middle East have boosted oil prices (see the chapter on ‘International Economic Developments’ for details). The RBA Commodity Price Index has risen by around 4 per cent in SDR terms since the beginning of the year; the index has fallen slightly in Australian dollar terms, reflecting the appreciation of the exchange rate, though it remains nearly 40 per cent higher than the low point reached three years ago.
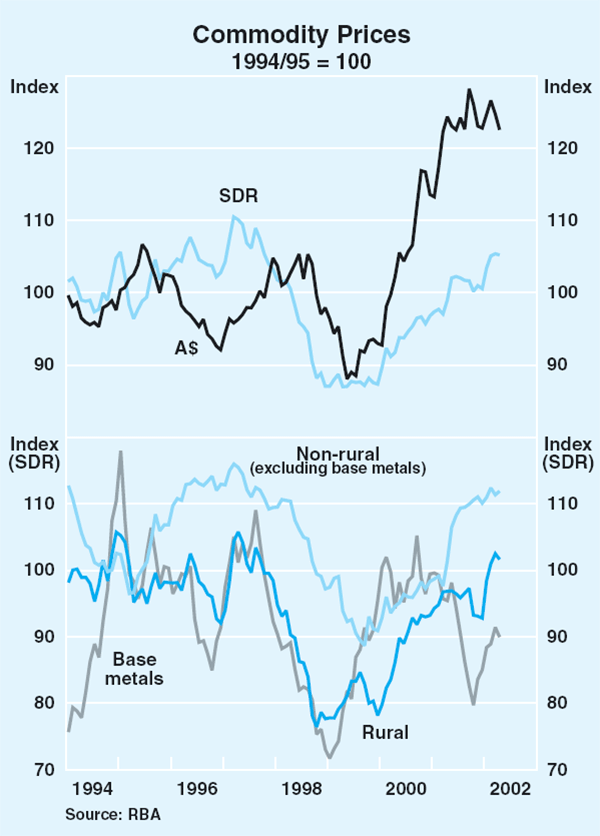
| April | Latest 3 months |
Year to latest 3 months |
|
|---|---|---|---|
| Rural | −0.8 | 7.3 | 5.8 |
| – beef and veal | 1.0 | 7.3 | 16.4 |
| – wool | −0.9 | 26.8 | 20.2 |
| – wheat | −3.4 | −1.1 | 0.3 |
| – sugar | −2.6 | −9.8 | −25.4 |
| Base metals | −1.6 | 5.2 | −6.9 |
| – aluminium | −2.8 | 3.3 | −8.1 |
| – copper | −1.6 | 8.9 | −5.8 |
| – nickel | 5.5 | 18.9 | 4.8 |
| – lead | −2.2 | −2.4 | −0.6 |
| Other resources | 0.5 | 1.1 | 12.6 |
| – gold | 2.4 | 8.2 | 16.5 |
| RBA Index | −0.2 | 3.5 | 7.5 |
| Memo items: | |||
| Oil in US$(a) | 7.3 | 22.4 | −15.2 |
| Coal in US$(b) | 0.0 | −1.0 | −6.5 |
| (a) Oil prices are not included in the RBA Index. (b) Spot price for steaming coal from the Australian Coal Report; latest observation is for March. |
|||
Rural commodity prices have continued to rise and are now back around levels recorded in the mid 1990s. To some extent this reflects favourable supply developments in Australia's main rural exports. Beef and veal prices have held up as overseas producers rebuild herds following outbreaks of foot and mouth and mad-cow disease, while wool prices have also benefited from tight supply conditions resulting from the elimination of Australia's wool stockpile and reductions in the national flock. One exception to these developments has been sugar, with prices falling over the past 18 months owing to increased world production.
Non-rural commodity prices (excluding base metals) have edged higher since the beginning of the year. This mainly reflects the recent rise in the price of gold to above US$300 per ounce, buoyed by strong Japanese demand and safe-haven buying associated with increased tensions in the Middle East. Spot market prices for thermal coal have increased as world demand has recovered, though contract prices for both thermal and coking coal have not yet been settled for the contract year beginning in April.
Reflecting the improved prospects for the world economy, base metals prices have continued to rise from their lows recorded in October 2001. The rise in prices has been strongest for nickel – due in part to stainless steel producers aggressively cutting inventories of nickel last year – and copper. Aluminium has recorded a smaller price gain owing mainly to developments on the supply side of the market, including the prospect of a restart of idle capacity in the US and planned additions to capacity in China.
The improvement in the global outlook has also put upward pressure on prices of a number of industrial commodities which Australia imports. The Journal of Commerce index of industrial prices, which measures daily price movements in a collection of industrial metals, chemicals and building materials, has increased by 9 per cent in US dollar terms so far this year, recovering close to one-half of the fall that occurred through 2001. DRAM prices have also risen, with prices for 128 megabytes of DRAM, as measured by DRAMexchange.com, increasing from around US$1.30 in mid November to around US$3.60 in April.
Domestic Financial Markets
Market interest rates
During the course of 2001, official interest rates were eased by 200 basis points, to an historic low of 4.25 per cent. This included several reductions in the second half of the year, which sought to anticipate the impact on Australia of a further weakening in the world economy. In the event, even though world economic conditions did deteriorate in late 2001, the Australian economy remained resilient.
Over the past few months, the steady stream of better-than-expected economic data released in Australia (against a background in which there has also been some improvement in the world economic outlook) has led markets to price-in a return of official interest rates to more normal levels over the course of 2002. By early May, markets had fully priced-in an imminent tightening of 25 points, with a further 75 basis points tightening over the rest of 2002. Against this background, the Bank's announcement of a 25 point tightening on 8 May caused little market reaction (Graph 39).
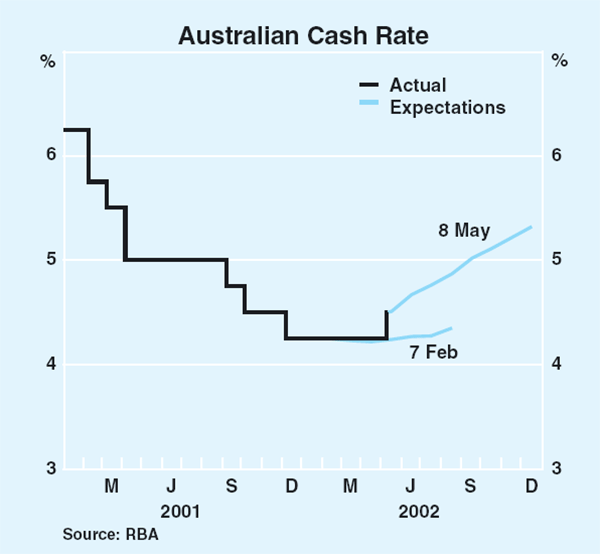
As a result of this move, the spread between cash rates here and in the US has increased to 275 basis points, the highest it has been since the early 1990s (Graph 40). Markets expect this could widen further in the months ahead due to the greater strength of the Australian economy.
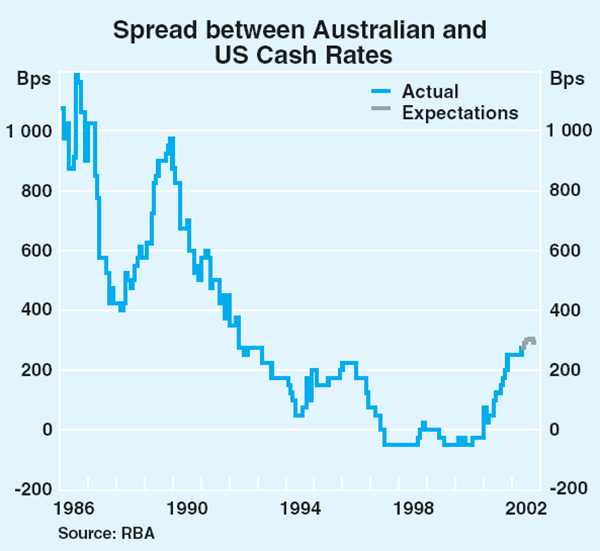
Australian long-term bond yields have shown a net increase of 10 basis points in 2002. Yields rose sharply in the first half of March on the back of the strong GDP, retail sales and labour market reports and higher US bond yields. More recently, a substantial fall in US yields has caused local yields to fall. The Australian 10-year bond yield stood at 6.10 per cent in early May after reaching a high of over 6.50 per cent in mid March (Graph 41).
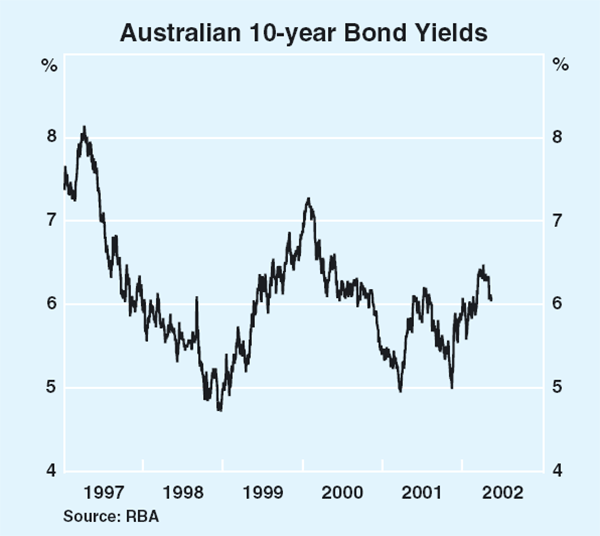
Reflecting the relatively strong economic outlook for Australia, the net rise in domestic long-term yields over the past three months has been larger than in comparable yields in the US. This continues a pattern that was evident through most of 2001. The spread between 10-year government bonds in Australia and the US moved through 100 basis points in early February, reaching 120 basis points in March, and has fluctuated around 105 basis points since (Graph 42).
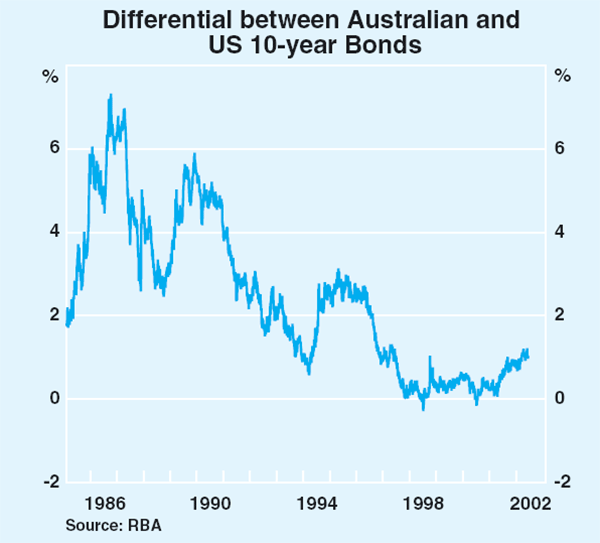
The widening in the nominal spread between Australian and US 10-year bonds since early 2001 appears to have been largely matched by a change in the spread in real interest yields (on indexed bonds) between the two countries (Graph 43). As such, it appears that the widening reflects a favourable reassessment of Australia's real growth prospects relative to those for the US, rather than a deterioration in relative inflation performance.
Over the three months to early May, most corporate bond yields have risen by a few basis points more than government yields. For example, spreads on bonds rated A and better have risen by around 7 basis points since end January (Graph 44). Australian credit spreads remain well below those seen in the US (Graph 45). Strong demand for non-government bonds (see ‘Debt markets’ below) continues to exert downward pressure on domestic credit spreads.
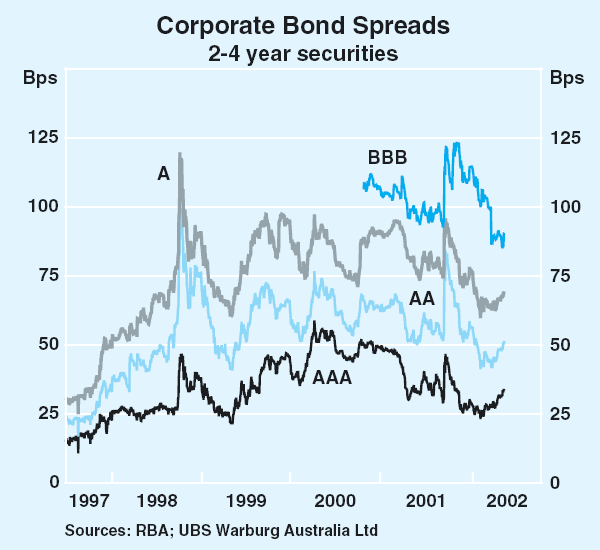
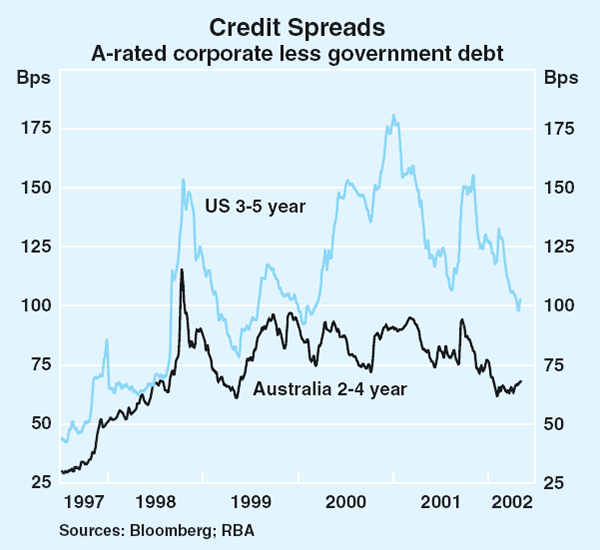
Capital markets developments
Debt markets
Issuance in the domestic non-government bond market reached a record high of $10.5 billion in the first quarter of 2002, of which about half was asset-backed securities and half direct bond issuance (i.e. not asset-backed) (Graph 46, Table 12).
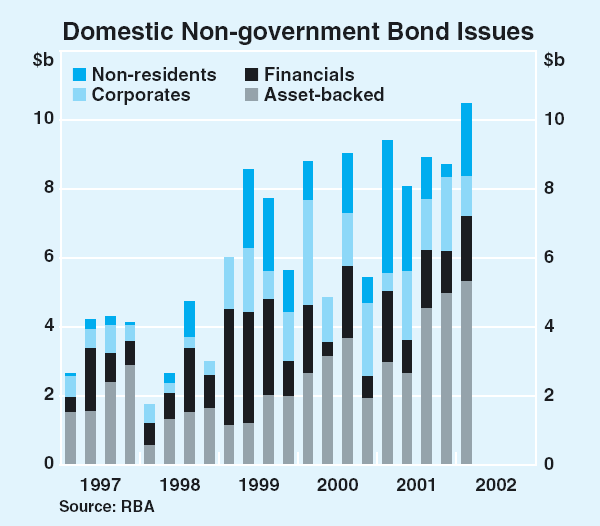
| Sector | 1999 | 2000 | 2001 | 2002:Q1 |
|---|---|---|---|---|
| Financials | 10.4 | 5.1 | 6.0 | 1.9 |
| Non-residents | 5.6 | 3.5 | 7.8 | 2.1 |
| Australian corporates | 5.5 | 8.0 | 6.1 | 1.1 |
| Total direct issuance | 21.5 | 16.6 | 19.9 | 5.1 |
| of which: | ||||
| – Credit-wrapped* | – | 3.8 | 2.0 | 0.4 |
| – Floating rate notes | 1.1 | 6.5 | 5.3 | 1.8 |
| Asset-backed issuance | 6.4 | 11.4 | 15.1 | 5.3 |
| Total new issuance | 27.9 | 28.0 | 35.0 | 10.5 |
| * Bonds with credit ratings enhanced by the backing of a third party | ||||
The $5 billion of asset-backed securities issued in the March quarter was a record. The sector has also continued to diversify, as illustrated by the issue in March of $295 million of bonds backed by endowment policies (a form of life insurance policies which pay out a lump sum on the death of the policyholder or at the end of a fixed period). This marked the first time such receipts had been securitised anywhere in the world. Also, $76 million of commercial mortgage-backed securities were issued by a large listed property trust, marking the first subordinated debt issue by a listed property trust in the Australian asset-backed bond market. In addition, $500 million of non-conforming residential mortgages (i.e. higher risk mortgages such as those with high loan-to-valuation ratios) were securitised in March.
Direct bond issuance amounted to $5.1 billion in the March quarter. Non-residents' share remained at around 40 per cent with more than half the value of issues by non-residents attributable to issuers who had not previously raised funds in the Australian market. Financial institutions' share of direct issuance picked up in the March quarter but is still well down on that seen a few years ago. Corporate issuance, at $1.1 billion, was well down compared with quarterly issuance in 2000 and 2001. Property trusts remain the predominant issuers in this group.
The total stock of private bonds on issue continues to grow. Until late last year, issues of direct bonds were the driving force behind this growth: the stock of direct non-government bonds outstanding rose by a monthly average of $1.1 billion between January 1998 and October 2001, with a steady flow of new issues substantially exceeding maturities of existing bonds (Graph 47). More recently, growth in the stock of direct bonds outstanding has slowed, because of heavy maturities. The increase in private bonds outstanding has mainly been in the form of asset-backed securities.
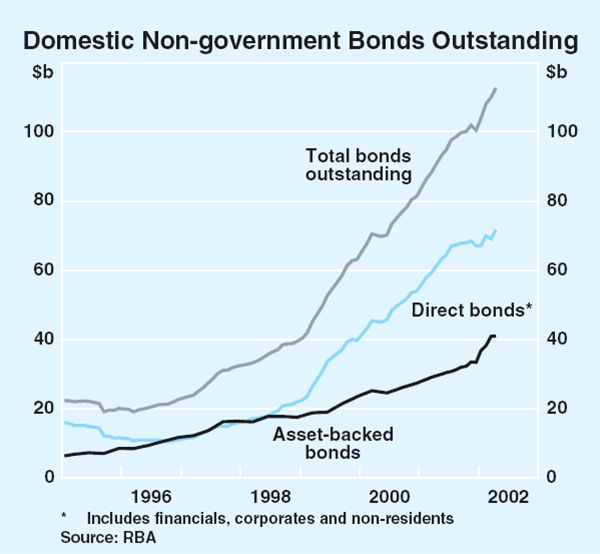
Survey data suggest fund managers have recently increased their appetite for AA, A, and BBB-rated securities rather than higher-rated bonds, although their holdings of speculative-grade bonds, i.e. those rated below BBB, remain minimal (Graph 48). (The survey includes funds managers' holdings of both domestically issued and foreign bonds.) This trend marks an unwinding of the run-up in AAA-rated securities' share in funds managers' portfolios through the second and third quarters of 2001. Consistent with the strong demand for lower-rated bonds, an Australian mining company recently chose to issue BBB-rated paper domestically rather than abroad as it had previously done. Nonetheless, many issuers prefer to seek credit enhancement of their bonds, opting to pay a credit insurance premium to ensure quick take up by investors. About 10 per cent of all direct bonds outstanding have been credit-enhanced.
Offshore bond issuance by Australian institutions was strong during the March quarter, totaling $12 billion compared to a quarterly average of $11 billion in 2001. This issuance was made up mostly of issues by asset-backed vehicles ($6 billion) and financial institutions ($5 billion). As mentioned in the chapter on ‘International and Foreign Exchange Markets’, issuance of Australian dollar denominated bonds by foreign institutions into offshore markets has also been strong in recent months.
Equity markets
Australian share prices reached a record high in early March, boosted by the favourable news concerning the domestic economy and signs of improvements in the US economy. More recently, against a background of substantial falls in overseas share markets, local share prices have fallen somewhat. Over the past three months, share prices have shown a net fall of 3 per cent. This was less than the fall in US share prices, continuing the pattern since 2000 of greater strength in the domestic share market (Graph 49). The ASX 200 index remains only 5 per cent below its peak, while broadly based US indexes are down by about 30 per cent from their respective peaks.
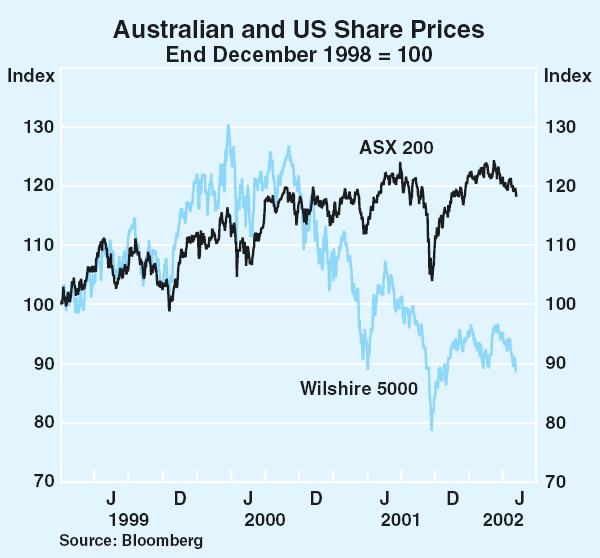
The main beneficiaries of recent buoyancy in the Australian share market have been those companies whose profits are most sensitive to the economic cycle. Since end January, share prices in the industrials and energy sectors have risen the most (Graph 50). The telecommunications, information technology and health care sectors all recorded substantial falls. These sectors, however, account for only a small share of the market, together making up just 9 per cent of total market capitalisation.
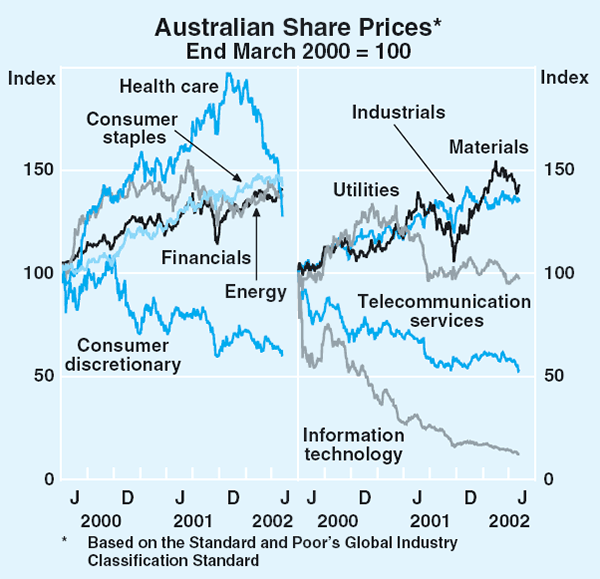
Australian companies recently finished reporting their earnings for the second half of calendar 2001. While reported earnings of the 100 largest companies were 20 per cent below those reported in the corresponding period of the previous year, this mainly reflects one-off asset write-downs, particularly by financial and media companies, rather than a decline in underlying profitability (Table 13). The earnings of industrial companies other than those in the finance and media sectors fell by 8 per cent in 2001. These figures were also affected by abnormals, particularly Telstra's abnormal gain reported in the previous year.
| Second half of 2001 | 2001 | |
|---|---|---|
| Total | −20 | −13 |
| Industrials* | −21 | −17 |
| Industrials ex finance and media | −8 | −8 |
| Resources | −17 | 5 |
| * Industrials based on the ASX broad definition | ||
Forecasts for earnings for industrial companies in the current year are for a rise of about 15 per cent. In contrast to the normal tendency for forecast earnings to be revised down as the year progresses, forecasts over recent months have remained steady, supported by strong economic activity (Graph 51).
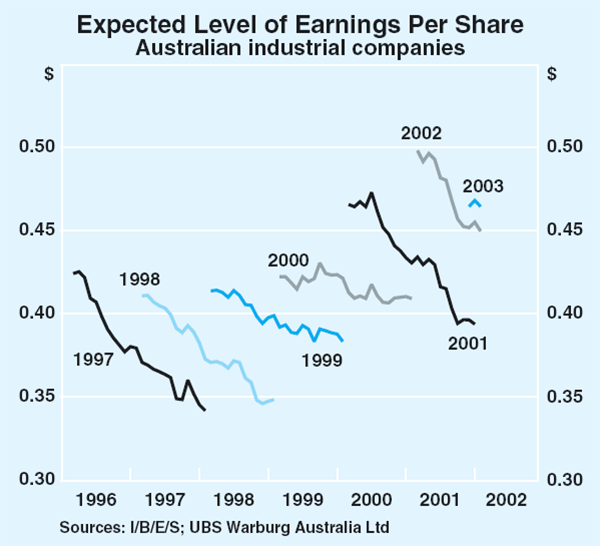
The Australian price-earnings (P/E) ratio based on reported earnings is currently around 28, a level almost twice its long-run average of 14. This ratio has been driven higher in recent months by large abnormal losses. The P/E ratio based on forecast operating earnings has been much more stable but, at 16, is also above its long-run average. These Australian figures are, however, well below comparable US figures (Graph 52). In the US, the recent very poor profitability of companies has pushed the P/E ratio based on ‘as reported’ earnings up to 45. The P/E ratio based on forecast ‘operating’ earnings stands at 20.
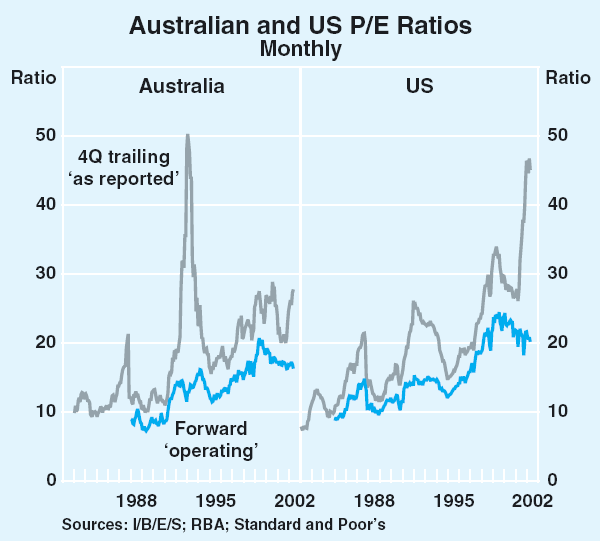
Equity raisings were solid during the March quarter, with over $3 billion raised (Graph 53). Most of these funds were raised through a small number of large placements, with investor demand for these offerings strong. Very little of these funds were raised through initial public offerings, suggesting investors remain wary of newly developing companies. Notwithstanding the recent rise in the Australian dollar, strong resource prices have encouraged a number of small initial public offerings from mining companies. Mining companies accounted for almost a third of the number of initial public offerings, though only 9 per cent of funds raised in the March quarter. Most of the companies foreshadowed to list on the ASX in coming months are resource ventures.
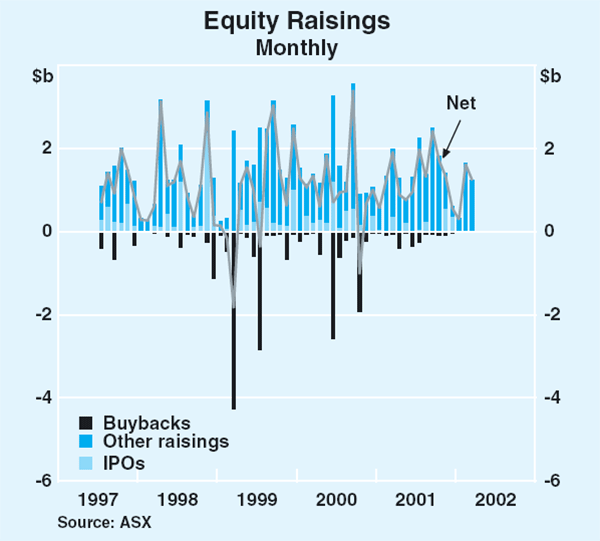
Growth in margin lending for equities and managed funds picked up in the March quarter. Total margin debt grew by 9 per cent, the strongest growth seen since June 2001 (Table 14). The increase over the past year has been about 30 per cent. While some of this growth came from an increase in the number of people taking out margin loans, the average loan size also increased, rising by 4 per cent over the quarter. Nevertheless, it remains the case that holdings of margin loans are quite widely dispersed with less than 0.02 per cent of clients holding loans greater than $10 million. Both the average level of credit limit usage and average leverage fell slightly over the quarter. Average credit limit usage is now at its lowest level since December 2000, while average leverage is at its lowest level since the Bank began surveying margin lenders in September 2000. The average number of margin calls per day fell, in line with the fall in overall market volatility. In terms of the assets underlying margin loans, there was a small shift away from Australian shares (which now account for 60 per cent of underlying assets) towards managed fund investments.
| Level at end | Growth | ||||
|---|---|---|---|---|---|
| December 2001 | March 2002 | 3 months to March 2002 Per cent |
12 months to March 2002 Per cent |
||
| Total margin debt ($b) | 8.9 | 9.7 | 9 | 32 | |
| Credit limit ($b) | 14.7 | 16.2 | 11 | 37 | |
| Value of underlying security ($b) | 19.4 | 21.6 | 11 | 37 | |
| Average number of margin calls per day | 220 | 177 | −20 | −32 | |
| Number of clients (‘000s) | 104 | 109 | 4 | 21 | |
| Average loan size ($) | 85,916 | 88,916 | 4 | 9 | |
| Credit limit used (per cent) | 61 | 60 | |||
| Leverage (per cent) | 46 | 45 | |||
Intermediaries' interest rates
Intermediaries' variable-rate housing loans, which tend to be set by reference to official interest rates, were unchanged between early December and early May, in line with steady monetary policy (Graph 54). At the time of writing, banks had not yet responded to the May tightening.
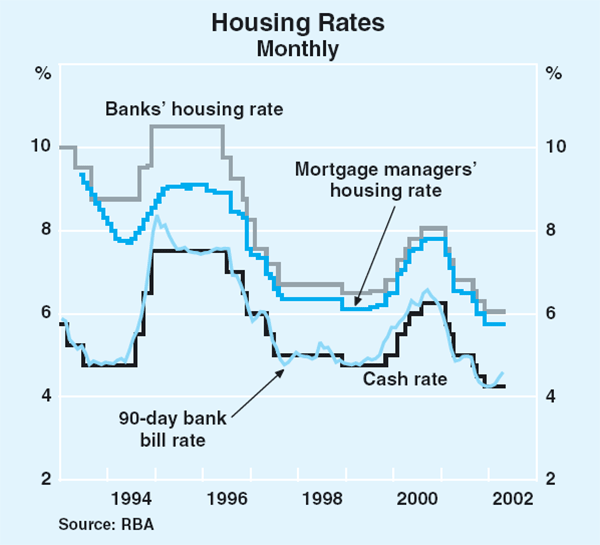
Term loans for small business were reduced by 5 basis points in early February (Table 15). This fall was a delayed response to the December cut in the cash rate. Such delayed and incomplete pass through of cash rate reductions to small business was evident throughout the second half of 2001, adding to a widening of margins that began in early 2000 (Graph 55). The widening has been more significant for loans secured by assets other than residential property, reflecting continued adjustment by banks to the higher risk of such loans. Despite the extent of the widening – as much as 55 basis points – the margin between the weighted average variable interest rate paid by small businesses and the cash rate has fallen slightly between September 1999 and December 2001, as businesses have switched to lower-priced products.
| Current level (end April) |
|
|---|---|
| Variable rates | |
| Household | |
| Mortgages: | |
| – Standard variable | 6.05 |
| – Basic housing | 5.50 |
| – Mortgage managers | 5.75 |
| Personal lending: | |
| – Residential secured | 6.20 |
| – Credit cards | 15.65 |
| Small business | |
| Residential secured: | |
| – Overdraft | 6.80 |
| – Term loan | 6.25 |
| Other security: | |
| – Overdraft | 7.50 |
| – Term loan | 6.85 |
| Large business | |
| – Overdraft | 7.85 |
| – Term loan | 7.70 |
| Cash rate | 4.25 |
| Fixed rates (3 years) | |
| Housing | 6.85 |
| Small business | 7.40 |
| Swap rate | 6.00 |
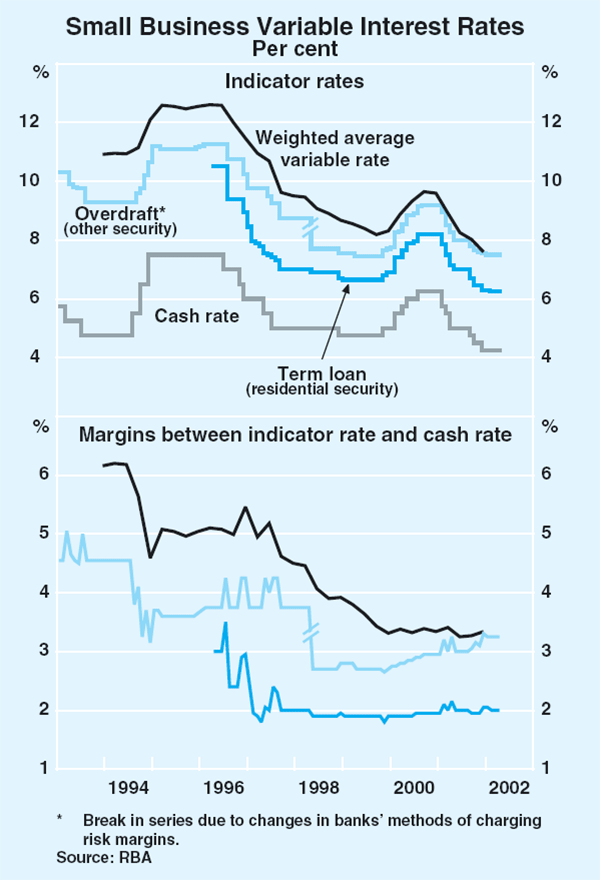
In contrast to the stability of variable rates, fixed rates have risen from their record lows of late 2000. These interest rates are set by reference to the market rates (i.e. swap rates) and the recent rise reflects increases in these market rates.
Overall, however, banks have cut their margins on fixed-rate loans. This has been particularly the case for the interest rate on 3-year housing loans, which has risen by substantially less than the swap rate since late 2001 (Graph 56).
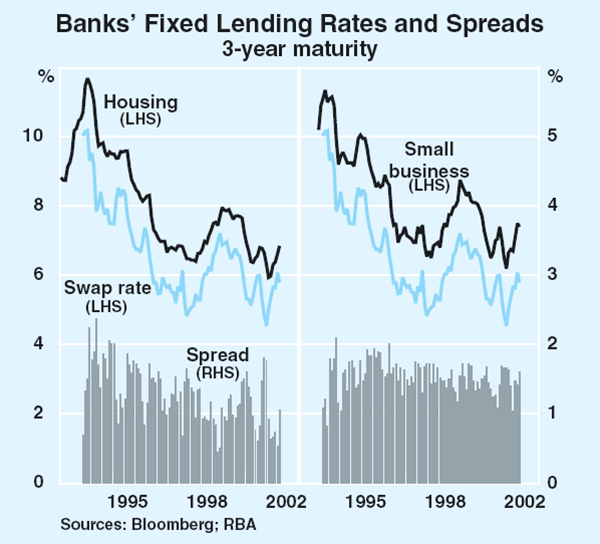
Fixed-rate housing loans have become more popular in recent months, increasing from 5 per cent of loan approvals in November 2001 to 8 per cent in February 2002. This increase in usage of fixed-rate loans has come despite the recent rises in fixed rates and the fact that fixed rates are the same as, or higher than, current variable rates. Expectations of imminent rises in official interest rates, which would normally be followed by rises in banks' variable rates, most likely contributed to the switching to fixed-rate loans.
Assessment of Financial Conditions
Monetary policy was tightened by 25 basis points in May, lifting the cash rate to 4.5 per cent. Notwithstanding the tightening of monetary policy and a rise in market yields over the past quarter, financial conditions continue to be supportive of economic activity. This is evident in the low level of real rates, the positive slope of the yield curve and equity prices which, although below their peak, are still conducive to capital raisings. The real exchange rate is also at a level supportive of the traded sector, despite a steady appreciation since the beginning of the year.
Interest rates
The current level of the cash rate when expressed in real terms remains well below the average of the past decade, a period characterised by moderate inflation and output growth of around 4 per cent. It is possible to calculate three different measures of the real cash rate – using underlying inflation, bond market inflation expectations and inflation expectations derived from consumer surveys. All three measures show its current level is below the average over the period since 1992, but by different amounts (Table 16). The same calculations over the period since 1997, during which inflation has been around 2¼ per cent and output growth around 4 per cent, show that the current real rate is between ¾ to 1¼ percentage points below its average level. The narrower range probably reflects the fact that inflation expectations have become more aligned with actual inflation outcomes over the latter half of the 1990s. The average nominal cash rate over the period since 1997 is around 5¼ per cent, and 5¾ per cent for the period since 1992.
| Nominal | Real – based on: | |||
|---|---|---|---|---|
| Weighted median inflation(a) |
Bond market expectations |
Consumer expectations(a) |
||
| Current level | 4.5 | 1.6 | 1.9 | 0.2 |
| 1992–2002 average | 5.7 | 3.5 | 2.5 | 1.5 |
| 1997–2002 average | 5.2 | 2.9 | 2.7 | 1.0 |
| Current deviation from: | ||||
| 1992–2002 average | −1.2 | −1.9 | −0.6 | −1.3 |
| 1997–2002 average | −0.7 | −1.3 | −0.8 | −0.8 |
|
(a) Adjusted for tax changes Sources: ABS; Melbourne Institute; RBA |
||||
Using these three methods of calculating real interest rates, but applying them to variable interest rates charged by intermediaries for housing loans, results in estimates that show a larger gap below the decade average. This reflects the reduction in margins charged on mortgages over the 1990s (Graph 57). For business loans the variable rate in real terms remains below the average of the past decade by a comparable margin to the cash rate. Fixed interest rates charged by intermediaries, which account for a smaller share of business loans than floating rate funding, look less expansionary as they have risen by more than the rise in the cash rate over the past few months, reflecting movements in market yields.
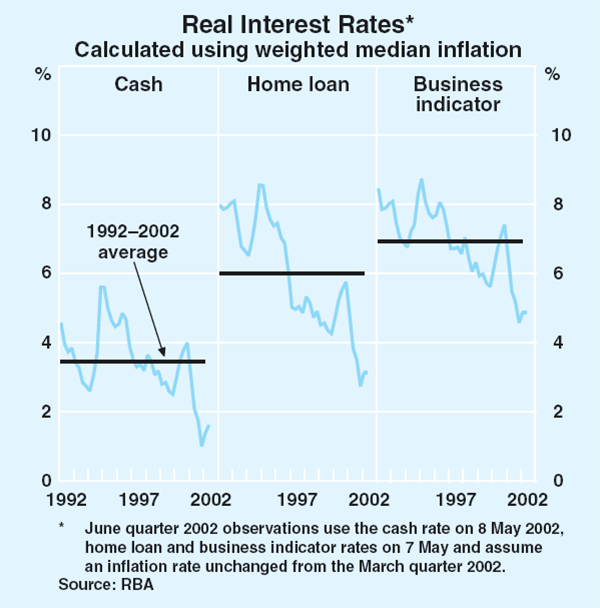
The slope of the yield curve, as measured by the difference between the 10-year bond yield and the 90-day bank bill rate, remains positive and at a higher level than has been typical in recent years, but not exceptionally so (Graph 58). This generally means that short-term rates are lower than the levels expected to prevail in the longer term, a situation which is generally taken to indicate an expansionary policy setting. Growing confidence in a sustained economic recovery pushed long-term interest rates higher over the past three months, but this was more than matched by the upward movement in short-term interest rates.
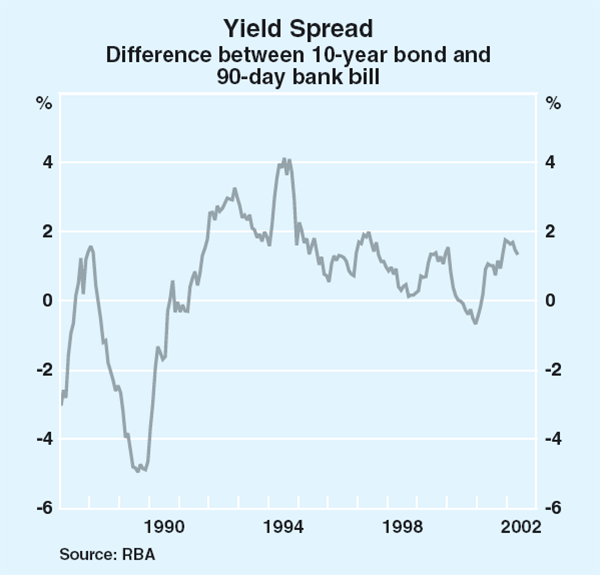
Financing activity
Credit grew at an annualised rate of around 9 per cent in the six months to March, slightly above the rate recorded over the preceding six months (Graph 59). Credit expansion continued to be dominated by household borrowing, which grew at an annualised rate of around 15½ per cent in the six months to March, with borrowing for housing particularly strong, reflecting low interest rates and the impetus from the Government's First Home Owner Grant. In recent months the growth in housing credit has eased a little, following the moderation in housing loan approvals, but it remains at a relatively fast pace by historical standards.
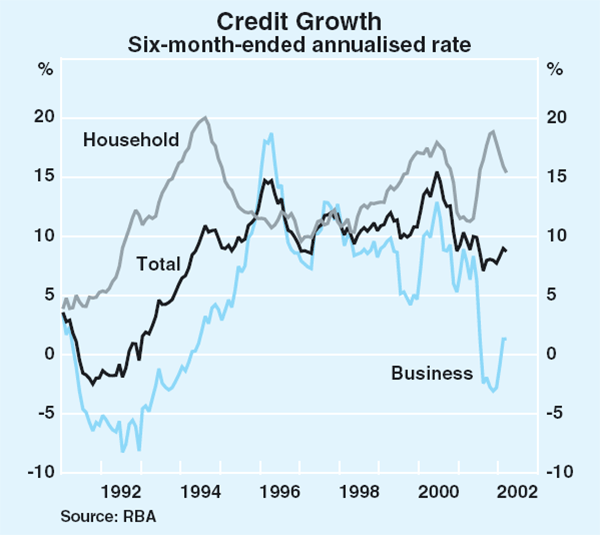
Business borrowing was subdued over the six months to March, growing by 1¼ per cent on an annualised basis. Nonetheless, this represented an increased pace from the slight decline recorded over the preceding six months, and business loan approvals have picked up in recent months. As discussed in the chapter on ‘Domestic Economic Activity’, an increased willingness to borrow by businesses is consistent with the improved investment outlook, although businesses should also be able to finance much of their investment from accumulated internal funds and equity raisings.
On the liability side of intermediaries' balance sheets, growth in the broader monetary aggregates has outpaced growth in credit, with annualised growth in broad money of 10½ per cent in the six months to March (Graph 60). This partly reflects rapid growth in bank deposits of businesses, as a result of the strength of their internal funding. Another factor has been a shift in bank balance sheets such that a greater proportion of their funding has been accounted for by issuing certificates of deposit (CDs) rather than bank bills. Since CDs are counted in the monetary aggregates, the switch has led to an increase in the broader monetary aggregates. With growth in domestically sourced liabilities outstripping that in assets, financial intermediaries have reduced their offshore borrowings over the past six months.
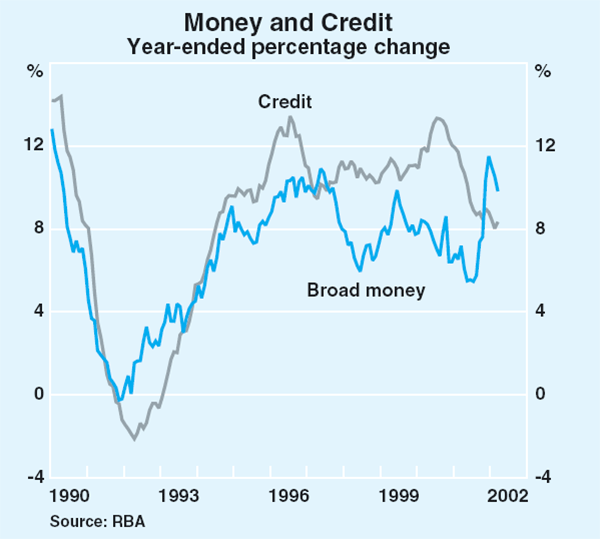
Real exchange rate
As discussed in the chapter on ‘International and Foreign Exchange Markets’, the Australian dollar rose against all the major currencies over the past three months. Over 2002 to date, the real exchange rate, which adjusts for inflation across our trading partners, has risen by around 4 per cent. For the competitive position of the import and export-competing sectors of the economy, the level of the real exchange rate is more important than changes, and the current level remains around 8 per cent below its 1990s average (Graph 61).
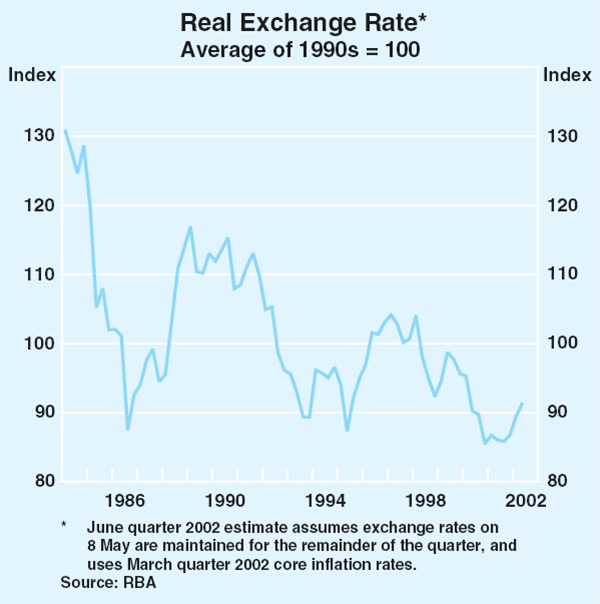
Inflation Trends and Prospects
Recent developments in inflation
Consumer prices
The Consumer Price Index (CPI) increased by 0.9 per cent in the March quarter and by 2.9 per cent over the year (Graph 62). The largest contributors to the rise in the quarter were a further rise in the price of holiday travel and accommodation, reflecting changes in the airline industry, and a number of seasonal price increases, including for pharmaceuticals and education.
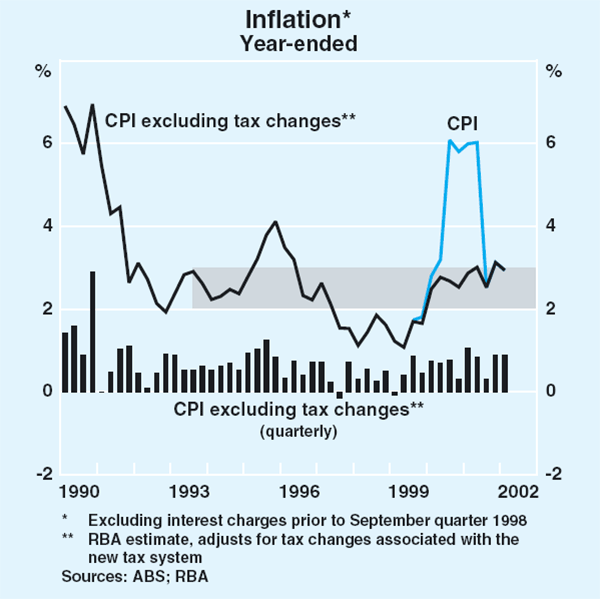
As in the December quarter, the various measures of underlying inflation are providing somewhat different readings of inflationary pressures (Table 17). Statistical measures such as the weighted median and the trimmed mean suggest that underlying inflation has fallen from 3¼ per cent in the December quarter to just under 3 per cent in March. In contrast, exclusion measures continue to report underlying inflation of over 3½ per cent. The main reason for this divergence is that some of the items that have made the most significant contributions to year-ended inflation, such as meat prices and overseas travel, remain in the exclusion measures, whereas other items that have made large negative contributions to year-ended inflation, such as petrol, have been removed. As explained in Box D, the Bank's assessment is that the statistical measures are currently providing the more accurate reading on underlying inflation.
| Quarterly | Year-ended | ||||
|---|---|---|---|---|---|
| December quarter 2001 |
March quarter 2002 |
December quarter 2001 |
March quarter 2002 |
||
| CPI | 0.9 | 0.9 | 3.1 | 2.9 | |
| –Tradables | 0.8 | 0.6 | 3.1 | 2.3 | |
| – Non-tradables | 1.0 | 1.1 | 3.1 | 3.6 | |
| Underlying inflation | |||||
| Weighted median(a) | 0.7 | 0.5 | 3.2 | 2.8 | |
| Trimmed mean(a) | 0.7 | 0.6 | 3.3 | 2.9 | |
| CPI excluding volatile items | 0.9 | 1.0 | 3.6 | 3.6 | |
| Market goods and services excluding volatile items | 1.1 | 0.8 | 3.6 | 3.6 | |
|
(a) For more information on these measures, see ‘Box D: Underlying Inflation’. Sources: ABS; RBA |
|||||
The largest contribution to the CPI in the March quarter was made by holiday travel and accommodation prices (particularly the overseas component), which increased by 4.7 per cent in the quarter and by 11.3 per cent over the year. Some of this price rise reflects the introduction of air passenger ticket and insurance levies at the end of last year. In addition, there were seasonal price increases for several items, including pharmaceuticals, which increased by 11.4 per cent in the quarter but by only 1.5 per cent over the year, and education, which increased by 4.7 per cent in both quarterly and year-ended terms. Partially offsetting these rises, small price falls were recorded in the quarter for a range of household furnishing, household appliance, clothing and footwear items. Fruit and vegetable prices also declined by 1.6 per cent in the March quarter, partially unwinding the 10.2 per cent increase in prices recorded in December.
In addition to the effect of the higher cost of holiday travel and accommodation, the annual inflation number was boosted by meat prices, which increased by 12.3 per cent as a result of supply constraints in world markets, and household insurance prices, which increased by 7.0 per cent following recent upheavals in that industry. The price of petrol, however, fell by 8.9 per cent over the year, reducing CPI inflation by around ¾ of a percentage point. Audio, visual and computing equipment prices also fell by 3.5 per cent over the year.
Tradables price inflation (excluding petrol and food) picked up sharply over the course of 2000 and 2001 in response to the depreciation of the exchange rate (Graph 63). In recent quarters, tradables inflation has stabilised, suggesting that the peak impact of the exchange rate depreciation on the inflation rate may have been reached. Reflecting the strength of the domestic economy, non-tradables inflation has picked up in recent quarters.
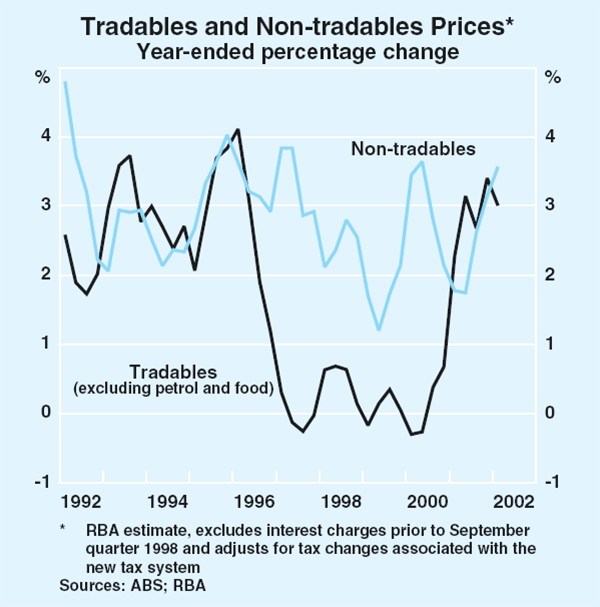
Producer prices
Producer prices, which provide a measure of input costs, continued to moderate in the March quarter, as another sharp fall in the price of oil and declines in the prices of a number of other imported items largely offset moderate price increases across a range of domestic items. At the final stage of production, prices rose by 0.2 per cent, to be 2.0 per cent higher over the year (Table 18). Price pressures at earlier stages of production have also moderated significantly from year-ended growth rates of around 10 per cent in late 2000. Intermediate-stage and preliminary-stage prices fell by 0.8 per cent and 1.2 per cent in the quarter.
| March quarter 2002 |
Year to March quarter 2001 |
Year to March quarter 2002 |
|
|---|---|---|---|
| Preliminary | −1.2 | 6.0 | 0.5 |
| – Domestic | −0.7 | 4.9 | 1.4 |
| – Imported | −4.6 | 13.1 | −4.8 |
| – Excluding oil | −0.2 | 4.6 | 2.5 |
| Intermediate | −0.8 | 5.3 | 1.8 |
| – Domestic | −0.4 | 4.3 | 2.6 |
| – Imported | −3.6 | 11.8 | −3.1 |
| – Excluding oil | −0.1 | 4.3 | 3.2 |
| Final(a) | 0.2 | 3.8 | 2.0 |
| – Domestic | 0.8 | 2.5 | 2.5 |
| – Imported | −2.4 | 9.5 | −0.1 |
| – Excluding oil | 0.2 | 3.3 | 2.6 |
|
(a) Excluding exports Sources: ABS; RBA |
|||
With crude oil prices, as measured by the producer price index, falling by 13 per cent in the March quarter, some of these differences in the quarterly price movements reflect the higher weight of crude oil prices at earlier stages of production. Abstracting from oil, the falls in imported components of producer prices were fairly uniform, with declines of between 2¼ and 2¾ per cent in the March quarter. This partly reflects the appreciation of the Australian dollar in the quarter and continuing downward pressure on the prices of goods such as industrial machinery and electrical equipment owing to weak global demand. On an industry basis, the largest producer price increases were for real estate agent services, some business services and, to a lesser extent, the construction sector.
Business surveys suggest that upstream cost pressures are generally subdued, though it appears that they are no longer declining and cost increases are more widespread than they have been in recent quarters (Graph 64). The economy-wide NAB survey reported that purchase costs increased by 0.4 per cent in the March quarter and that expected increases in purchase costs in the June quarter have edged higher. According to the manufacturing-based ACCI-Westpac survey, the net balance of firms experiencing and expecting cost increases remained steady in the March quarter.
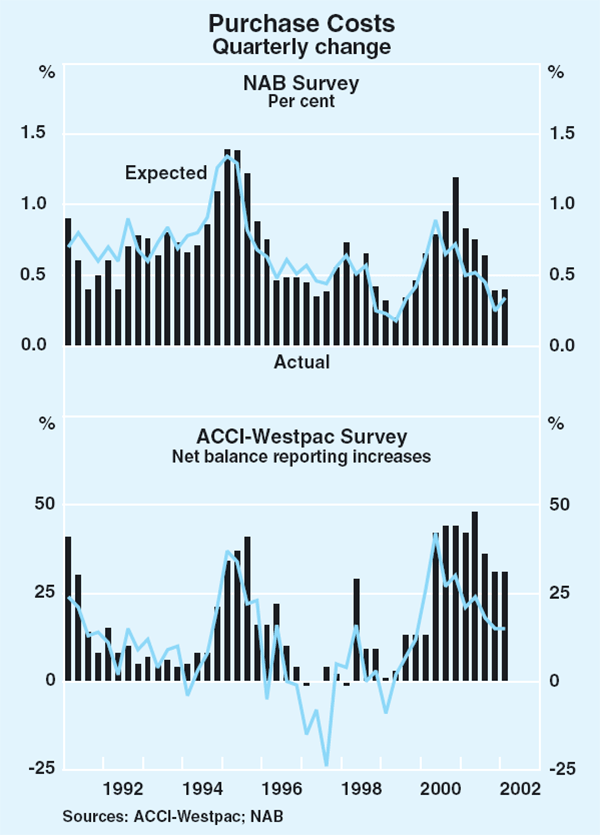
Labour costs
Most measures of wage pressure remain contained reflecting the subdued conditions in the labour market throughout 2001 (Graph 65). The Wage Cost Index rose by 3.4 per cent over the year to the December quarter. At the industry level, the fastest wage growth continues to be in the education (4.4 per cent) and finance and insurance (4.2 per cent) industries, while the retail sector again recorded the slowest growth (2.4 per cent).
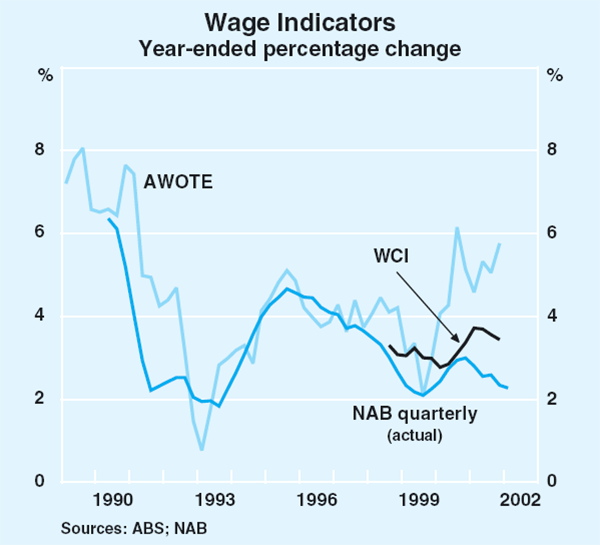
Data from the Department of Employment and Workplace Relations database on enterprise bargaining agreements also indicate modest wage pressures. New federal enterprise agreements ratified in the December quarter provided an average annualised wage increase of 3.8 per cent, the same as in the previous quarter. However, the average annualised wage increase of renegotiated private sector agreements in December was 4.2 per cent, 0.5 percentage points higher than for the agreements that they replaced. Wage increases under existing agreements have edged up over the past year or so, but remain at 3.7 per cent.
According to the latest Mercer Quarterly Salary Review, the base salary of executives increased by 4.6 per cent over the year to March, which is down slightly from the pace of around 4¾ to 5 per cent reported in the previous couple of quarters. Salaries of all office-based workers increased by 4.0 per cent over the year to March.
Wage bill measures have been running somewhat faster than the wage rate measures, partly reflecting compositional factors such as shifts in the share of low- and high-paid workers. Average weekly ordinary-time earnings of full-time adults (AWOTE), grew by 1.2 per cent in the December quarter to be 5.8 per cent higher over the year. Similarly average hourly earnings based on national accounts data rose by 1.1 per cent in the December quarter to be 5.5 per cent higher over the year. However, strong growth in labour productivity has meant that unit labour costs fell over much of 2001.
Firms continue to report little difficulty attracting suitable labour, according to the NAB and ACCI-Westpac surveys. Growth in total labour costs reported in the NAB survey was also subdued in the March quarter, with firms expecting this to continue in the June quarter.
The Australian Industrial Relations Commission (AIRC) is currently hearing the 2002 Safety Net Review of award wages. The AIRC is considering an application by the Australian Council of Trade Unions (ACTU) to increase all award rates of pay by $25 per week. The Federal Government is arguing for a $10 per week pay increase for low-paid award workers. Last year, the AIRC granted between $13 and $17 per week across the award scale. A decision is expected in the coming weeks.
Inflation expectations
According to the Melbourne Institute survey, inflation expectations of consumers have remained in a range between 3½ and 4½ per cent since mid 2000, though expectations for the year ahead rose to 4.5 per cent in April, from around 4 per cent earlier in the year (Graph 66). Business surveys provide mixed readings on inflationary pressures. The economy-wide NAB survey suggests that businesses' inflation expectations are currently well contained, with inflation in final product prices expected to be 0.4 per cent in the June quarter, and 0.5 per cent for retail price inflation. In contrast, the Dun & Bradstreet survey, which covers the manufacturing, wholesale and retail sectors, indicates that the proportion of firms expecting prices rises in the next three months has increased significantly since December.
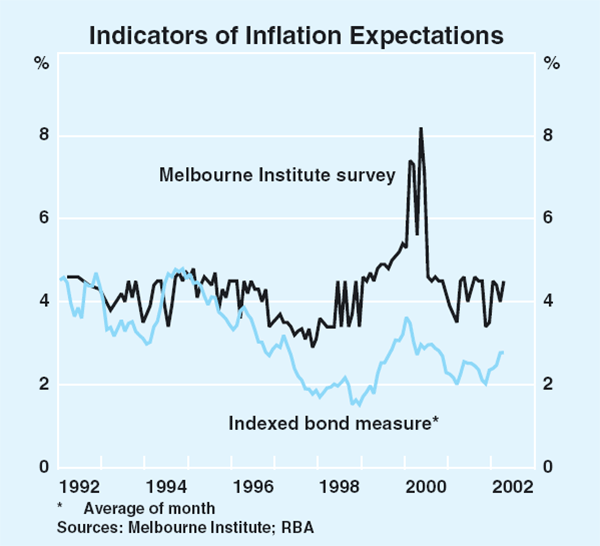
Longer-term inflation expectations of investors, measured by the difference between 10-year bond yields and indexed bonds, have moved slightly higher in recent months to average around 2½ per cent in the March quarter. Financial-market economists surveyed by the Bank have revised upwards their forecasts for inflation following the release of the March quarter CPI data. The median inflation forecasts for the years to June 2002 and June 2003 are 2.8 and 2.5 per cent respectively (Table 19). In contrast, trade union officials, as surveyed by the Australian Centre for Industrial Relations Research and Training (ACIRRT), revised their expectations for inflation down slightly this quarter, although they remain a little higher than financial market expectations.
| Year to June 2002 | Year to June 2003 | ||||||
|---|---|---|---|---|---|---|---|
| November 2001 | February 2002 | May 2002 | November 2001 | February 2002 | May 2002 | ||
| Market economists(a) | 2.0 | 2.4 | 2.8 | 2.2 | 2.4 | 2.5 | |
| Union officials(b) | 2.9 | 3.2 | 3.1 | 3.1 | 3.7 | 3.4 | |
|
(a) RBA survey (b) ACIRRT survey |
|||||||
Inflation outlook
Consistent with the forecasts presented in the February Statement, CPI and underlying inflation were just under 3 per cent in the March quarter, slightly lower in year-ended terms than in the December quarter. As in the February Statement, the Bank's assessment is that underlying inflation is likely to ease gradually to around 2½ per cent by the end of 2002. This reflects the fact that wage and labour costs remain contained as a result of the subdued labour market conditions in 2001, and that price pressures stemming from the exchange rate depreciation in recent years should lessen.
However, this is likely to be the trough in inflation. The recent labour force data suggest that stronger domestic activity has started to flow through to labour demand: employment growth has accelerated and the unemployment rate has fallen. With output and employment growth expected to remain firm over the remainder of this year, capacity constraints are likely to emerge and exert upward pressure on wages and prices.
Upstream price pressures are currently well contained, due to earlier falls in oil prices and import prices over the past year. However, cost pressures arising from higher insurance premiums and increased electricity and gas costs may increase pressure on business margins. Moreover, the rise in oil prices in recent months will also place some pressure on business margins as well as directly boosting CPI inflation in the coming quarters.
Against this, there is unlikely to be any significant impetus to inflation from import prices in the foreseeable future, assuming, as always, that the exchange remains at recent levels. The appreciation of the exchange rate in recent months should act to offset any remaining inflationary pressure from the earlier depreciation and may have some disinflationary impact. While the downward pressure on world prices is likely to dissipate somewhat with the recovery in world demand, this is unlikely to be sufficiently rapid to create significant inflationary pressure.
Consequently the Bank's assessment is that underlying inflation is likely to ease to around 2½ per cent by the end of 2002, but will subsequently be under gradual upward pressure, reaching the top of the target by around the end of 2003. The rise in oil prices, if sustained, will result in higher CPI inflation outcomes than this in the near term.
Risks to this assessment can be identified in both directions. Downside risks to the world economy still remain, and if realised, would be likely to result in lower growth in domestic output and weaker labour market outcomes, leading to less inflationary risk from a pick-up in wages growth and reduced scope for price increases. In such circumstances, downward pressure on world prices would continue, leading to further moderation in import prices. A further downside risk to the inflation outlook would arise if the exchange rate continues to appreciate, increasing the disinflationary impulse from imported inflation.
On the other hand, there is a risk that the recent turnaround in the labour market will lead to stronger wage inflation than currently allowed for, or that the pick-up in wage inflation will emerge sooner than expected. In addition, economic growth may be stronger than anticipated, allowing firms to build margins and exhausting the excess capacity in the economy more quickly. A further risk is that the rise in oil prices, combined with the recent higher quarterly CPI outcomes may lead to a ratcheting up of inflation expectations and, in turn, inflation. Such outcomes would result in inflation rising above the target sooner than anticipated.
Box D: Underlying Inflation
Although Australia's inflation target is expressed in terms of the Consumer Price Index (CPI), it can be useful when assessing inflationary trends to focus on underlying measures which abstract from short-run volatility.
The CPI is often affected by movements in the prices of component items such as fruit, vegetables and petrol that reflect fluctuations in supply conditions and generally do not persist for more than a quarter or two. For example, in the December quarter 2001 a 10 per cent increase in the price of fruit and vegetables contributed around ¼ of a percentage point to CPI inflation, but these prices then fell slightly in the March quarter. Adjustments to government charges and taxes can also sometimes have large ‘once-off’ effects on the level of prices which do not lead to a persistent rise in the rate of inflation.
There are two common ways of obtaining a measure of underlying inflation. One approach is to exclude nominated items from the CPI basket (the exclusion approach). Typically, the excluded items are those that are volatile and/or display pronounced seasonal patterns, and those that are subject to administrative price setting. An alternative approach is to exclude all extreme individual price movements, from whatever source (the statistical approach). While statistical and exclusion measures can move differently from quarter to quarter, they tend to follow similar trends to the CPI in the medium term (Graph D1).
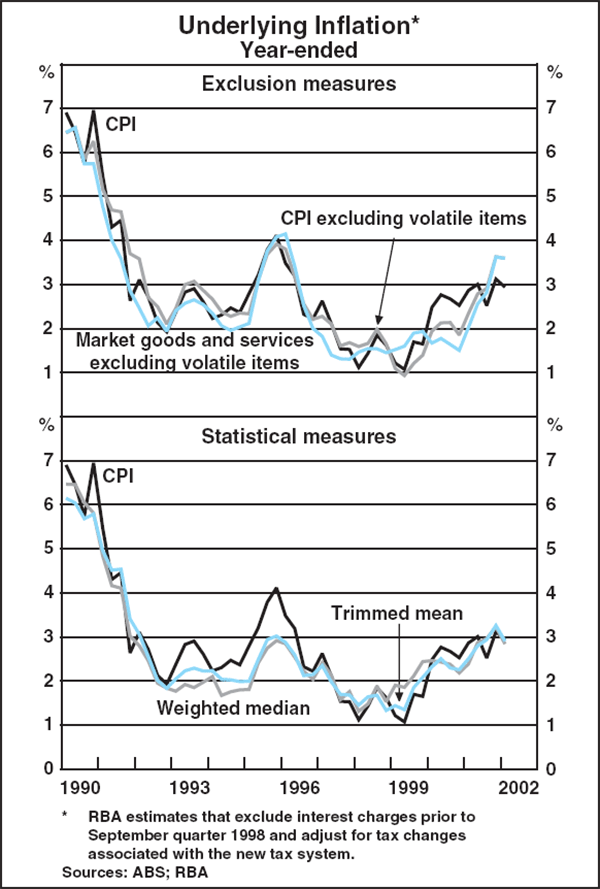
Exclusion measures
Two widely-used exclusion measures are the ‘CPI excluding volatile items’ and ‘market goods and services excluding volatile items’, both of which are published by the ABS in the quarterly CPI release.
The CPI excluding volatile items measure excludes the prices of items that are particularly volatile (fruit, vegetables and automotive fuel), retaining just over 90 per cent of the CPI basket. The market goods and services excluding volatile items measure focuses on prices determined in the market sector of the economy and covers around 80 per cent of the CPI basket. In addition to the volatile items noted above, the market goods and services excluding volatile items measure excludes prices for goods and services that are to a significant extent provided by the public sector, such as urban transport fares, health service fees, and state and local government rates and charges.
These exclusion measures should be treated with some caution for a couple of reasons. First, they can still be affected by temporary movements in the prices of items that are not excluded. For example, over the past year the rise in the prices of overseas travel and meat has been unusually large by historical standards, boosting these measures by around ½ per cent. Second, the decision about which components to remove is somewhat arbitrary. By excluding specific components all the time, all information contained in those components – including that reflecting genuine underlying forces – is lost.
Statistical measures
In recent years there has been considerable research into statistical measures of underlying inflation. Two such measures calculated by the Bank are the ‘trimmed mean’ and the ‘weighted median’.[1] In contrast to exclusion measures, statistical measures utilise all components of the CPI in their calculation.
Each quarter, the CPI components, and their weights in the CPI, are ranked by the size of their price movement in the quarter. The trimmed mean is calculated as the weighted mean of the central 70 per cent of the quarterly price change distribution of all CPI components; that is, the top and bottom 15 per cent of the distribution are trimmed. In practice many of the ‘volatile’ items removed from the exclusion measures considered above will often be excluded from this measure too. However, the trimmed mean excludes extreme movements in any item, while small movements in usually volatile items will remain in the calculation. The weighted median is the inflation rate for that item which is in the middle of the total distribution of price changes; that is, it trims away all but the midpoint of the distribution so that half the component weights are on one side of the median, and half on the other.
Statistical measures also have their shortcomings. One of the most important is that they are harder to interpret than exclusion measures. It is not always clear what information is being preserved and what is being excluded in a statistical measure, whereas this is unambiguous in the case of an exclusion measure.
Conclusion
Although the Bank targets CPI inflation, quarter-to-quarter volatility in the series (in particular ‘once-off’ price movements in specific components) means that it is useful to look at measures of the underlying trend in inflation. There is, however, no single, unambiguously precise measure of underlying inflation. In practice, the Bank's approach is to monitor a variety of measures and, while remaining aware of their individual strengths and weaknesses, take all of these into account when trying to gauge the underlying trend in consumer prices. Currently, the Bank's judgement is that underlying inflation is around the same as CPI inflation at just under 3 per cent.
Footnote Box B
These figures cover life offices, superannuation funds and unit trusts. About half the increase was due to flows of new investments, and the rest due to valuation changes arising from movements in the exchange rate and share prices. [1]
Footnotes Box D
Both are reported on the Bank's website at <http://www.rba.gov.au/inflation/measures-cpi.html> and are listed shortly after the release of the CPI each quarter. For more information about the properties of statistical underlying inflation measures, see Kearns (1998), ‘The Distribution and Measurement of Inflation’, Reserve Bank of Australia Research Discussion Paper No 9810 (available at <http://www.rba.gov.au/publications/rdp/1998/9810.html>). [2]