Reserve Bank Bulletin – February 1999 The Economy and Financial Markets
Introduction
The growth performance of the Australian economy exceeded most expectations in 1998. In a year in which growth in the world economy halved, and in which the economies of many of Australia's trading partners experienced large outright contractions, Australia's GDP grew, according to the latest data, at above its trend rate.
It was not possible, however, to avoid altogether the effects of the weaker regional and global environment. Despite some success in finding new markets, Australia's export volumes are well down on their level in mid 1997, and the terms of trade have declined. Both these factors have contributed to a widening of the current account deficit. Domestic expenditure, however, rose at such a pace that the economy recorded strong GDP growth. This has resulted in a further decline in unused capacity in the economy, and a fall in the rate of unemployment.
At the time of the Semi-Annual Statement on Monetary Policy in November, the Bank's expectation was that signs of a decline in growth, of which there were few at that time, would begin to emerge before long. Three months later, such signs are still relatively few. If anything, the bulk of recent information suggests a continuation of quite robust growth, and a resurgence in business and household confidence towards the end of 1998.
Internationally, the main feature over recent months has been the exceptional strength of the US economy. Despite the clear weakness in the manufacturing sector, the US economy overall continues to grow at an above-trend rate. Concerns over the possibility of an imminent credit squeeze and resulting economic downturn in the US, which dominated world financial markets generally in the third quarter of 1998, have receded since late last year. Since October, world share markets have rallied, currency and bond markets have generally become less volatile, and liquidity in developed countries' financial markets has improved, all aided by further easings of monetary policy in a number of countries. A new major currency, the euro, was also launched successfully in the wholesale foreign exchange market, replacing ten European currencies. Some elements of vulnerability remain, particularly in Brazil where pressures came to a head in mid January, forcing the authorities to float the exchange rate and tighten monetary policy as the currency depreciated.
Outside the United States, however, economic conditions generally are weak. Progress in re-starting growth in Japan is slow, and growth in parts of Europe appeared to weaken a little in the second half of 1998. In east Asia, economic activity in most of the countries worst affected by the currency and banking crises has stopped falling. The emergence of growth in this region is more likely than further contraction in the year ahead, but the assumption must still be that this will be rather tentative. Economic activity in Latin America is at risk of a sharp decline, resulting from the pressure exerted on Brazil by capital flight, and the flow-on effects of this to neighbouring countries. Most forecasts of global growth see little if any acceleration in 1999 at this stage. On this basis, a fairly difficult external environment for Australia must be assumed, with some resultant decline in Australia's growth the likely outcome. As noted above, however, this result appears to be occurring rather later than formerly thought.
Inflation remains lower than forecast. For some time, the Bank has expected that the combination of a strongly growing economy and a depreciating exchange rate would lead to some pick-up in the rate of inflation. These impulses usually take some time to flow through to the consumer, but the rise in wholesale import prices already observed suggested that such effects should have been expected towards the end of 1998 and into 1999. As was noted in the November Statement, however, there was always a possibility that, in the current circumstances, historical experience might not be an accurate guide to outcomes over the coming year. The most recent price data suggest that this is the case, with overall inflation remaining well below 2 per cent over the latest 12-month period.
A key question is whether such a situation is likely to be persistent or temporary. The breakdown in the normal relationship between the change in the exchange rate, wholesale import prices and consumer import prices suggests that profitability of wholesalers or retailers or both has declined. It raises the question of whether such a decline could be permanent, or whether the margins will soon be partly or wholly restored with consequent effects on the final prices for imported goods. While it is possible that there will be no move towards the restoration of margins, and hence no effect on final goods prices, this seems an unlikely outcome for a depreciation that has been as long-lasting as the current one. In the Bank's view, it is more likely to be a case of delay, with some effects on final prices coming through over the next 12 months. Even if the issue of the pass-through of the depreciation into final prices were to be resolved, there is still the equally difficult task of forecasting the underlying world rate of inflation. Over the past year or so, most countries have experienced very low inflation, in many instances well below earlier forecasts. It is unlikely that the current rate of inflation among industrial countries of around 1 per cent will fall further in the year ahead, but it is possible.
On balance, the outlook over the next year or so at this stage is for inflation to remain quite low. The Bank expects underlying inflation to increase gradually, on the assumption that there will be some effect due to higher import prices. Our present forecast is that it will reach 2 per cent by the end of 1999. Inflation as recorded by the CPI is likely to remain noticeably below 2 per cent, as the effect of the implementation of the Government's health insurance rebate will be to reduce the CPI. For the purposes of evaluating inflation relative to the target, the Bank will ‘look through’ that effect, just as it would ordinarily abstract from other one-time movements in prices resulting from government policy initiatives. In this regard, it is worth recording that the Bank intends to treat similarly the direct impact on the CPI of the proposed GST.
The conjuncture of unexpectedly good growth driven by strong domestic demand, albeit still with some expectation of a slowing in the year ahead, and lower-than-expected inflation, is unusual and makes for a slightly more complex decision process for monetary policy than is normally the case. There is a clear case for monetary policy to be relatively easy, and policy has maintained an expansionary stance over the past year and a half, as the international environment has turned unfavourable for Australia. Late in 1998, as the balance of risks appeared to be moving in the direction of greater international weakness, policy eased a little further, with the cash rate falling by 25 basis points to 4.75 per cent. This was followed by a fall in the exchange rate, which reached a low of US60.8 cents late in December, before rising on the back of stronger economic data and a firming in some commodity prices, which reduced market expectations of further easing.
The Bank's judgment is that the current stance of policy remains appropriate for the likely state of the economy over the coming year though, as always, policy will be continually reviewed in the light of incoming information. The period during which inflation has been below the 2–3 per cent target has proved to be longer than had been expected, but it is important to emphasise that the target is a medium-term one. It is designed to avoid the potential which would exist for instability in both the real economy and the financial sector were monetary policy to attempt to fine-tune the short-run path of prices. In the period ahead, the current policy setting will, in the Bank's view, provide support to growth and result in a limited and gradual drift upward in inflation to rates consistent with the target.
International Financial Markets
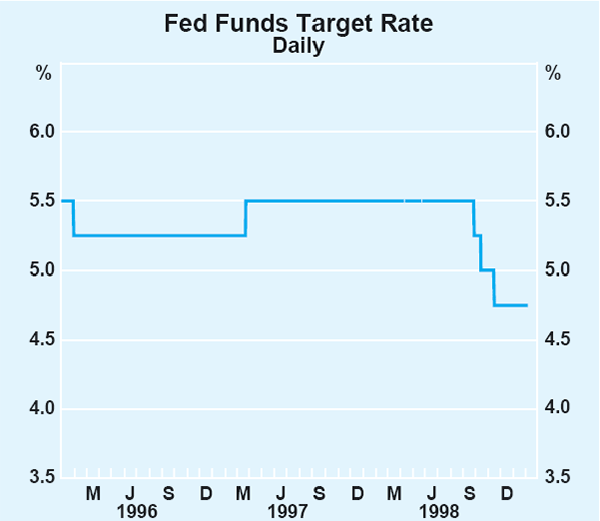
As explained in the November Semi-Annual Statement on Monetary Policy, conditions in world financial markets, including in the United States, deteriorated sharply in the third quarter of 1998 after the Russian government defaulted on its debt in August, substantially raising the risk premium on emerging market debt. In response to this market disorder, and to limit its effects on the US economy, the Federal Reserve reduced the Fed funds rate from 5.5 per cent to 4.75 per cent in three cuts of 0.25 percentage points on 29 September, 15 October and 17 November (Graph 1). As markets settled, the Fed shifted its monetary policy bias in November from easing to neutral.
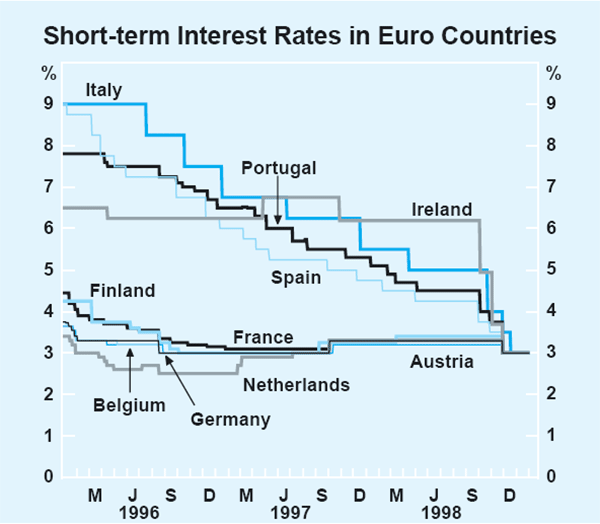
Most other central banks in industrial countries also cut interest rates towards the end of 1998. In Europe, the downward movement was reinforced by the short-term interest rate convergence for Stage Three of European economic and monetary union on 1 January. Through the last quarter, countries with above-average rates moved down towards those of Germany and others at the bottom of the range, and late in the quarter all countries cut rates (Graph 2). The market had expected interest rates to converge at 3.3 per cent, and the surprise 0.3 per cent cut in core European rates was directed at supporting economic activity and financial markets in the face of recent financial turbulence. Denmark, Sweden, Norway, the United Kingdom and Canada also cut their benchmark interest rates in the past few months.
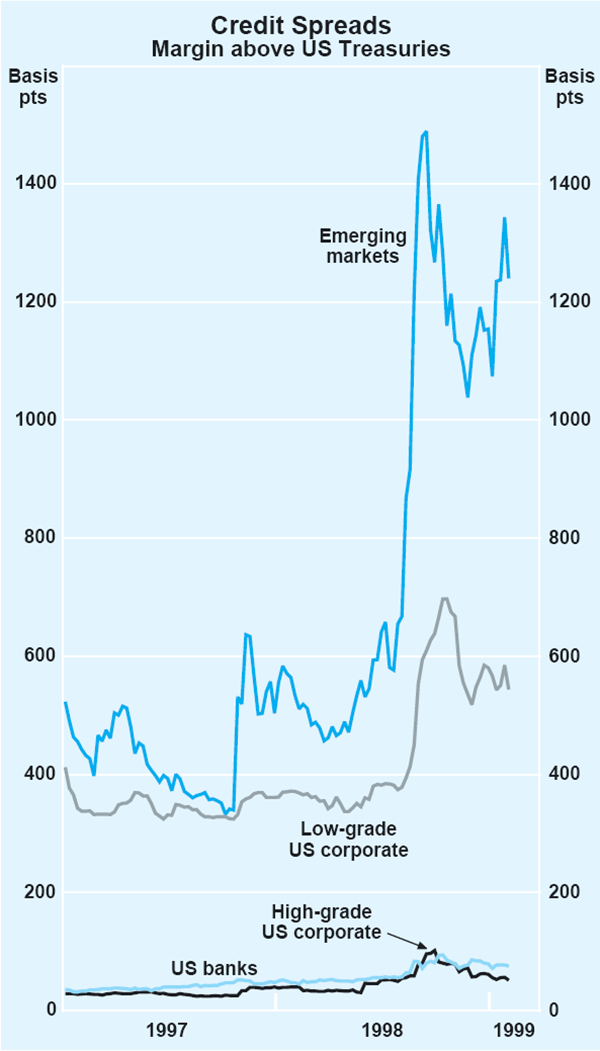
The easings of monetary policy in the United States and elsewhere were effective in stopping the deterioration in market conditions, which had been evident in the large widening in credit spreads (Graph 3). Liquidity has been returning to markets, albeit gradually, and volatility in most debt markets has declined. European bond markets quietened considerably ahead of conversion to the euro on 1 January.
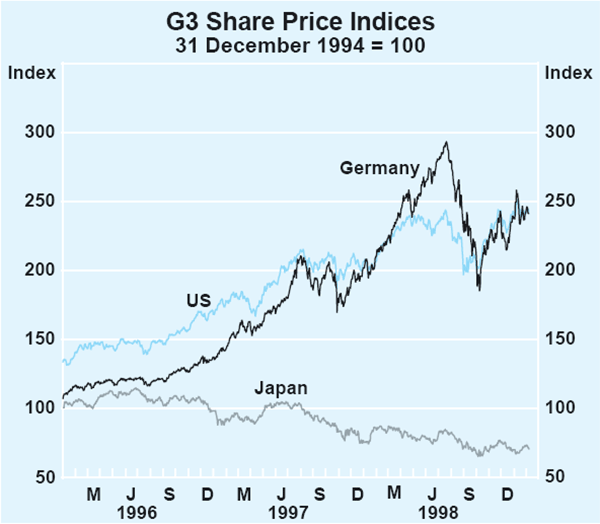
The US share market rallied strongly, reaching new records in response to the easier monetary policy and to signs that economic activity was remaining stronger than earlier expected (Graph 4). Following the US lead, share markets in most other developed countries also rose. The devaluation and subsequent float of the Brazilian real in mid January and associated concerns about US and European bank exposures to Latin America had only a temporarily negative impact on share markets around the world.
Bond and share markets in Japan did not follow the trends in the other major markets. Japanese bonds have become particularly volatile in recent months, with yields on the 10-year benchmark bond jumping from an historic low of 0.68 per cent in mid September to over 2 per cent in early February, levels last seen in July 1997. The catalysts for this sharp correction were the downgrading of Japan's credit rating and a general concern about the ability of the market to digest substantially larger bond issues to finance budget deficits of close to 10 per cent of GDP in coming years. The Japanese share market initially rallied throughout October and November, albeit to a lesser extent than other world share markets, but lost these gains in December over concerns about the domestic economy.
Foreign exchange markets have also stabilised after the unprecedented movements in the US dollar-yen exchange rate in early October. The new European currency, the euro, which replaced ten European currencies, was introduced on 1 January without incident. The rates at which member countries' currencies were to be converted to the euro were announced on 31 December, taking effect from 1 January (Table 1).
| Germany | 1 euro = 1.95583 marks |
|---|---|
| France | 1 euro = 6.55957 francs |
| Italy | 1 euro = 1936.27 lire |
| Spain | 1 euro = 166.386 pesetas |
| The Netherlands | 1 euro = 2.20371 guilders |
| Belgium and
Luxembourg |
1 euro = 40.3399 francs |
| Austria | 1 euro = 13.7603 schillings |
| Finland | 1 euro = 5.94573 markkaa |
| Portugal | 1 euro = 200.482 escudos |
| Ireland | 1 euro = 0.787564 pounds |
The euro started trading at the value of one euro to US$1.174 and, while it initially appreciated, it has since weakened slightly to trade around US$1.13. The yen was more stable than in early October, and appreciated further in December and January in response to lower US interest rates and Japan's continuing trade surplus.
Developments in emerging markets have been much more mixed over the past few months, with Brazil remaining the main focus.
On 13 November, the IMF announced that it had reached agreement with Brazil on a US$41.5 billion restructuring package, requiring Brazil to move quickly from budget deficits to surpluses. The package differed from other recent IMF packages in that it aimed to prevent a crisis from developing, rather than responding to a crisis which had already occurred with, consequently, substantial funds available up front. Conditionality was also more finely honed to the problem at hand: fiscal imbalance.
In the lead up to, and immediately following, this package, capital outflows slowed, but they accelerated in January after Brazil's third most economically important state, Minas Gerais, announced that it would suspend debt payments to the federal government for three months, raising doubts about the ability of Brazil to meet its fiscal austerity plan. With foreign reserves around US$40 billion, net outflows in excess of US$1 billion a day were unsustainable and, on 13 January, the Brazilian central bank widened the trading band for the real against the US dollar, effectively devaluing the currency by 9 per cent. Market participants regarded this as inadequate, and outflows continued, leading the authorities to float the real on 15 January. In net terms, the real has now depreciated by almost 35 per cent against the US dollar since early January.
Share prices in Brazil and elsewhere in Latin America fell substantially at first, but then rallied strongly following the float, even though interest rates have risen further in Brazil as the central bank tightened monetary policy to support the currency. Risk premiums also rose immediately in Latin America, although not, for the most part, in other emerging markets (Graph 5). On the whole, markets in east Asia have not been much affected by the Brazilian crisis. The impact on Russia was greater, where economic fundamentals and financial prices had been continuing to weaken and the government had defaulted on additional debt in December.
The direct effect of the Brazilian turmoil on east Asia was limited since economic fundamentals in most of emerging east Asia have firmed in recent months, capital flight had already taken place in 1997 and early 1998, and current accounts are strongly in surplus. Markets in Korea have been doing particularly well, with share prices and the won rising by 37 and 12 per cent respectively from the end of October to early February. In recent months, Asian interest rates have continued to fall.
Australian Financial Markets
Market interest rates
Late in 1998, expectations about monetary policy dominated activity in local money and capital markets. Short-term market yields in Australia had been consistent with some expectation of an easing in monetary policy in Australia since around the time that the Federal Reserve eased interest rates in the United States in September 1998; at that time, yields in local short-term markets moved somewhat below the then cash rate target of 5 per cent (Graph 6). When the Bank announced its easing of monetary policy in December, the yield on 90-day bills moved to around the new level of the cash rate of 4.75 per cent; and yields in futures trading priced in expectations of a further reduction in the cash rate by mid 1999. Longer-term interest rates also moved lower on the announced easing, the yield on 10-year bonds moving to a low of 4.72 per cent by mid December, a level which could only be sustained if short-term rates were to fall further. At this rate, bond yields in Australia were at their lowest since July 1964.
By January, however, as evidence came to hand of continuing robust economic growth in the US and Australian economies, the earlier expectations of further reductions in short-term interest rates were reversed. By late January, yields on 90-day bank bills and in futures trading were around 4.75 per cent – i.e. consistent with the current cash rate – while the yield on 10-year bonds rose to 5.25 per cent (Graph 7). Notwithstanding these reversals, money and capital market rates in Australia remain very low by historical standards, as does the structure of intermediaries' interest rates (see below).
The rise in bond yields in Australia in recent months was more than in the United States, so that the spread to US Treasuries moved up to about 35 basis points by late January. The fact that Australia has continued to grow more quickly than most other industrial countries was reflected in widening spreads on bond yields with these countries (Table 2), especially with expectations of further easing in monetary policy in the euro area, the United Kingdom and Canada. The exception to this trend was Japan, where bond yields rose very strongly, from their historical lows.
| End Nov | Early Feb | Movement | |
|---|---|---|---|
| United States | 20 | 35 | 15 |
| Japan | 400 | 290 | −110 |
| Germany | 105 | 155 | 50 |
| United Kingdom | 30 | 105 | 75 |
| Canada | −5 | 20 | 25 |
| New Zealand | −55 | −35 | 20 |
| (a) Yield in Australia minus yield in country shown. | |||
Over recent months the Australian share market rose strongly, although not as much as the US market. The market reached a new high in early February, about 18 per cent above its low point at the time of world financial market disturbance around September. The market was buoyed by strong domestic economic data and the reduction in interest rates in early December. As has been the case for some time in Australia, banks and large industrial stocks showed the biggest rises in price, while resource stocks fell further in response to lower commodity prices globally.
The Australian dollar
From its historic lows of about US55 cents in August, the Australian dollar rose to a high of US64.5 cents in mid November. This was driven by the unwinding of short positions by hedge funds who were forced to cut back on their risk-taking after the losses they incurred in Russia and elsewhere over August/September. Thereafter, the exchange rate started to fall again as expectations of a monetary policy easing grew in late November, and it continued to decline following the easing in early December. By year's end, the dollar had fallen by about 6 per cent from its November high, to US60.8 cents. Subsequently, the strengthening in US economic data and in some commodity prices, together with solid Australian data, saw the Australian dollar recover (Graph 8). Foreign buyers were noted in particular as they rebuilt their Australian dollar investments, and by early February the exchange rate had risen to around US65 cents. The trade-weighted index has also risen, although a little less strongly than the rate against the US dollar.
International Economic Developments
United States
The US economy has continued to record an exceptionally good combination of strong growth and low inflation. The current economic expansion is the longest since the 1960s, and its strength has for some time exceeded the expectations of most observers. Real GDP grew by 4.1 per cent over 1998, with the pace of growth increasing further in the fourth quarter (Graph 9). The strength of the US economy has been driven by robust domestic demand, which has more than offset the effects of weaker external conditions on export and import-competing industries.
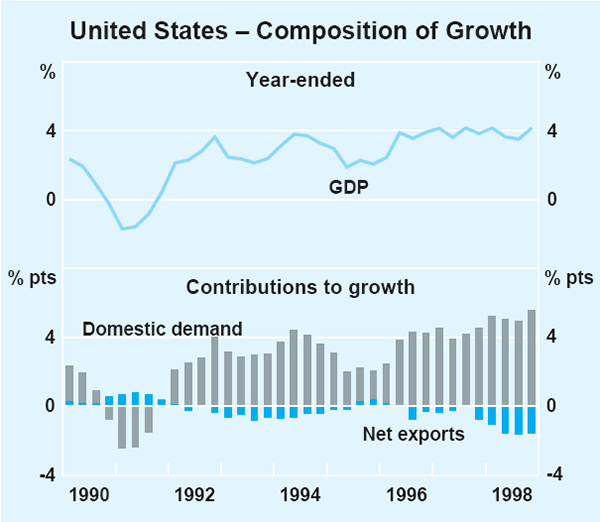
Despite some job losses in the manufacturing sector, the labour market overall remained supportive of income growth: employment grew by 2¼ per cent over the year to December, and real wages by 1½ per cent. Spending has also been supported by the low level of interest rates and by sharp increases in financial wealth associated with rising asset prices. Reflecting these developments, conventional measures of household saving have declined to historically low levels. The low levels of saving, and the apparent role that share market growth has played in stimulating demand to date, may point to a source of risk in the outlook for consumer spending in the period ahead. At this stage, however, surveys suggest that consumers remain very optimistic.
Weaker external demand has had its most noticeable impact on the manufacturing sector, where growth in industrial production slowed to an annual rate of around 2 per cent in the December quarter. Nonetheless, growth in the economy overall is being supported by the recent reductions in interest rates, which also appear to have dispelled earlier concerns of an emerging credit squeeze. The combination of weak external and strong domestic demand has seen the US current account deficit widen. It was equivalent to around 3 per cent of GDP in the September quarter.
Despite the duration and strength of the current expansion, and the tightness of the labour market, US inflation remains subdued. The increase in the price of goods has slowed considerably over the past two years, in part due to increased competition in the tradeable sector, the higher exchange rate for much of the past year, and lower commodity prices. Prices in the more domestically oriented services sector are rising more quickly, but still by less than 3 per cent. Considering the strength of the US expansion over recent years, the inflation rate is remarkably low at around 1½ per cent.
Europe
The core economies of the euro area expanded moderately during 1998 but may have lost some momentum towards the end of the year. Weak external demand is constraining activity in Germany and France. This has been most apparent in the manufacturing sectors of these countries, where production growth has slowed considerably. In Germany, there are signs that part of this slowing also reflects a weakening of domestic demand: domestic manufacturing orders have fallen by 6 per cent since their peak in mid 1998. Domestic demand in France is faring better, although business confidence is faltering in both countries. Some other continental European countries are growing more strongly, possibly reflecting the expansionary effects of reducing their interest rates to French and German levels in preparation for the introduction of the single currency.
The UK economy is in quite a different cyclical position from continental Europe, with growth slowing substantially over the past year after a number of years of strong economic expansion. The decline in growth reflects a slowing in external demand and, until relatively recently, tight monetary conditions. Responding to the easing in demand and weaker inflationary pressures, the Bank of England has progressively reduced short-term interest rates since October by 200 basis points, to 5½ per cent.
With moderate growth and falls in oil and other commodity prices, inflation in the euro area remains low, at around 1 per cent. Inflation in the United Kingdom has been close to its target of 2½ per cent.
Japan
The Japanese economy is showing few signs of recovery from recession as yet. Output has declined by almost 5 per cent over the past year and a half, with private final demand particularly weak (Table 3). Consumer confidence has continued to deteriorate in recent months, fuelled by rising rates of unemployment, and tax cuts have so far been unsuccessful in generating a recovery in consumer spending. Businesses also remain very pessimistic. The Tankan survey for the December quarter reports that business sentiment, capacity utilisation, and businesses' assessments of their financial positions, were all at very low levels. These conditions have been reflected in declining capital spending.
| Dec 1997 | Mar 1998 | June 1998 | Sep 1998 | |
|---|---|---|---|---|
| GDP | −0.9 | −1.2 | −0.7 | −0.7 |
| Final demand | −1.3 | −0.9 | −1.1 | −0.8 |
| Private | −0.9 | −0.8 | −0.8 | −1.2 |
| Public | −0.4 | −0.1 | −0.2 | 0.4 |
| Change in stocks | −0.1 | 0.2 | −0.1 | −0.1 |
| Net exports | 0.4 | −0.3 | 0.4 | 0.3 |
| Exports | 0.2 | −0.4 | −0.3 | 0.2 |
| Imports(a) | 0.2 | 0.1 | 0.7 | 0.0 |
| (a) Positive indicates a fall in imports. | ||||
Japan's export performance has also deteriorated over the past year. Trade with other Asian economies (which accounts for almost half of Japanese exports) has been adversely affected by the Asian crisis and by the net appreciation of the yen against most other Asian currencies. Japan's exports to Asia declined by around 15 per cent in volume terms over the year to December. Exports to the US and Europe have fared better, in part due to the depreciation of the yen against those currencies for most of 1998. However, the recent rebound in the exchange rate, if sustained, will make it more difficult for Japan to export to those markets. Despite the overall weakening in exports, Japan's trade surplus has widened significantly, with the weakness in domestic demand resulting in substantial declines in imports.
Efforts to stimulate the economy through monetary and fiscal policies have continued. The Bank of Japan has allowed its overnight call rate to stay at just ¼ of a percentage point, and has continued to supply the system with liquidity. But low interest rates alone appear to have been less effective than normal in stimulating demand, given the degree of caution on the part of borrowers and lenders. In addition, deflation has contributed to a higher level of real interest rates despite the historical lows in nominal rates. The effect of the fiscal stimulus packages announced earlier in 1998 began to show up in the September quarter with a positive contribution to growth from public demand. Further public spending increases should follow, but it is not yet clear whether the overall fiscal stimulus will be enough to generate a more broadly based recovery in private incomes and spending.
A sustainable recovery will also depend importantly on a resolution of Japan's financial sector problems. Finding political consensus on the appropriate policy response has proved difficult, but some progress has been made over the past few months, and the process appears to be accelerating. The government has now nationalised two large banks, and has taken applications from most city banks for an injection of public funds. At this stage, however, only a small proportion of the funds set aside by the government for this purpose has been used.
East Asia
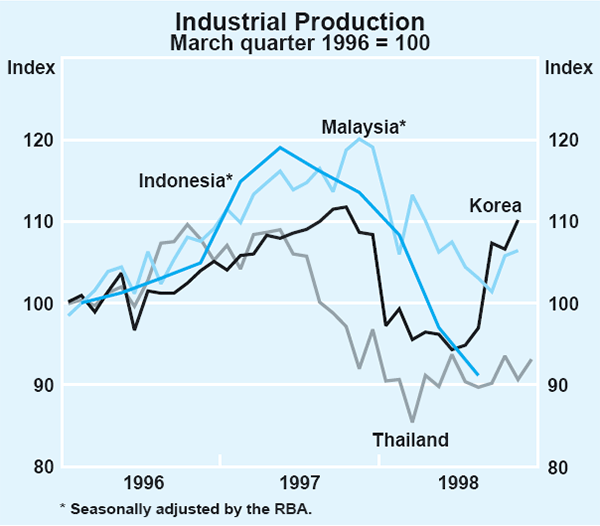
With the exception of Indonesia, the initial crisis economies of east Asia showed some signs of stabilising during the second half of 1998, with industrial production in Korea picking up strongly according to the official data (Graph 10). Prospects for growth are being assisted by the reductions in interest rates that have taken place over the past half year, and, more recently, by the adoption of more expansionary fiscal policies. In Korea, export revenues continued to show little growth in US dollar terms. Over the past year, the available data suggest that this reflects some volume growth offset by reductions in US dollar prices of their exports. Depreciation of the won has allowed Korean export prices to increase strongly in domestic currency terms, which will assist the profitability of their export industries. To date, Thailand and Indonesia have had less success in boosting exports, with Indonesia, in particular, suffering badly from trade financing problems.
Domestic demand remains weak across the initial crisis economies, with rising unemployment and reduced asset values constraining consumption expenditure. More fundamentally, and notwithstanding some important progress, much remains to be done in the restructuring and strengthening of the financial and corporate sectors of all these economies.
Elsewhere in east Asia, there is a clear contrast between the continued growth in China and Taiwan, albeit at a reduced pace, and the deep recessions being experienced in Hong Kong and Singapore. The Chinese economy recorded GDP growth of 7.8 per cent in 1998, the fastest in the region but down from an average of 9 per cent in the previous two years. The bankruptcy of Guangdong International Trust and Investment Corporation (GITIC) announced in January has highlighted concerns about other financial companies in China, although the financial sector was already known to be in difficulty. In Taiwan, the pace of growth over 1998 declined to around 4 per cent, down from an average of 7 per cent over the previous two years, but appears to have strengthened in the second half of the year. Meanwhile, both Hong Kong and Singapore recorded declining output.
World growth, trade and inflation
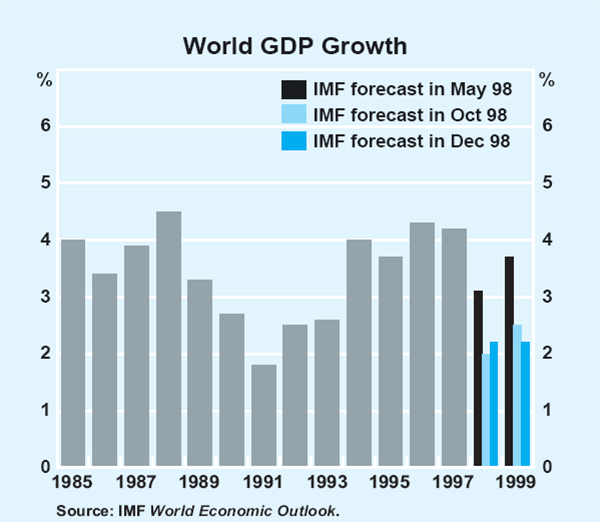
Recessions across most of east Asia and Japan reduced world output growth in 1998 to an estimated 2¼ per cent from around 4 per cent in 1997, representing a marked departure from the forecasts made by the IMF and other forecasters at the end of 1997 or even as recently as May 1998 (Graph 11). The scale of revisions to forecasts seen over the past year reflects the unanticipated spread of the financial turmoil from the initial crisis economies to the rest of east Asia, to emerging markets more generally and, for a time, to the financial markets of the industrial countries. The IMF's latest published forecast for world growth in 1999 is 2¼ per cent. The composition of that growth is expected to be slightly different from that in 1998, potentially to the advantage of Australian exporters, as Asia is expected to contribute more to growth. These forecasts pre-date the recent strong indicators for the US economy, and may therefore understate the continuing momentum of growth in the US.
The forecasts also pre-date the events in Brazil in mid January, which must be viewed as an additional source of uncertainty for the world economy. Brazil itself accounts for only a small share of US exports (about 2 per cent), but Latin America as a whole is more significant, absorbing around 20 per cent of US exports. These export markets could obviously be affected by any tendency for the financial difficulties to spread across the region. A number of other Latin American countries are now in the difficult position of running high interest rates to protect their currencies at a time when their domestic economies are weakening, and in some cases contracting. There is also the risk that these events may contribute to financial market nervousness in the industrial countries.
The weaker international environment has not been supportive of world trade, which is estimated by the IMF to have increased by around 3½ per cent in 1998, compared with growth of nearly 10 per cent in the previous year. Growth of 4½ per cent is forecast for 1999. The nature of the Asian and Japanese financial crises has also had important implications for the distribution of global trade flows. The massive capital outflow from Asian economies has seen their combined current account swing from a small surplus in 1997 to an estimated surplus of nearly US$100 billion in 1998 (Table 4). The counterpart to this in the rest of the world has primarily been the widening of the US external deficit, reflecting the continued strong growth in the US economy while export opportunities weakened.
| 1995 | 1996 | 1997 | 1998(a) | Change 1996–98 |
|
|---|---|---|---|---|---|
| United States | −115 | −135 | −155 | −231 | −96 |
| Japan | 111 | 66 | 94 | 128 | 62 |
| Asia | −36 | −38 | 9 | 95 | 133 |
| Europe | 53 | 90 | 123 | 100 | 10 |
| Latin America | −36 | −38 | −65 | −87 | −49 |
| Other | −22 | −2 | −25 | −77 | −75 |
| Total(b) | −45 | −57 | −19 | −72 | −15 |
|
(a) Forecast. Source: IMF. |
|||||
As noted earlier, inflation outcomes in 1998 were low in all the major industrial countries, with a year-ended outcome for the G-7 countries as a whole of roughly 1 per cent. Such a low aggregate outcome does not imply global deflation, although an increased number of individual goods are likely to experience absolute price declines. Deflation is a genuine problem for Japan, however, and for that reason alone, is of some concern for the global economy.
Domestic Economic Activity
The Australian economy grew strongly throughout 1998 despite the unfavourable external conditions: the September quarter national accounts recorded year-ended growth in GDP of 5 per cent, and subsequent indicators point to further expansion in the December quarter (Table 5). Most sources of output growth exhibited strength over the past year, the only significant exception being exports, although the ability of some exporters to find new markets staved off what otherwise could have been large falls. Growth has been supported by a number of factors in the recent period, including the low level of interest rates and the ready availability of credit, as well as the assistance to exporters and import-competing industries from a lower exchange rate. In addition, conditions in the household sector have generally been conducive to strong growth in consumer demand.
| Six months to: | Year to September 1998 |
||
|---|---|---|---|
| March 1998 | September 1998 | ||
| Expenditure | |||
| Private final demand(b) | 7.0 | 3.4 | 5.2 |
| Consumption | 4.1 | 3.7 | 3.9 |
| Dwelling investment | 18.1 | −1.4 | 7.9 |
| Business fixed investment(b) | 17.7 | 5.7 | 11.6 |
| – Equipment(b) | 11.4 | 10.3 | 10.9 |
| – Non-dwelling construction(b) | 29.6 | 2.0 | 15.0 |
| Public final demand(b) | 1.3 | 7.2 | 4.2 |
| Increase in private non-farm stocks(c) | −0.7 | 1.2 | 1.0 |
| Net exports(c)(d) | −1.9 | −0.2 | −0.9 |
| Gross domestic product | 6.0 | 3.9 | 5.0 |
| Non-farm gross domestic product | 5.5 | 4.5 | 5.0 |
| (a) All series are annually chained. (b) Excluding transfers between public and private sectors. (c) Contributions to growth in GDP. (d) Excludes RBA gold transactions. |
|||
Overall, the economy has been stronger than expected in the recent period, and appears to have entered 1999 with considerable momentum. The main area of weakness is likely to remain the export sector, where prospects are that the international environment will remain difficult for some time. There are also signs that the housing sector is unlikely to contribute as strongly to growth in the period ahead as it has recently, and there has been a decline in near-term business investment intentions. Nonetheless, general indicators of business and consumer confidence picked up strongly towards the end of 1998.
Household income and expenditure
Growth of retail sales, after a slower period around the middle of the year, strengthened in the second half. In the December quarter, retail sales increased by 0.5 per cent in real terms, to be 2.7 per cent higher than a year earlier (Graph 12). Over the second half of the year, sales increased by 1.9 per cent in real terms. Monthly sales figures point to solid growth through most of the second half of the year, although they show a decline in December. This latter result may have been affected by changes in the seasonal pattern that have been evident over the December/ January period in recent years, and it is noteworthy that weak December figures have tended to be followed by a bounce-back in January. Some smoothing of the two figures is likely when seasonal factors are re-analysed and presented in July. Overall growth in sales during the past year has been broadly based across most categories of retailers, although there has been some weakness recorded for household-goods retailers, possibly reflecting loss of market share to department stores.
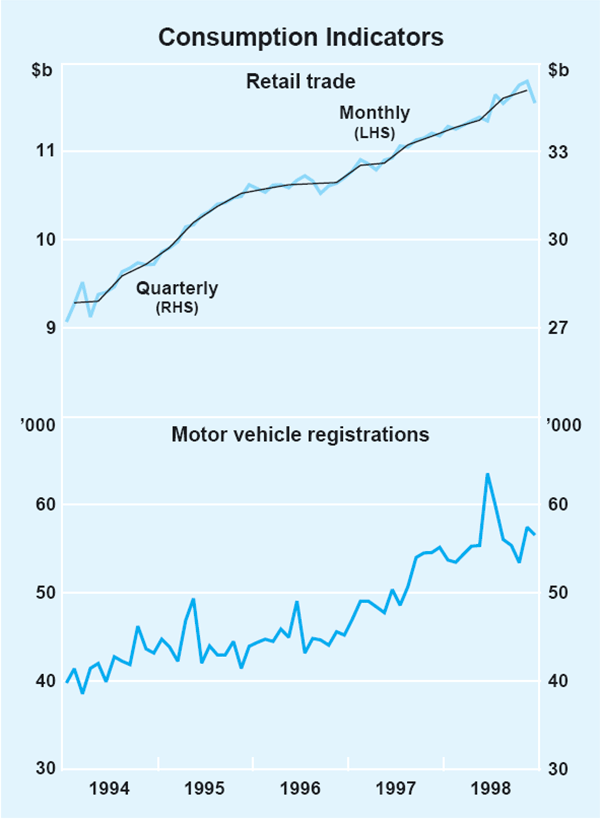
Motor vehicle purchases have also been strong. In 1998 as a whole, the number of new car registrations was 11 per cent higher than in 1997, although monthly figures suggest a levelling out, albeit at very high levels, towards the end of the year. The strength in motor vehicle sales has reflected a very competitive pricing environment, as well as the low level of interest rates, both of which have contributed to affordability. The ageing of the car fleet in recent years has probably also contributed to a desire by consumers to upgrade the car stock. Although these factors are likely to persist in 1999, motor vehicle purchases seem unlikely to contribute to overall consumption growth to the same extent as they did in 1998.
Total consumption expenditure of households has been increasing more strongly than retail sales for some time, partly reflecting the strength of motor vehicle purchases. There has also been relatively strong growth of spending on services, such as recreation, travel and communications, that are not included in retail trade. This, in turn, is part of a longer-term increase in the share of spending accounted for by services. Over the year to the September quarter, total consumption increased by 3.9 per cent. Consumer spending growth has, for the past couple of years, outstripped the growth in household incomes, resulting in a gradual decline in the household saving rate.
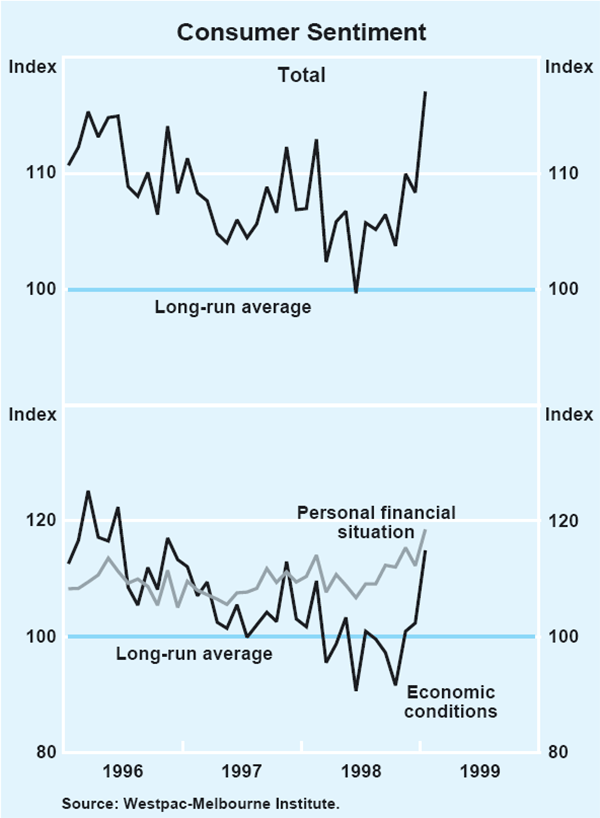
The overall strength in consumption has been supported by a high level of consumer confidence. Despite a weakening in the early to middle part of 1998, consumer sentiment, as measured by the Westpac-Melbourne Institute index, remained above its long-term average throughout the year (Graph 13). The deterioration in confidence early last year appears to have mainly reflected nervousness about economic prospects, which in turn is likely to have reflected news about the problems affecting Australia's trading partners and international financial markets. Despite these concerns, consumers remained relatively up-beat in their assessments of their own financial situations, and respondents to the survey over the past 18 months have consistently reported greater confidence in their personal financial situations than in general economic conditions. Both aspects of sentiment picked up strongly in the latter part of 1998 and early 1999, bringing overall consumer sentiment to its highest level in four years.
Increases in household wealth have also contributed to the favourable environment for consumption growth. The household sector's financial wealth has increased strongly over the past year, partly as a result of the strength of the share market (see section on ‘Financial Conditions’ below). Two additional factors, the AMP demutualisation and the Telstra privatisation, have also resulted in a significant boost to available household wealth in the recent period. While the AMP demutualisation transformed rather than created wealth, it did enable households to liquidate wealth that was previously inaccessible. In addition, the privatisation of Telstra and subsequent strong rise in its share price created capital gains for many households who were not previously shareholders. Both of these developments have contributed to a trend, which was already in place, towards an increase in the proportion of households owning shares. One consequence of this trend may be that consumer spending is being more strongly boosted by a rise in share prices than would have been the case in the past, when shares were more narrowly held. The AMP demutualisation, which was probably the more important of the recent special factors, is likely to have had its main impact on consumer spending in the second half of 1998, and this impact can be expected to wane in the year ahead.
The housing market
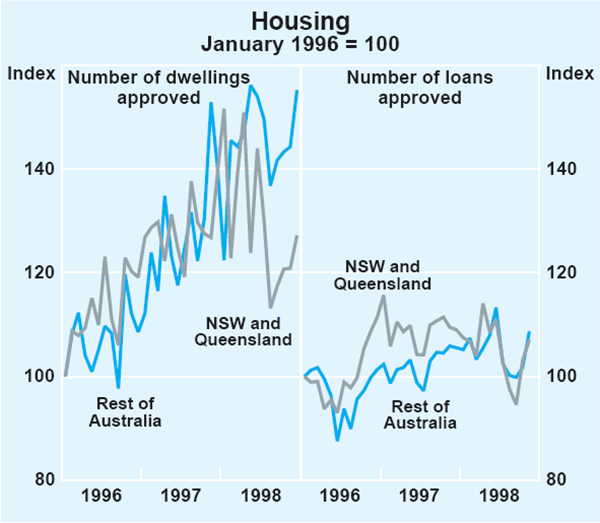
Forward indicators of housing activity appeared to reach a peak around the middle of 1998, with the number of building approvals declining in the second half of the year. In the December quarter, the number of building approvals was 8 per cent lower than six months earlier. Loan approvals for housing have been more robust, picking up in the latter part of the year after a weaker period around the September quarter, but they have nonetheless shown little growth over the past year as a whole. The overall level of dwelling investment, which includes alterations and additions as well as work on new dwellings, is currently around 27 per cent higher than at the time of the most recent trough.
The recent building approvals data may overstate any weakening in housing activity in the second half of 1998. Changes to building approval procedures in NSW and Queensland around the middle of 1998 have meant that building approvals can now be issued by private agencies, rather than the local councils surveyed by the ABS. The change may have led to some under-reporting of the number of approvals in those States. This appears to be supported by the fact that sharp falls in the recorded number of building approvals are not apparent for the other States, and also appear out of line with the loan approvals data (Graph 14).
The most appropriate interpretation of the recent indicators is probably that building approvals have declined a little, but that the overall level of housing activity is likely to remain close to current levels during 1999. Work in the pipeline should sustain construction levels for some time into the current year, and the housing upswing, unlike most in the past, does not seem to have generated a level of overall construction significantly out of line with underlying demand. Moreover, high levels of affordability should continue to support demand. Also noteworthy is that alterations and additions, which tend to be less cyclical than new construction, now account for as much as 45 per cent of all housing activity.
Recent developments in house prices are not suggestive of significant imbalances between supply and demand. On average, house prices are now rising only moderately, following a period of rapid growth in 1997 and early 1998 driven in large part by sharp increases in the inner-city suburbs of Sydney and Melbourne. Rents in most of the major capitals are also rising at a moderate rate, which is consistent with supply and demand being fairly close to balance. The main exceptions to this are Canberra and Tasmania, where declining populations have resulted in decreased demand for housing and downward pressure on prices.
The business sector
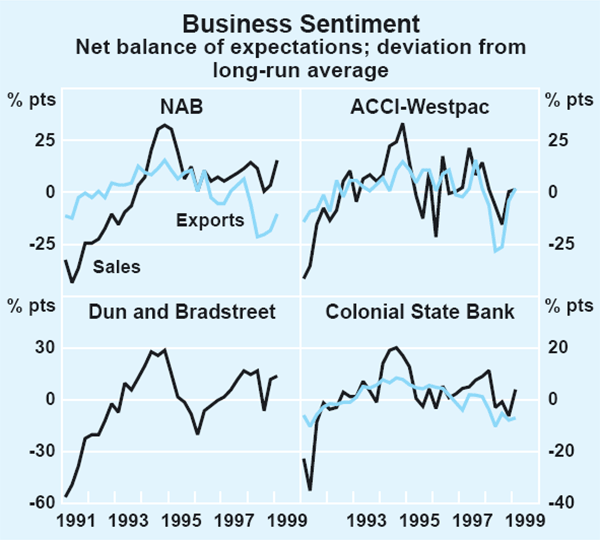
Measures of business sentiment recovered in the latter part of 1998, following declines in the first half of the year prompted by fears of sharply reduced external demand and slower domestic growth. The NAB survey for the December quarter shows that overall indicators of business confidence and expected business conditions picked up to around their level of a year ago, although the mining sector became more pessimistic. Expectations concerning export sales improved, but remain below their long-run average. The Dun and Bradstreet survey confirms a general improvement in confidence across most industries. More specialised surveys of the manufacturing sector, the ACCI-Westpac and Colonial State Bank surveys, also suggest that conditions improved noticeably, following a sharp deterioration earlier in the year. The improvement relates more to domestic than to export sales (Graph 15), although the latter has improved significantly of late.
The most recent surveys of sentiment postdate information on corporate profitability which, as measured by gross operating surplus, was flat in the September quarter. Nonetheless, profits rose by around 12 per cent over the year to September and, as a share of GDP, were higher than their average for the past decade. The above-average level of profitability seems consistent with the tendency for many firms to have reported their own conditions as being better than their assessment of the general outlook. Consistent with earlier surveys of sentiment, the flatness in September quarter profits primarily reflected difficulties in the manufacturing sector. Small business profits are a bit below their decade-average share of GDP.
Business investment in equipment increased strongly in the September quarter. Part of this may reflect some slippage of expenditure from the surprisingly weak June quarter and, given the sharp fall in volumes of imports of machinery and industrial equipment apparent in December quarter data, may well have been reversed subsequently. This would not be inconsistent with results from the ABS capital expenditure survey released in November, which pointed to a weakening in the near-term outlook for business equipment investment. Based on average realisation ratios, the survey suggests little change in nominal investment in 1998–99 as a whole, which would imply a slight fall in real terms after allowing for rises in imported equipment costs. For this to occur for the year as a whole would require significant declines in real terms after the September quarter.
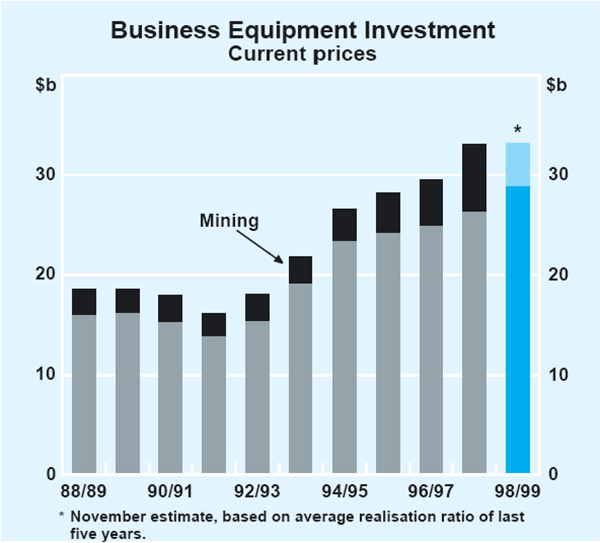
These survey expectations are always subject to uncertainty, and it is possible that they will be revised upwards given the recent rebound in business confidence. Nonetheless, the composition of investment expectations seems broadly consistent with trends in business sentiment. The roughly unchanged level of expected investment in nominal terms, according to the survey, comprises a large decline in mining investment – to around 25 per cent lower than last year – roughly offset by small increases in expenditure in other sectors (Graph 16). This, in turn, would be consistent with the pattern of recent surveys of profit expectations, which are reasonably solid for retailing and manufacturing but quite gloomy for the mining sector.
It is possible that mining investment would have been weak in 1998–99 even without the crisis in Asia, simply because its tremendously rapid growth in recent years made it quite likely that it would experience a pause at some stage. However, the capital expenditure survey indicates that investment intentions in the mining sector have been revised down substantially in the past six months. This development, and the deferral of some very large projects, seems mainly attributable to weakening external demand and falling commodity prices.
Investment in buildings and structures was quite strong last year, rising by 15 per cent over the year to September (Graph 17). However, several large projects (particularly in the mining sector) are nearing completion. The amount of new work entering the pipeline should be sufficient to roughly maintain the current level of activity for a few more quarters, but the flattening out of approvals in recent months suggests that, at this stage, there is limited impetus for further growth in the medium term. Also, while much of the mining investment has been centred on Western Australia and, to a lesser extent, Queensland, a disproportionately large share of building investment is centred on New South Wales. This largely reflects Olympics-related investment and many of the Olympic venues will be completed over the latter part of this year, while a number of hotels are scheduled for completion in early 2000.
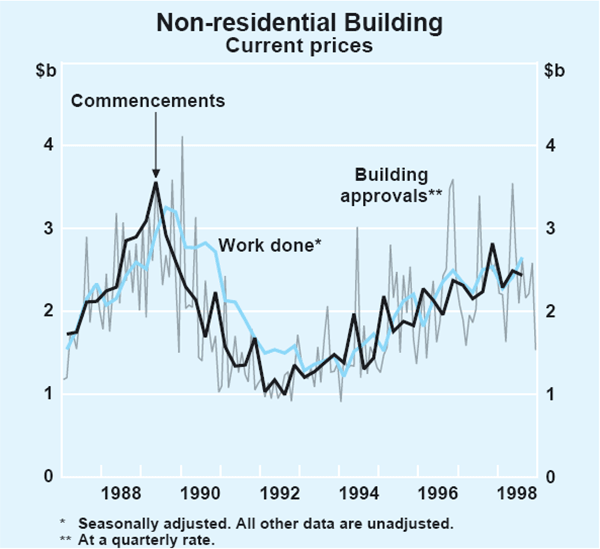
The office property market is experiencing some increases in available space, as several developments are completed. This has led to rising vacancies in some office centres and, in general, a steady supply of new developments and refurbishments has meant that rents have been stable and price increases modest. Despite the rapid increase in work done over the past year, the value of outstanding office projects is presently about three times the level of two years ago, suggesting continued growth in supply of office space for some time. One difficulty for these markets is that prospective tenants may be reluctant to commit to new premises at a time when growth in demand for their output may be expected to slow.
Businesses appear content with current holdings of inventories according to surveys, and stocks-to-sales ratios appear to be broadly in line with historical trends at present. In the early part of 1998, stock accumulation accounted for a significant part of the strong growth in output; stock building in the private non-farm sector contributed about a percentage point to expenditure and output growth, and about half of that was accounted for by the manufacturing sector following a run-down in stocks the year before. This source of growth in demand did not continue in the subsequent quarters and, at present, there seems little pressure in aggregate for firms to either run down their stock levels or to build them up more rapidly than normal.
The labour market
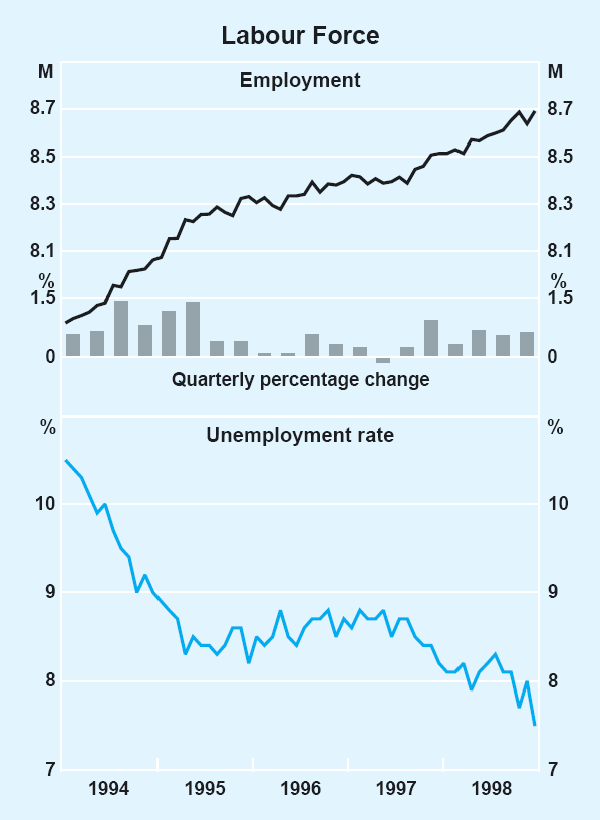
Recent employment data have been quite volatile but it is clear that the recovery in the labour market, which began in late 1997, continued throughout 1998. Employment rose by slightly more than 2 per cent over the year (Graph 18). Much of the more recent strength in employment has been in the part-time component, although the past 18 months have seen strong growth in full-time employment as well. The rate of employment growth sustained during 1998 allowed the unemployment rate to fall below 8 per cent towards the end of the year. In the December quarter, the unemployment rate averaged 7.7 per cent, its lowest level since 1990 and well below its average of 8.3 per cent a year earlier.
Recent employment growth has been consistent with general economic developments with respect to both sectoral performance and timing. Job growth has been highest in construction, property and business services, and finance, all of which are areas where growth in demand and output has been relatively strong. Employment has generally been weaker in those industries that are more dependent on external demand, particularly manufacturing, and to a lesser extent mining and agriculture.
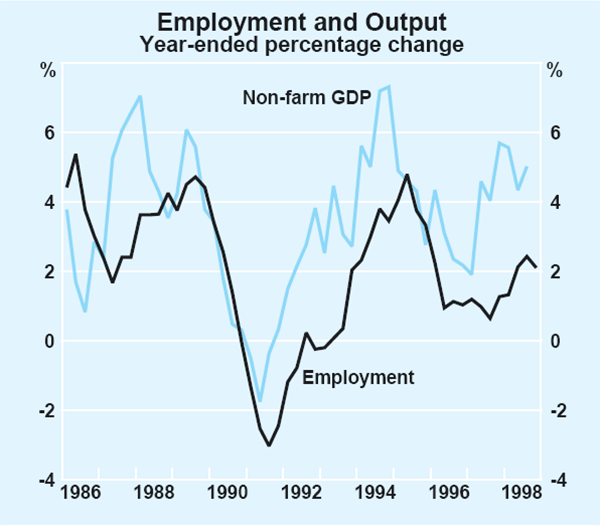
Developments in recent quarters suggest that employment continues to respond broadly to movements in output growth with a lag (Graph 19). One implication of this lagged response is that non-farm labour productivity growth tends to pick up initially when output growth increases, as businesses expand output by using existing resources more intensively before increasing their levels of employment. This may have been amplified in the recent period by a more cautious approach to hiring due to the more uncertain business climate. The overall effect has lifted labour productivity growth well above historical averages recently; over the year to the September quarter, non-farm labour productivity rose by 3 per cent.
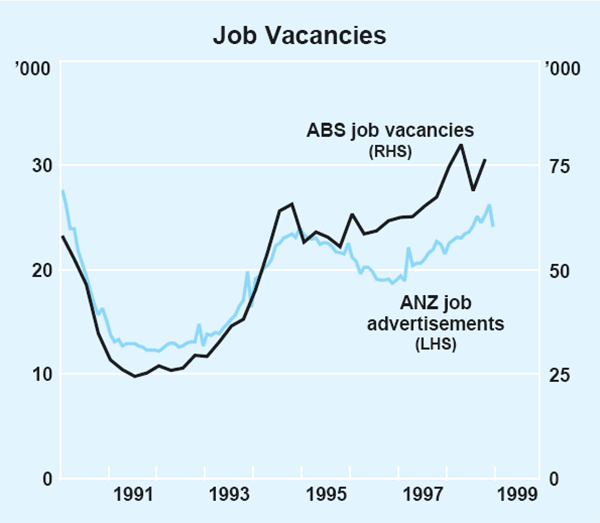
Forward-looking indicators, such as surveys of job vacancies, suggest that labour demand remains robust. The ANZ measure of job advertisements increased further through the December quarter and, despite a decline in January (when figures are often volatile), has increased by 12 per cent over the past year. The ABS vacancies series, which was unusually volatile during 1998, rose sharply in the December quarter to be 14 per cent higher than a year earlier (Graph 20). Hiring intentions also appear to remain firm, with all the major surveys recording little change in the net balance of companies expecting to increase employment.
Balance of Payments
Australia's exports have continued to be adversely affected by the unfavourable conditions overseas. The value of exports (excluding gold) declined by 3 per cent in the December quarter, and by around 2 per cent over the past year. The decline in value terms recorded in the December quarter appears to have been accounted for by a sharp fall in export prices, implying that volumes were fairly flat in the quarter and showed little net growth over the year. This flat performance contrasts sharply with earlier years. Over the period 1990–97, exports grew at an average annual rate of 9 per cent in volume terms, and at a similar rate in value terms.
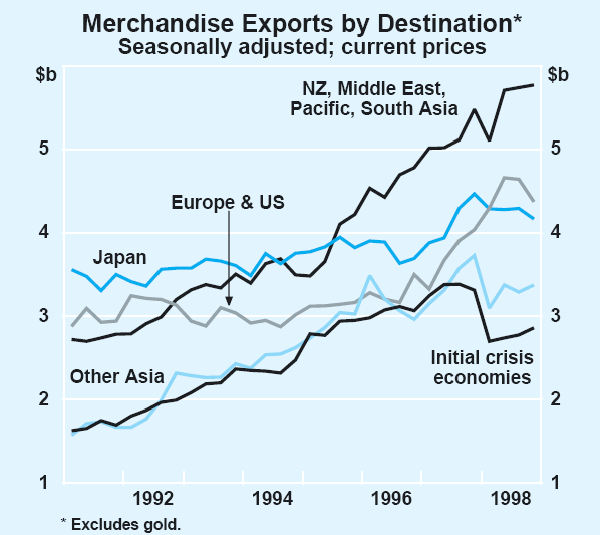
The effects of weaker external conditions have been most evident for manufactured and services exports. For a number of years, these were the fastest-growing components of Australian exports, but they began to weaken around the second half of 1997 as the crisis-affected economies in east Asia turned down. Services exports were affected by a sharp downturn in tourist arrivals from east Asian countries, which was only partly offset by stronger arrivals from other sources. Both services and manufactured exports declined further in the second half of 1998. Exports of resources have generally been more resilient than the other components, and continued to grow well into 1998. This pattern broadly reflected the greater success by resource exporters in finding alternative markets for their products in the face of weaker demand from east Asia. In the second half of 1998, however, resource exports declined in value terms, probably reflecting the effect of lower commodity prices. Rural exports were the only component to increase in value in the second half of 1998, reflecting increased production resulting from more favourable weather conditions.
Since the onset of the east Asian crisis in mid 1997, the value of merchandise exports to the initial crisis-affected countries has fallen by 15 per cent (Graph 21). Exports to other countries in the region (excluding Japan) fell by about 11 per cent in the first half of 1998, but appear to have stabilised since then. There has also been a decline in exports to Japan recently, after unusually strong growth in 1997. To a significant degree, the impact of the loss of export sales to these markets since mid 1997 has been offset by stronger growth in sales to the United States, to Europe, and to other markets. As noted above, much of this reflected successful re-direction of resource exports. Over the second half of 1998, however, exports to the US and Europe fell by around 6 per cent, with a decline in rural exports, particularly wheat, and manufactures.
Growth in the volume of imports has weakened noticeably during the past year, and particularly in the second half of the year. In the September quarter 1998, import volumes fell slightly, and preliminary indications point to a further slight fall in the December quarter. With strong price increases, the value of imports increased by 7 per cent over the year. The restraint in import volumes over the past year or so appears mainly attributable to the depreciation of the Australian dollar against currencies of our import sources and the resultant rise in import prices at the docks.
Largely reflecting the profile for motor vehicle imports, consumption import volumes declined in the second half of the year after growing strongly in the first half. Capital imports in underlying terms (excluding civil aircraft) rose strongly in the September quarter, but retraced this gain in the December quarter, with imports of machinery and industrial equipment falling sharply. Imports of intermediate goods appear to have picked up strongly in the December quarter after a slight fall in September. Service imports fell through much of 1998, although this may have been arrested in the December quarter. The fall reflected, in part, declining purchases of business and technical services related to, for example, computing and telecommunications. These services are purchased primarily from industrial countries whose currencies have appreciated significantly against the Australian dollar, which may have prompted some substitution towards domestic suppliers. The decline in service imports also reflects a shift in the pattern of Australian tourism abroad in favour of cheaper destinations, probably to take advantage of divergent exchange-rate movements.
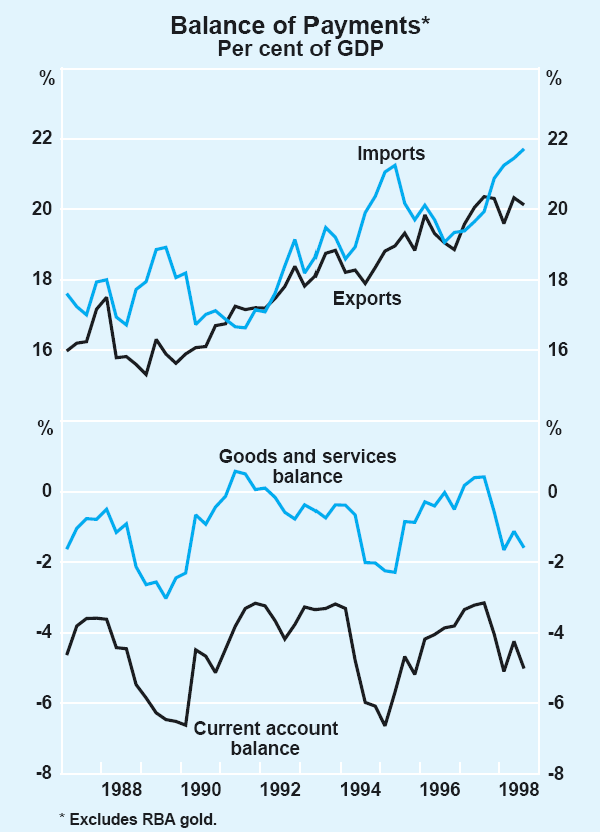
With imports having grown strongly in value terms over the past year and exports showing only a small increase, the current account deficit has widened significantly. In the September quarter 1998, the current account deficit was equivalent to 5 per cent of GDP, after averaging 4.7 per cent of GDP in the first half of the year and 3.7 per cent in the second half of 1997 (Graph 22). The widening in the current account position reflects an increase in the trade deficit, with the net income deficit having remained roughly stable over the past year. Monthly trade data point to a further increase in the trade deficit in the December quarter, and a corresponding widening in the current account deficit to around 5½ per cent of GDP.
Australia's net foreign liabilities increased slightly in the September quarter to around 60 per cent of GDP, reflecting a rise in net foreign borrowing and, to a lesser extent, falls in the market value of Australia's foreign equity assets. Depreciation of the exchange rate has had very little effect on the valuation of net foreign liabilities, as Australia's gross foreign-currency liabilities are roughly equal to holdings of foreign-currency assets. This has also meant that exchange-rate depreciation has had no noticeable effect on the net income deficit. The ratio of net income payments to exports, a standard measure of the debt-servicing burden, has continued to fall, albeit modestly, reflecting declines in world interest rates; currently this ratio is around its historical average.
Commodity prices
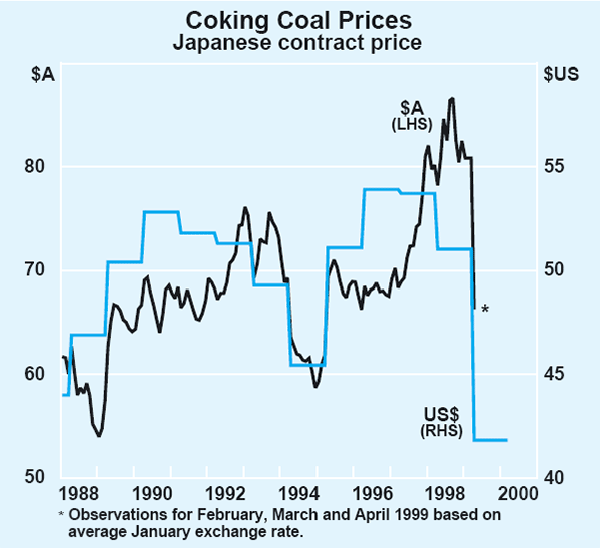
Prices of most commodities have continued to weaken in recent months. Most notably, the recently negotiated contracts for coking coal resulted in price falls of around 18 per cent in US dollar terms (Graph 23). The market has been affected by adverse conditions in the world steel industry, where a global oversupply has forced major steel producers such as Japan to reduce production.
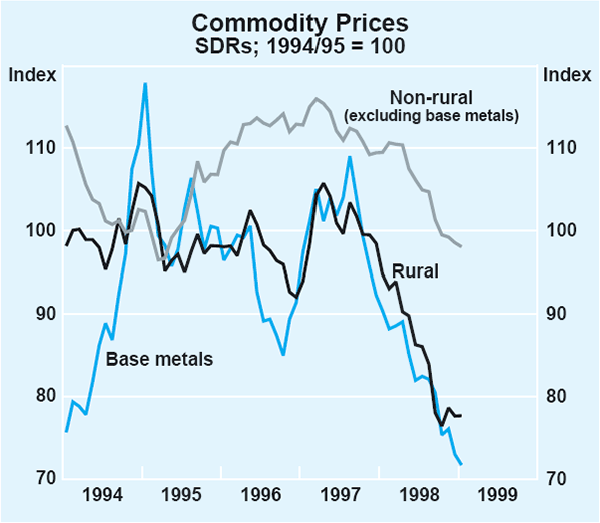
The effect of weaker external demand is also apparent in base metal prices, which fell by 8 per cent in SDR terms over the December quarter and by around 20 per cent over the past year. Prices for rural commodities also fell by about 20 per cent over 1998 but tended to be more stable over the last few months of the year, with some recovery in wheat prices offsetting weaker beef prices. Overall, commodity prices have declined by 15 per cent over the past year, including by around 5 per cent in the December quarter, in SDR terms (Graph 24). The depreciation of the Australian dollar has offset this decline to some extent: the commodity price index declined by 6 per cent over the year when measured in Australian dollars. The terms of trade fell by around 2–3 per cent in the December quarter and by around 8 per cent over the year.
Financial Conditions
Intermediaries' interest rates
The reduction on 2 December 1998 of the Bank's target cash rate saw financial intermediaries subsequently announce lower indicator rates on most variable-rate loans (Graph 25). While the cash rate has returned to the previous cyclical low of 1993/94, intermediaries' lending rates some time ago moved well below their levels at that time (Table 6).
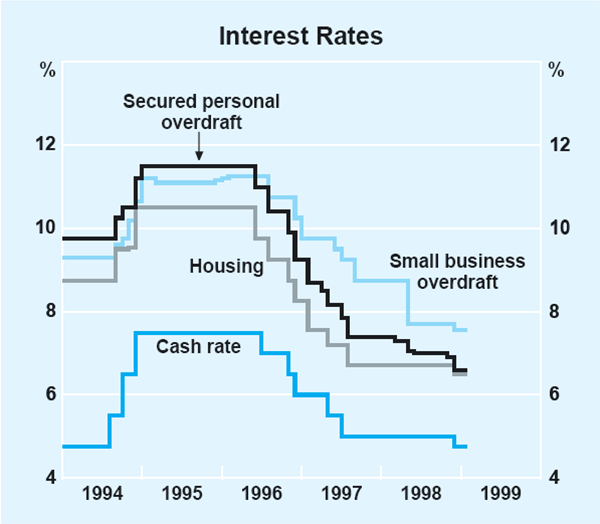
| June 1994 | Jan 1999 | Change | |
|---|---|---|---|
| Cash rate target | 4.75 | 4.75 | 0 |
| Housing | 8.75 | 6.50 | −2.25 |
| Small business | 9.30 | 7.55 | −1.75 |
| Large business | 9.00 | 7.95 | −1.05 |
The extent of the cuts following the monetary policy easing varied among intermediaries and from product to product; the average lag with which changes in variable-rate lending rates were passed on to existing borrowers was noticeably less than the average lag in the five easings of 1996/97. For business borrowers, the lags were also shorter than in the tightening phase of 1994. Movements are summarised in Table 7.
|
Average reductions after December easing |
Average level |
|
|---|---|---|
| Household | ||
| Housing | ||
| Standard variable | −0.20 | 6.50 |
| Basic | −0.20 | 5.90 |
| Personal | ||
|
Residential-secured
overdraft |
−0.30 | 6.60 |
|
Credit card (with interest-free period) |
0.00 | 15.30 |
| Business | ||
| Small business | ||
| Residential-secured | ||
| – Overdraft | −0.25 | 6.95 |
| – Term | −0.25 | 6.65 |
| Other(a) | ||
| – Overdraft | −0.15 | 7.55 |
| – Term | −0.30 | 7.15 |
| Large business | ||
| Overdraft | −0.10 | 7.95 |
| Term | −0.15 | 7.90 |
| (a) Both secured by other assets and unsecured. | ||
For housing loans, some banks passed on all of the most recent easing in the cash rate, while others passed on the bulk of it; a number of banks in this latter group, in effect, moved their interest rates into line with those of their major competitors. On average, banks cut interest rates on standard variable and basic housing loans by around 20 basis points, to 6.50 and 5.90 per cent respectively.
Mortgage managers generally passed on the full amount of the reduction in the cash rate, slightly widening their price advantage relative to banks. Standard variable loans from mortgage managers are available at 6.10 per cent, while basic loans are around 5.75 per cent. In part, the more complete pass-through of the cut in the cash rate by mortgage managers reflects the fact that mortgage managers' funding is sourced exclusively from short-term wholesale markets, in which interest rates tend to move with the cash rate. By contrast, banks also raise a significant proportion of their funding from retail deposits on which rates are already negligible, with almost no scope to reduce them further, i.e. banks' average cost of funds fell by less than the reduction in the cash rate and by less than mortgage managers'. The larger reduction of mortgage managers' lending rates may also reflect a decision, based on competitive pressures, to try to arrest the decline in their share of new housing loans. In 1998, this share returned towards its lower level of 1996, as banks recovered ground by introducing more competitively priced products.
On personal loans, most lenders reduced interest rates on residentially secured revolving lines of credit – commonly referred to as ‘home equity’ loans – where the average interest rate fell from 6.90 per cent to 6.60 per cent. Interest rates on other personal loans, including for credit cards, were not generally reduced.
Interest rates on the range of small business loans were typically reduced by around 25 basis points after the cut in the cash rate; some banks reduced rates on some products by less than this while others cut some rates by more. On the major small business products: indicator rates on residentially secured term loans and overdrafts were reduced by 25 basis points, to averages of 6.65 and 6.95 per cent respectively; the indicator rate on term loans secured by other assets was reduced by 30 basis points, to an average of 7.15 per cent; the indicator rate on overdrafts secured by other assets was reduced by 15 basis points to an average of 7.55 per cent.
The reduction in indicator rates announced by some banks early in 1998, independent of any move in monetary policy, has been translated into lower total interest costs for small businesses, resulting in a narrowing of banks' interest margins in this line of business. This is evident in the continued fall in the average interest rate paid on small business loans, which includes customer risk margins as well as advertised indicator rates. This weighted average rate was 8.8 per cent in September 1998 (the latest available data), 60 basis points lower than in the March quarter. The fall in the average interest rate paid on small business variable-rate loans between mid 1996, when the latest cycle of easing of monetary policy began, and September 1998 amounts to 3.8 percentage points, 1.3 percentage points more than the reduction in the cash rate over the same period.
Banks were more selective in reducing indicator rates on loans to large businesses. Two major banks which had held these rates steady since the previous easing of monetary policy reduced them by 25 basis points. Other major banks generally left unchanged rates on products which had been reduced in mid 1998 independent of any change in the cash rate. Indicator rates on variable-rate term loans to large businesses now average 7.90 per cent, while overdraft rates average 7.95 per cent. Since mid 1996, indicator rates for large business have fallen by about the same amount as the cash rate.
While competition for small business loans has been evident in reduced indicator rates and explicit pricing of security offered, competition for lending to large business seems to have been occurring at the level of customer risk margins, with some discounting of interest rates on variable-rate loans apparent. The weighted-average interest rate on variable-rate loans to large business (excluding bills) was 7.6 per cent in the September quarter, about 0.5 of a percentage point below the average indicator rate. About 60 per cent of loans to large businesses are bill facilities, with less than 20 per cent priced from indicator rates on variable-rate loans.
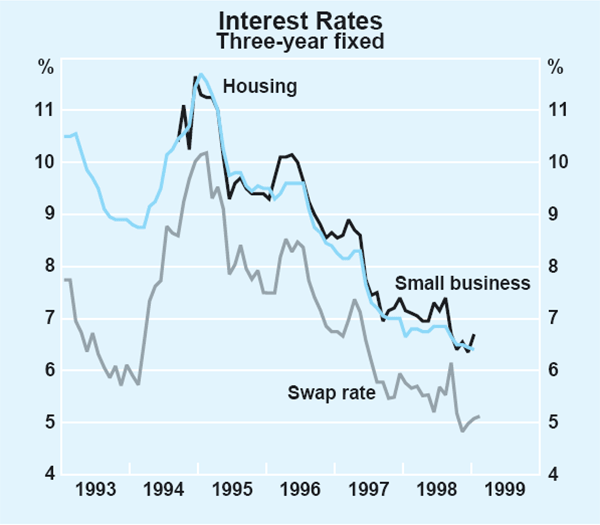
Interest rates on fixed-rate lending typically reflect movements in yields of comparable maturity in capital markets. After the brief reversal in June, as the exchange rate weakened, the downward trend in fixed-rate loans was renewed over the second half of 1998 (Graph 26). Interest rates on three-year, fixed-rate housing loans are currently 6.4 per cent, half a percentage point lower than in June, and well below the previous cyclical low of 8.75 per cent in early 1994. Fixed-rates for small business loans are also at low levels, with indicator rates on three-year loans currently around 6.7 per cent. The continued low structure of long-term interest rates, and confidence that inflation is likely to remain low, saw another bank introduce a fixed-rate housing loan for a term of ten years; two major banks now offer fixed-rate loans with terms as long as this. Interest rates on these products are around 7 per cent.
Credit and money growth
Credit outstanding grew by more than 10 per cent over the year to December, well in excess of the economy's nominal rate of growth (Table 8). Within the total, credit to households continues to grow strongly, with personal credit increasing by more than 15 per cent over the past year; growth in credit for housing may have eased slightly in recent months, but remains close to 12 per cent. Business credit growth has been slightly more volatile over the past year, but appears to have been picking up over the past few months. Recent data suggest that business loan approvals have held up, providing further evidence that demand for business credit is firm.
| Six months to: | |||
|---|---|---|---|
| December 1997 | June 1998 | December 1998 | |
| Total credit | 12.3 | 10.2 | 11.2 |
| Household | 11.5 | 12.6 | 12.7 |
| – Housing | 11.0 | 12.9 | 11.0 |
| – Personal | 13.4 | 11.7 | 18.9 |
| Business | 13.4 | 7.8 | 9.7 |
| Currency | 7.8 | 6.3 | 9.6 |
| M1 | 11.0 | 10.8 | 0.2 |
| M3 | 3.4 | 7.5 | 6.0 |
| Broad money | 5.2 | 6.8 | 7.7 |
Currency in circulation increased by around 8 per cent over 1998, consistent with the combination of relatively robust consumer demand and low interest rates. Growth in the deposit-based monetary aggregates, M1, M3 and broad money, was around 5–7 per cent over the year with a significant proportion of this growth accounted for by large increases in issues of certificates of deposit. With deposit growth relatively low, banks and NBFIs funded the steady growth in the supply of credit by using alternative sources of funds and, on occasion, reducing their holdings of non-loan assets. Such behaviour was particularly evident in the first half of 1998 when banks increased their offshore borrowing and reduced their holdings of government securities.
Growth in the value of funds under management declined in the September quarter, primarily reflecting the fall in values of domestic and major overseas equity markets. Nonetheless, growth has remained very strong (Table 9), and is likely to have picked up again in the December quarter given the strong performance of most major equity markets during that period. The bulk of funds (around three-quarters) continues to be held in domestic and overseas equities and long-term debt securities but, given that cash management trusts continue to be the fastest growing recipient of funds, the share of cash and deposits (now a bit less than 8 per cent) has been rising.
| 1996 | 1997 | 1998 | |
|---|---|---|---|
| Cash management trusts | 28.4 | 55.9 | 49.9 |
| Unit trusts | 16.8 | 32.9 | 21.5 |
| of which: | |||
| – Property trusts | 10.0 | 20.9 | 22.8 |
| – Equity trusts | 20.7 | 48.7 | 8.3 |
| – Mortgage trusts | 28.9 | 47.7 | 16.2 |
| Life insurance offices | 7.3 | 11.8 | 7.1 |
| Superannuation funds | 15.5 | 22.9 | 12.0 |
| Total | 12.1 | 20.4 | 12.8 |
|
Sources: ABS Cat. Nos 5645.0 and 5655.0. |
|||
Household finance
Growth in personal credit continues to be driven by strong growth in revolving credit facilities, including overdrafts and credit cards. Part of the increased use of these facilities reflects substitution away from personal instalment loans, and thus does not explain the pick-up in growth of total personal credit. It may also be the case that credit cards are being used increasingly by households to make payments previously made by other means. One sign that this may be the case is the fact that the number of non-cash credit card transactions rose by about 40 per cent over the past year. It could also be the case that growth in personal credit has been overstated to some extent (and housing credit a bit understated) by the reporting by some banks of home-equity products, which are used in part for housing, entirely as personal overdrafts and other personal loans. On the other hand, as has been noted above, a genuinely strong increase in personal credit is consistent with the strength of consumption expenditure.
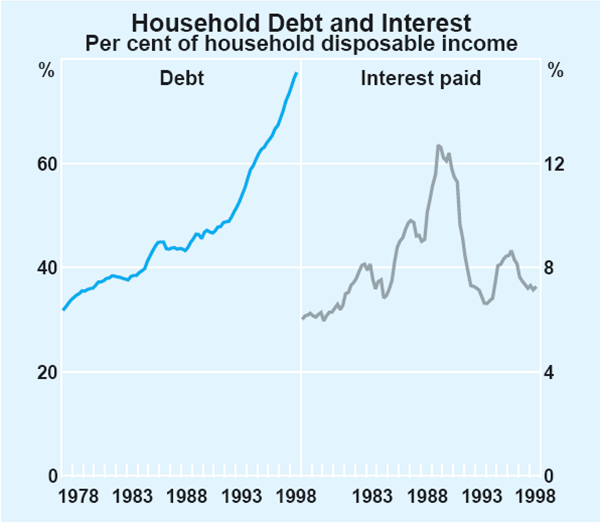
The past few years have witnessed a rapid expansion and change of composition in household balance sheets. Household liabilities increased by 13 per cent over the year to the September quarter, driven by strong growth in both personal and housing debt, associated with strong consumer spending and confidence, low interest rates and relatively easy access to funds. Households' financial assets, which are around three times the value of liabilities, increased at a slower rate than liabilities over the past year, although by a larger absolute amount. This meant that households' net financial wealth continued to increase over the year.
The rebound in equity prices in the December quarter should have seen it improve further.
These developments suggest that, in aggregate, household balance sheets are in good shape, with higher levels of wealth than in the past and more diverse portfolios. An area of possible longer-term concern, however, is that higher levels of household debt, and an increased holding of equity investments, may mean that households are more exposed to financial market volatility than before (Graph 27). In addition, the aggregate figures are likely to mask some significant variations in asset and liability holdings across households. For example, many households with relatively recent home loans would be more highly indebted than the average, and the debt exposure of this group is increasing as the size of the average new loan continues to rise.
Business finance
Growth in business investment has been supported by the low cost and ready availability of finance for businesses. There has been a gradual shift in the mix of finance towards a greater use of debt. The (private) corporate sector raised around $3 billion in equity and almost $10 billion in debt (either from financial institutions or directly from capital markets) in the September quarter, implying a further increase in the ratio of corporate debt to equity from the levels of several years ago. However, the low interest rate environment means that servicing burdens remain well below their average of the past decade. Also, the corporate sector's consolidated holdings of financial assets rose strongly in the second half of last year.
The modest widening of the spread between government and corporate bond yields in late 1998 prompted concerns in some circles that businesses were finding it more difficult to obtain finance. There is, however, little evidence to support such a view. Direct debt raisings did slow for a brief period in late 1998, but these represent a very small proportion, around 5 per cent, of total funding for Australian businesses. Funding from other sources remained readily available. The largest single source of finance, retained earnings, accounts for around half of the corporate sector's total funding, and is not directly affected by these problems. Credit from financial intermediaries, which typically accounts for around 25 per cent of total corporate funding, continued to grow at a solid pace. New equity raisings, normally around 20 per cent of total funding, also appear to have been little affected by the developments in debt markets. Available survey data suggest businesses themselves did not experience problems; according to the latest ACCI-Westpac survey, for the December quarter, manufacturing firms have experienced no increased difficulty in obtaining finance over recent times.
Inflation Trends and Prospects
Recent developments in inflation
Consumer prices
Inflation remained low during 1998 at levels of just over 1½ per cent. The Consumer Price Index increased by 0.5 per cent in the December quarter and by 1.6 per cent over the year to the December quarter (Graph 28). Measures of underlying inflation point to price increases of around 0.3 per cent in the quarter (Table 10). The Treasury underlying CPI increased by 0.3 per cent in the December quarter and by 1.6 per cent over the year, the same annual rate of increase as recorded the previous quarter.
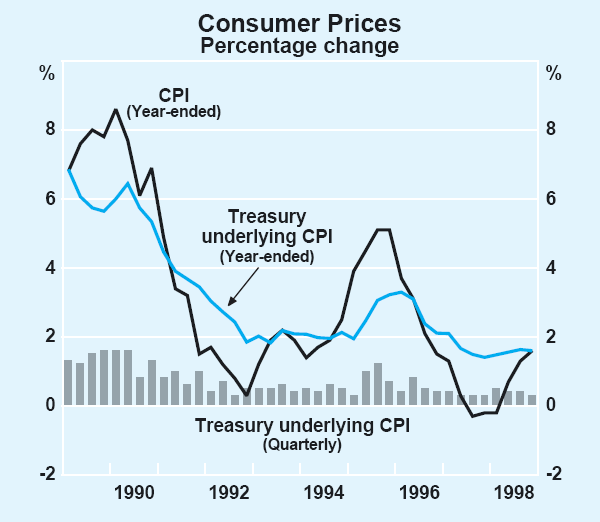
| September 1998 | December 1998 | September 1998 | December 1998 | ||
|---|---|---|---|---|---|
| Quarterly | Year-ended | ||||
| Headline CPI(a) | 0.2 | 0.5 | 1.3 | 1.6 | |
| ‘Acquisitions’ CPI(b) | 0.2 | 0.5 | 1.8 | 1.6 | |
| Treasury underlying CPI | 0.4 | 0.3 | 1.6 | 1.6 | |
| Private-sector goods and services | 0.2 | 0.4 | 1.5 | 1.5 | |
| Median price change | 0.4 | 0.3 | 1.9 | 1.5 | |
| Trimmed mean price change | 0.2 | 0.2 | 1.7 | 1.3 | |
| (a) Mortgage interest and consumer credit charges are not included in September
or December, but they affect the year-ended percentage changes. (b) Excludes mortgage interest and consumer credit charges, but includes house prices. |
|||||
The December quarter CPI is the second to be compiled on an ‘acquisitions’ basis, which excludes mortgage interest and consumer credit charges. The movement in the CPI over the year to December 1998 therefore contains two quarters (March and June) still constructed on the old basis; however, since there were no significant interest rate movements in that period, there is no longer any effective difference between the year-ended movement in the CPI and that of a consistent acquisitions CPI. Differences between the headline and underlying measures of inflation now reflect the exclusion of volatile items or other special factors from the underlying measures. In the December quarter, the main factors increasing the CPI relative to underlying measures were sharp increases in the prices of fresh fruit and vegetables and domestic holiday travel. These were partly offset by declining petrol prices.
Service prices have continued to rise noticeably more quickly than goods prices. Over the latest year, private-sector service prices increased by 2.7 per cent, compared with goods price increases of 1 per cent. This difference seems attributable mainly to the greater exposure of the goods-producing sector to international competition, whereas service prices are likely to reflect more closely the trends in domestic labour costs. Prices of imported goods in the CPI have been declining almost continuously over the past three years (see below), and the pressure of competition has probably constrained the ability of many domestic goods-producers to raise prices. As discussed below, there is a puzzling contrast between these continued declines in import prices at the consumer level and the higher prices recorded at the docks. Nonetheless, it is clear that, at the consumer level, import prices are having a restraining influence on overall goods prices.
Motor vehicle prices provide a good example of this process. The retail price of imported motor vehicles fell by 5.9 per cent over the year to the December quarter, and competition from imports has seen the retail price of domestically produced vehicles fall by 2.7 per cent over the same period. Overall, motor vehicle price declines have reduced the increase in the CPI over the past year by 0.2 percentage points, and the Treasury underlying inflation rate by 0.3 percentage points.
The exchange rate and import prices
The depreciation of the Australian dollar in the period since early 1997 has been followed by an increase in the landed price of imports but, as noted above, not yet by any increase in import prices at the retail level. Since the first half of 1997, the Australian dollar has depreciated by 10 per cent in import-weighted terms and by 17 per cent against the major currencies. On both measures, it has been relatively stable for the past few months. Reflecting the exchange-rate depreciation, landed import prices increased by 13 per cent between the March quarter 1997 and September quarter 1998, the period corresponding with the bulk of the exchange-rate movement, before declining by 1 per cent in the December quarter. Taken at face value, these developments suggest that the first stage of pass-through, from the exchange rate to landed import prices, may be largely complete.
Average historical experience would suggest that second-stage pass-through of these price increases to the retail level should now be occurring (Graph 29). As noted above, however, imported retail prices are still falling, and have been doing so for much of the past three years (Graph 30). In the December quarter, the imported goods component of the CPI declined by 0.7 per cent, to be 1.3 per cent lower than a year earlier. Although the fall in motor vehicle prices discussed above accounts for most of this fall, the prices of other imported goods also declined in the quarter, to be 0.4 per cent lower over the year. In the case of cars, the decline in retail prices of imported cars occurred despite an increase of 5 per cent in the landed price over the past year.
A possible explanation for the contrast between landed and retail import prices is that the rise in landed import prices may be overstated. It may be the case that suppliers from countries with sharply lower exchange rates have reduced their effective export prices, in US dollar terms, to an extent not fully reflected in official data. This might occur, for example, if recorded prices for intra-firm trade were not frequently revised in US dollar terms even when the effective price to the purchaser (including such things as sales incentives and rebates) was changing. If this has been occurring, the import price index would tend to overstate price increases for goods imported from countries whose exchange rates were depreciating against the US dollar. If correct, that would mean that the first-stage pass-through has been smaller than the official import-price data suggest, and that the eventual effect on retail prices will also be correspondingly smaller.
Another possibility is that the contrast between the landed and retail import price movements may simply reflect a longer-than-usual delay in the pass-through to the retail level. Increased use of exchange-rate hedging in recent years may have given importers greater insulation from exchange-rate movements than in the past; to the extent that this is occurring, cost increases would still be experienced when the hedges expire. It is also possible that competitive conditions are inducing wholesalers and retailers to absorb import price increases to a greater extent than seen in the past. Although this would be difficult to reconcile with the current strong demand conditions, there is some evidence of pressure on wholesalers' and retailers' margins in the NAB business survey, with recent results showing historically high numbers of wholesalers and retailers reporting that ‘too low an exchange rate’ is expected to be the major constraint on their profitability. It remains to be seen whether any such compression of margins is sustained, or whether import price increases are eventually passed on in line with average historical experience.
Producer prices
For manufacturing firms, the impact of the exchange-rate depreciation on costs has largely been offset by the weakness in commodity prices, especially oil prices, which have declined in Australian dollar terms by more than 20 per cent over the past year. The price of imported inputs rose by only 1.5 per cent over 1998, allowing total material costs to fall (Table 11). As a consequence, inflation in the prices of domestically produced manufactured goods has remained very low at the wholesale level. Surveys of manufacturing firms suggest a continuance of this trend into the March quarter. For example, the ACCI-Westpac survey found a net balance of respondents expecting to lower their prices in the March quarter. Prices of materials used in construction have also shown little evidence of inflationary pressure, increasing by only 1–1½ per cent over 1998.
| December quarter 1998 |
Year to December 1998 |
|
|---|---|---|
| Manufacturing | ||
| Input prices | −1.6 | −2.2 |
| – Domestic | −0.9 | −4.7 |
| – Imported | −2.6 | 1.5 |
| Final prices(a) | −0.5 | 0.7 |
| Construction | ||
| Input prices | ||
|
– Materials used in
house buildings |
0.3 | 1.5 |
|
– Materials used in
other buildings |
0.3 | 1.1 |
| Merchandise trade | ||
| Export prices | −5.0 | −2.3 |
| Import prices | −1.0 | 5.5 |
| (a) Excludes petroleum. | ||
Labour costs
Despite reasonably strong demand for labour, much of the available data suggest that overall wage inflation remained moderate in the second half of 1998. The Wage Cost Index (WCI), a measure of wage inflation across a fixed basket of ‘constant quality’ jobs, increased by 1.2 per cent in the September quarter (including bonuses), to be 3.4 per cent higher over the year to the September quarter. The small increase in the June quarter, followed by a sizeable increase in the September quarter, probably reflects a concentration of pay increases at end June and end December. Other wage surveys have recently displayed similar quarterly volatility. Average weekly ordinary-time earnings (AWOTE) increased by 1.8 per cent over the three months to August and by 4.2 per cent in year-ended terms (Table 12).
| Mar 1998 | June 1998 | Sep 1998 |
Year to Sep qtr |
|
|---|---|---|---|---|
| Quarterly | ||||
| Wage cost index (total pay including bonuses) | ||||
| Private | 1.0 | 0.4 | 1.1 | 3.3 |
| Public | 1.0 | 0.4 | 1.5 | 3.7 |
| Total | 1.0 | 0.4 | 1.2 | 3.4 |
| AWOTE | ||||
| Private | 1.3 | 0.8 | 1.5 | 4.1 |
| Public | 1.9 | 0.4 | 2.1 | 4.7 |
| Total | 1.4 | 0.6 | 1.8 | 4.2 |
| Annualised | ||||
| New enterprise agreements | ||||
| Private | 4.0 | 4.0 | 4.3 | |
| Total | 3.6 | 3.8 | 3.9 | |
New enterprise agreements have continued to yield wage rises noticeably lower than two to three years ago. In the September quarter, the average annual rate of increase for wages in new federal agreements was below 4 per cent for the third quarter in succession. Wage increases in the private sector were slightly higher, at just above 4 per cent in the latest quarter (Graph 31). Reflecting the more subdued outcomes of recent enterprise agreements, annual wage rises in currently active agreements declined to 4 per cent in the September quarter, well down from the peak of 5 per cent in mid 1997.
Nonetheless, some pockets of wage pressure have been apparent, notably in the construction sector, where output has risen rapidly over the past year. Recent enterprise agreements in the construction sector have been yielding wage increases well above the economy-wide average. In the September quarter, construction sector agreements yielded average annualised increases of 7.3 per cent, similar to the levels seen in that sector around a year ago. The WCI for the construction sector has also been increasing faster than the economy-wide average, to show an increase of 4.1 per cent over the year to the September quarter.
Inflation expectations
Consumers' inflation expectations, as surveyed by the Melbourne Institute, have been noticeably higher in 1998 than in 1997 (Graph 32). This may reflect consumers anticipating price increases for many retail goods flowing from the recent currency depreciation. The median response obtained from this survey has also been unusually volatile over the past eight months, and may be suggestive of greater uncertainty on the part of consumers. In January, the median expectation was 4.6 per cent, up sharply from 3.4 per cent in December, after oscillating across this range for several months.
Inflation expectations of those involved directly in wage and price setting have remained low, and in some cases declined further. The Australian Centre for Industrial Relations Research and Training's (ACIRRT) survey of trade union officials, conducted after the release of the December quarter CPI, obtained median forecasts for inflation of 1.8 per cent over the year to June 1999 and 2.3 per cent over the year to June 2000 (Table 13). Business surveys imply a continuation of low inflation.
|
Year to June 1999 |
Year to June 2000 |
|||
|---|---|---|---|---|
| Jan 1998 | Jan 1999 | Jan 1999 | ||
| Market economists(a) | ||||
| Headline | 2.7 | 1.6 | 2.2 | |
| Underlying | 2.7 | 1.7 | 2.1 | |
| Union officials(b) | ||||
| ‘Inflation’ | 2.0 | 1.8 | 2.3 | |
|
(a) RBA survey of financial market economists. (b) ACIRRT survey of trade union officials. This survey does not explicitly distinguish between underlying and headline inflation measures. |
||||
Financial market economists, as surveyed by the Bank, have revised down their expectations of inflation following the December quarter CPI result. The median expectation of underlying inflation for the year to June 1999 is 1.7 per cent, rising to 2.1 per cent for the year to June 2000. Expectations for the headline CPI are slightly lower in the current year, partly reflecting the impact of the health insurance rebate in the March quarter. Financial market participants also remain confident of low inflation in the longer term. The inflation expectation implied by the price of 10-year indexed bonds has declined further in recent months, to a current level of 1.8 per cent.
Inflation outlook
The inflation outlook has for some time been characterised by weak domestic inflationary pressures, combined with an expectation that exchange-rate depreciation would soon exert upward pressure on import prices. Recent developments suggest that domestic demand and output are now stronger than had earlier been expected, while the inflationary impact of currency depreciation has yet to be seen in consumer prices.
The data on import prices, as discussed above, show a sharp contrast between prices at the docks and those at the consumer level. Consumer import prices so far appear to have been unresponsive to rising prices at the docks, and have continued to decline more than a year after the Australian dollar began its sharp depreciation. While this may just mean a longer-than-normal delay in the commencement of pass-through to consumer prices, it may also be an indication that the eventual pass-through is likely to be smaller than average and to occur more slowly. On balance, the possibility of a positive, but significantly lower-than-normal, contribution of exchange-rate depreciation to inflation, which was canvassed in the November Semi-Annual Statement, is now more likely.
Domestically, inflationary pressures remain subdued although, with the economy having grown at a significantly above-trend pace over the past year, domestic cost and price pressures will, in time, be stronger than would otherwise have been the case. Inflation expectations are generally low, with the exception of those recorded in the consumer survey, which appear to envisage a significant price impact from the currency depreciation. Wage costs on average are continuing to grow at a pace that is consistent with the containment of inflation. Although there have been some large wage increases agreed in the construction sector recently, these do not appear to be spreading more widely. The CPI will also be affected by the introduction of the health insurance rebate, which will reduce the March quarter 1999 CPI. It would also be affected by the introduction of the proposed GST and accompanying changes to other taxes, which would lead to a net increase in the CPI in the following year.
Allowing for a delayed and smaller-than-usual contribution to inflation from currency depreciation, and a continuation of the fairly moderate domestic price and cost pressures, inflation is likely to rise only gradually from its current level. The Bank's assessment is that inflation excluding one-off factors will increase gradually, reaching 2 per cent by the end of 1999 and moving slightly higher over the following year. CPI inflation is likely to remain below 2 per cent during 1999, given the impact of the health insurance rebate, after which it is likely to rise to the same rate as underlying inflation. Both CPI and underlying inflation as measured would be expected temporarily to increase further during the latter part of 2000, as a result of the proposed introduction of the GST. Monetary policy will look through these one-off effects on the price level and focus on the ongoing component of inflation.
The main sources of uncertainty for the inflation outlook concern the impact of international competition, and the speed and extent of the prospective pass-through of the exchange-rate depreciation. These factors to date have contributed to lower-than-expected inflation outcomes, and the forecasts assume that the impact of exchange-rate depreciation remains smaller in the period immediately ahead than in average historical experience. Should the historical relationships re-assert themselves more strongly, a more noticeable pick-up in inflation could be envisaged. Alternatively, if international competitive pressures intensified even further, the dampening effect on inflation may be greater than currently anticipated.