Reserve Bank Bulletin – February 1997 Quarterly Report on the Economy and Financial Markets
Download the complete Report 216KB
Introduction
Recent figures have confirmed the picture of low inflation which underpinned the three easings of monetary policy that occurred between July and December 1996. Economic growth has remained moderate, but the data becoming available over the past couple of months have been firmer, on average, than those received during the second half of 1996. The outlook now is for stronger growth during 1997 than that experienced through 1996.
In underlying terms, inflation has now slowed from a rate of 3.3 per cent immediately before the easings to 2.1 per cent at present. An important reason for the fall has been the significant appreciation of the Australian dollar during 1996. Although this represents only a ‘once-off’ effect, the near-term outlook is for a continued good inflation performance.
Recent developments in the two major components of private demand – private consumption and business fixed investment – have shown contrasting patterns. Retail spending slowed through 1996, culminating in a fall in the December quarter. This degree of weakness is unlikely to continue, and most retailers have reported a better start to the new year. Private investment, in contrast, particularly non-residential construction, has been very strong, and all indications are that it will remain so. At the same time, housing construction, which has been weak for around two years, is now starting to show the first signs of recovery in the form of increased loan and building approvals.
The labour market has been lacklustre for some time, as shown by an unemployment rate which has remained at about 8½ per cent. Employment growth has not been strong enough to eat into this, but the most recent two quarters were a good deal stronger than their predecessors, even without adjusting for apparent under-reporting. Although monthly numbers are extremely volatile, underlying employment growth seems to have picked up. The various measures of vacancies show a mixed picture, with some flat and some showing a tendency to increase recently. Consumer and business sentiment are well down from their recent peaks, but have stopped falling, and may be improving slightly. The fall in retail spending in the December quarter reduced confidence, but, on the other hand, the business surveys have tended to show slightly more confidence in their most recent observations. Both businesses and households are continuing to borrow at a solid rate, with all three major categories of credit – business, personal and mortgage lending – growing at about 10 per cent per annum.
A crucial condition for the sustainability of any expansion is that wage costs be contained. Excessive rises would lead to some combination of higher unemployment or higher inflation, depending on the degree of competition in the industry concerned. For this reason, the Bank has been conscious of the need to monitor closely the growth of wages and salaries in coming to its views on monetary policy. On average, results over 1996 have been satisfactory, although outcomes from enterprise bargaining in the private sector seem to be higher than aggregate inflation and productivity trends would sustainably permit. A rise in other types of wages, which pushed them near to the increases achieved in enterprise agreements, would lead to an aggregate wage outcome which was inconsistent with the inflation objective and so have implications for future monetary policy.
Given this assessment of the outlook for inflation and growth, and the uncertainties still surrounding wage outcomes, the Bank sees current monetary policy settings as broadly appropriate for the time being.
The Australian Economy
Information becoming available recently points to a somewhat stronger tone in economic activity than appeared to be the case for much of 1996. Construction continues to increase, with very strong spending on non-residential building and engineering construction likely to be joined soon by an upturn in house building. The demand for imports, particularly those types of imports used as inputs, seems to have firmed. The demand for labour also appears to be recovering, as evidenced by a resumption of employment growth and a lift in job vacancies. At the same time, indicators of business confidence and trading conditions have also improved a little. The main weak spot in demand has been consumption, which reflects some slowing in income growth and possibly some temporary caution occasioned by the weaker employment conditions earlier in 1996. The odds are, however, that consumption will strengthen somewhat in 1997.
Business conditions
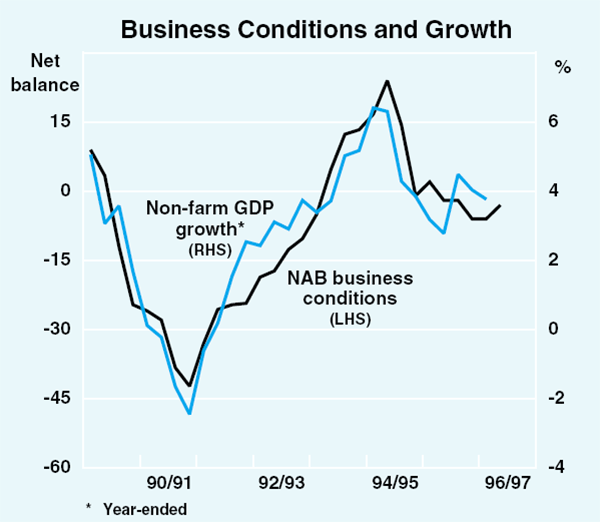
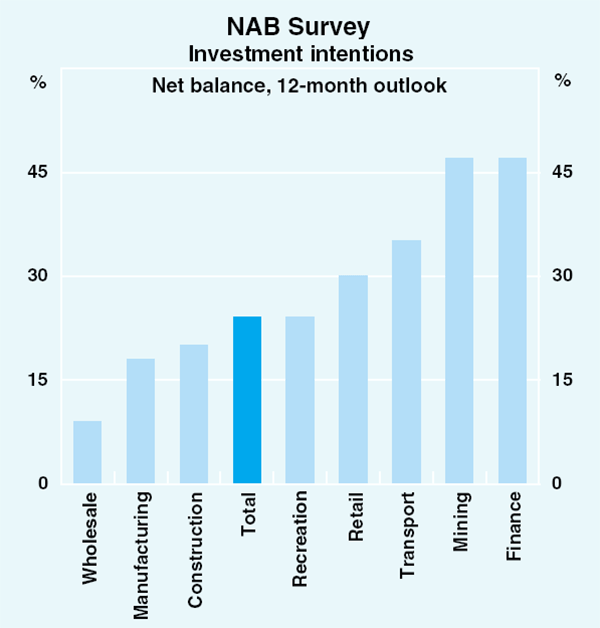
Assessments of business conditions rely heavily on various surveys of business sentiment. The latest surveys, which were taken during the December quarter, suggest some improvement in economic activity in general occurred towards the end of 1996. In the National Australia Bank's Survey of Non-Farm Businesses, for example, there was a modest improvement in aggregate business conditions (Graph 1). This survey, like most others, was conducted largely before the most recent reduction in interest rates in December. Looking over the next year, firms have become a little more optimistic about sales growth, though responses on some other questions moved in the opposite direction. The most recent ABS Survey of Business Expectations also suggests firms expect relatively strong sales and profitability in early 1997; expectations over a 12-month horizon are little changed from the previous survey.
Conditions still vary considerably across industries. Retailers have found a difficult sales environment over recent months, as consumers reduced spending in the December quarter (consumer demand is discussed in detail below). Recent liaison information, however, suggests a better January and improved confidence about the outlook over the next year.
Conditions in manufacturing appear to have improved a little overall, with quite marked differences within the industry. According to the national accounts, total manufacturing output rose strongly in the September quarter with the growth concentrated in areas such as machinery and equipment, which is consistent with the growth in business investment spending. Exports of manufactured goods have also continued to record quite strong growth.
These data are by now rather old, but recent surveys of manufacturing firms suggest an improvement in conditions in the December quarter. The Colonial State Bank and Australian Chamber of Manufacturers surveys reported that a positive net balance of firms experienced an increase in production, the first positive net balances for about two years. Most respondents to the ACCI-Westpac survey expect conditions to improve in the March quarter. Data from the ABS on manufacturers' expectations of sales also point to further reasonable aggregate growth; the second estimate for 1996/97 is 5.7 per cent above last year's corresponding figure. These surveys also highlight the differences in prospects between different parts of manufacturing, with sales in the machinery and equipment sector expected to increase by 19.4 per cent, while elsewhere, sales are expected to rise by just 2.5 per cent. In some areas of manufacturing, particularly in those sectors not producing investment goods, stock levels may be a little high; as a result, stronger sales growth in these sectors may take some time to translate fully into higher production.
Looking at other sectors, the December quarter NAB survey reports that conditions improved in recreation, construction and transport. Some previously strong sectors, such as business and financial services and mining, reported a weakening.
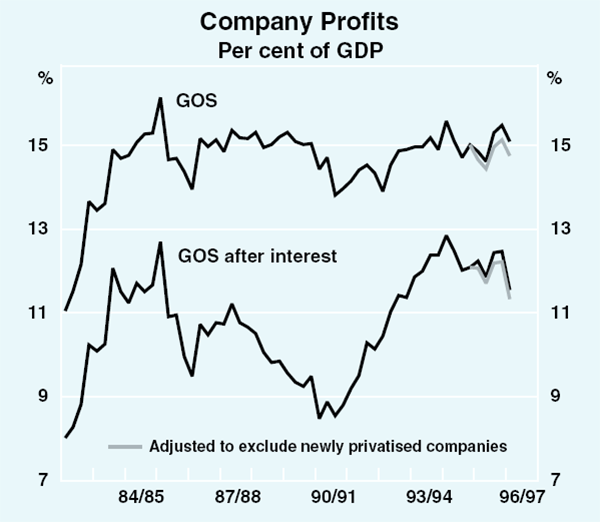
Company profitability also varies by industry and along similar lines. The profitability of retailers has been constrained by sluggish demand. In a number of other industries, the impact of high wages growth in 1994 or international competition is keeping profits in check. Overall, the aggregate data suggest that profitability is a little lower than it was a couple of years ago. As a share of GDP, corporate gross operating surplus is around its average level for the past decade, after adjusting for newly privatised companies (Graph 2). In the September quarter, measured profits (after interest) appear to have been distorted by an increase in measured interest payments associated with the rotation of firms in the Company Profits Survey. In underlying terms, companies should benefit from recent falls in bank lending rates which should reduce their debt servicing burdens.
In the early years of the 1990s, the combination of reasonable levels of profitability and relatively low levels of investment allowed the corporate sector to restructure its balance sheet. This process now appears to be complete, with the debt-equity ratio of listed companies in 1995/96 increasing for the first time in five years. Ongoing investment growth implies that further rises in gearing are occurring. Business loan approvals remain at a high level. After allowing for the effect of recent privatisations, business credit grew at an annualised rate of 9.4 per cent in the six months to December 1996. For an economy recording 2 per cent inflation, this is a solid rate of growth. New equity raisings were strong in the month of December and may increase over the coming months as a result of the strong share market; nevertheless they remain a relatively minor source of corporate funding.
Business investment
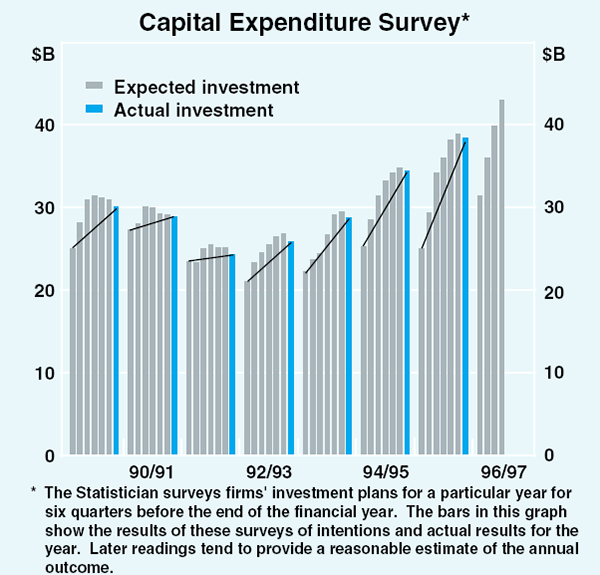
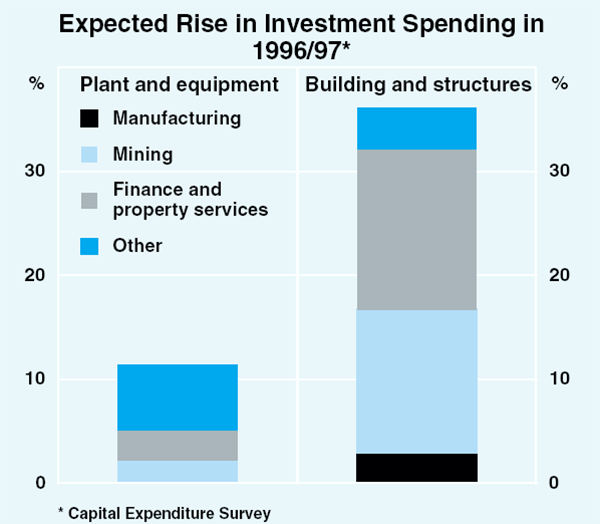
In the Capital Expenditure Survey conducted in October and November, investment expenditure in 1996/97 was estimated to be 19 per cent higher than the corresponding figure for 1995/96 (Graph 3). Growth of around this magnitude would take the ratio of private business fixed investment to nominal GDP to only slightly above its average level of the 1980s. Growth is expected to be concentrated in the mining, finance, property and business services and private-sector infrastructure sectors. Strong growth is also expected in the accommodation and sport and recreation industries; in contrast, firms in the manufacturing and wholesale trade industries are expecting relatively small increases in investment (Graphs 4 and 5).
Recent information supports, and if anything strengthens, the earlier picture that a very solid upswing in investment spending is under way. National accounts data for the September quarter show a rise of about 6 per cent in business fixed investment, and an increase of 19 per cent over the year to September. Plant and equipment investment was stronger than suggested by imports of capital goods, reflecting a sharp run-down in wholesalers' stocks of machinery and equipment and an increase in domestic production. Data on imports of capital goods suggest that investment in plant and equipment may have been soft in the December quarter, but there seems little doubt that the trend in investment is quite clearly upward.
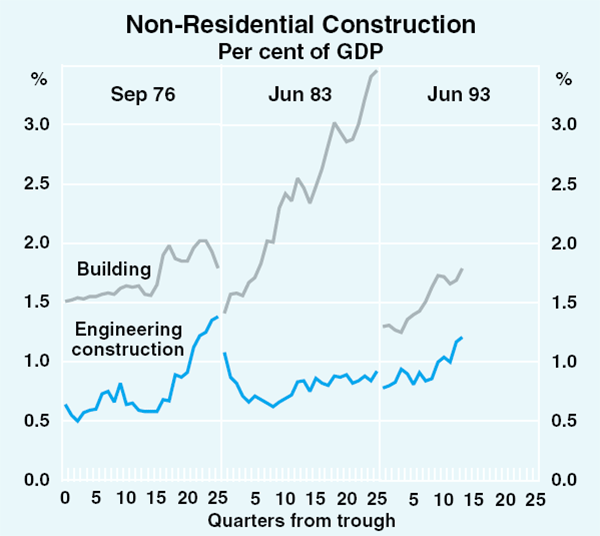
The stronger part of investment, however, is in non-residential construction, both building and engineering construction. Private building approvals, in value terms, rose further in the December quarter, to equal their peak in the late 1980s. There are a number of quite large projects now getting under way, including some related to the Olympics. Engineering construction is already well above its peak in the late 1980s and as a share of GDP is close to the peak of the early 1980s (Graph 6). This has been driven by a number of large private-sector infrastructure works, such as Victoria's Citylink road project as well as mining and resource-related developments. According to the Access Investment Monitor, resource-related projects under consideration have almost doubled over the past year to $35 billion.
The positive investment outlook reflects relatively optimistic expectations regarding the medium-term future of the Australian economy. Much of the investment is infrastructure related, or in the mining sector, and is not being undertaken solely in response to expected movements in the domestic business cycle. The investment is also being supported by relatively favourable financial conditions. While profitability has been squeezed in some areas, the share market has risen and company balance sheets are strong. Monetary policy settings are supportive of investment as well. Nominal lending rates are low by historical standards and ‘real’ rates, as conventionally measured, are only slightly higher than they were in the second half of 1993, when policy settings were designed to help stimulate a weak economy.
Housing investment
This upswing in business capital expenditure is likely soon to be augmented by dwelling investment, as evidence accumulates that the housing sector is in the early stages of an upturn (Graph 7). New lending approvals have picked up noticeably in recent months with growth in all categories of lending, but particularly for purchases of established and newly erected dwellings by owner occupiers.
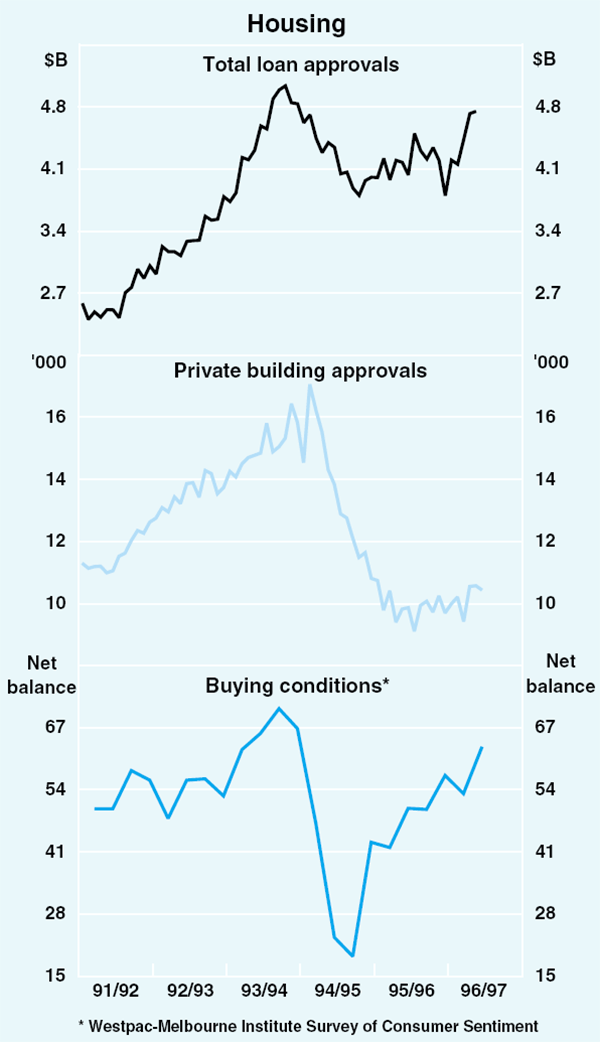
As has been the case in past cycles, the lift in financing activity is starting to be reflected in local government building approvals, which have begun to increase. Data for November and December suggest that the rise is now spreading to approvals for houses, whereas earlier it was confined to approvals for multi-unit buildings. The number of commencements of new private dwellings, having fallen in the September quarter, is expected to have risen in the December quarter, and should continue to move ahead thereafter.
Here again, financial conditions are favourable for expansion. The recovery in loan approvals follows declines in mortgage interest rates in the second half of 1996 which, combined with relative stability in house prices, have improved the demand for housing. The CBA/HIA measure of housing affordability is at its highest recorded level, and the Westpac-Melbourne Institute Survey of Consumer Sentiment suggests that, at present, households regard it as a very good time to purchase a house.
Housing construction activity is also likely to be underpinned by the low rental vacancy rates of the past year, particularly in Sydney and Melbourne. It is therefore apparent that conditions are right for a cyclical upswing in housing, though pockets of excess dwelling supply which persist in some regions will probably mean that in the short run, the pick-up may be more uneven, and overall not quite as strong, as those in the past.
Consumption
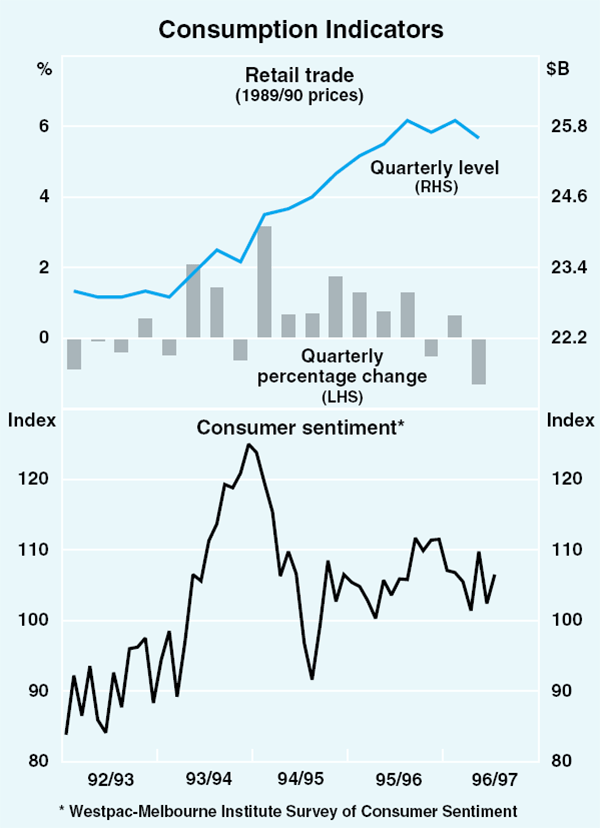
Consumer demand was weak during the second half of 1996, with retail trade data showing no advance in retail spending over the second half of the year. In real terms, retail trade, as estimated by the ABS, fell by over 1 per cent in the December quarter, to be largely unchanged from a year earlier (Graph 8). This occurred after quite a weak showing in the September quarter, when private consumption rose by 0.3 per cent according to the national accounts. The slowdown in consumption growth appears to be broadly based, with growth in expenditure on both goods and services declining. (One exception, largely in response to exchange rate-induced price falls, is purchases of household appliances, which in nominal terms have risen by around 10 per cent over the past year.) The overall weakness accords with indications from major retailers who, as noted above, reported difficult trading conditions in the second half of 1996.
The slowing in aggregate consumption growth comes after a period of several years during which consumption expenditure rose quite quickly, and if anything outpaced the rise in household income, with a concomitant fall in the saving ratio. That rise occurred during the period of stronger overall growth, and quite buoyant consumer sentiment. More recently, household income growth may have slowed a little. A more cautious attitude may also have prompted consumers to contain their spending. The generally pessimistic tone of public discussion about the course of the economy, especially the labour market, may have aroused concerns over the possibility of higher unemployment. There is some evidence for this in the question about unemployment asked of respondents to the Westpac-Melbourne Institute's Survey of Consumer Sentiment.
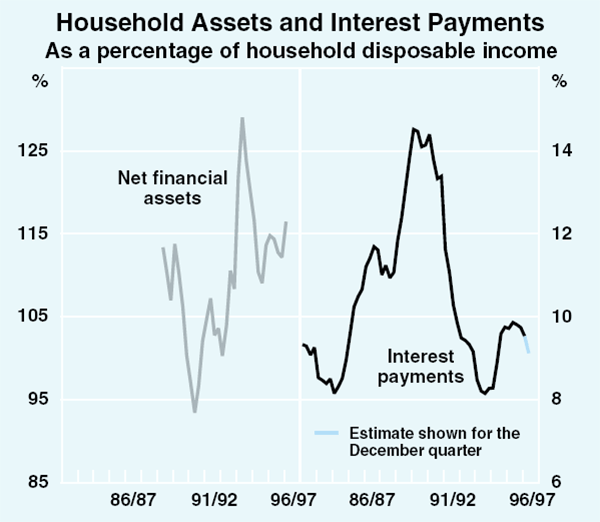
The slowing in consumption does not appear to be forced on households by immediate financial considerations. Household balance sheets remain in relatively good shape. Over the past year, households' net financial assets have increased faster than household disposable income; at the same time, the household sector's interest servicing burden has declined (Graph 9). Much of the increase in households' assets has been concentrated in holdings of managed funds, including superannuation, with around one-third of the total increase being accounted for by valuation effects arising from the strong share market. There also appears to be little reluctance amongst households, in aggregate, to take on more debt. Total consumer credit – that is, personal credit plus housing credit – grew at an annual rate of around 10 per cent over the six months to December.
It is likely that consumption growth will pick up to some extent in 1997. Reports from retailers suggest that sales since Christmas have been considerably stronger than in the second half of 1996. Firmer labour market conditions (see below) should also see household incomes and spending on a rising trend, with short-term uncertainties receding.
The strength of any such pick-up in consumption remains to be seen. To the extent that households may be increasing in a structural way the amount of savings they put aside from current income, of course, that can only be regarded as to the good of longer-term economic performance: Australia still suffers from a disturbing lack of saving. In recent years, household saving in particular has fallen to levels which are very low by the standards of other developed countries. Moderate, rather than strong, growth in consumption would be most appropriate over the coming year.
The labour market
Conditions in the labour market have improved over recent months. According to the published labour force statistics, employment rose by 0.5 per cent in the September quarter, and by a further 0.4 per cent in the December quarter. This follows a period of virtually no growth in the first half of 1996. The rate of unemployment, at 8.6 per cent, is little changed from levels over the past year or so.
The ABS has reported that the changes to methodology in the Labour Force Survey appear to have led to growth in employment being underestimated over recent months. A change in survey technique seems to have resulted in some individuals reporting that they are not in the labour force, when previously they would have reported that they were employed. Had the change in survey procedures not taken place, the ABS estimates that recorded employment growth would have been noticeably stronger over the past few months (Graph 10). Statistics adjusted for the changed survey technique yield annualised growth in the second half of 1996 of around 2½ per cent.
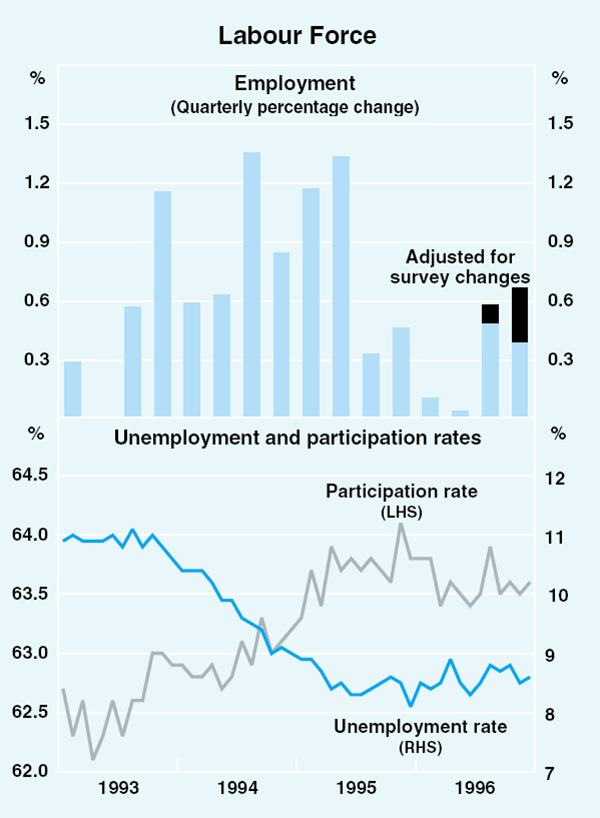
Other labour market indicators generally also show a firmer picture. The ABS measure of job vacancies increased by 7.9 per cent over the three months to November, with the bulk of the increase in private-sector vacancies. The ANZ Bank's measure fell by 2.9 per cent during the December quarter, but showed a marked rise in January. This series and the DEETYA skilled vacancies series, which have tended to be weak, are based solely on newspaper job advertisements, and may be more sensitive to reductions in advertising for public-sector positions than the ABS series. Overtime hours worked per employee increased over the three months to November, the first rise since the beginning of 1996. Consistent with this, data for average weekly earnings show an increase in overtime earnings in the December quarter.
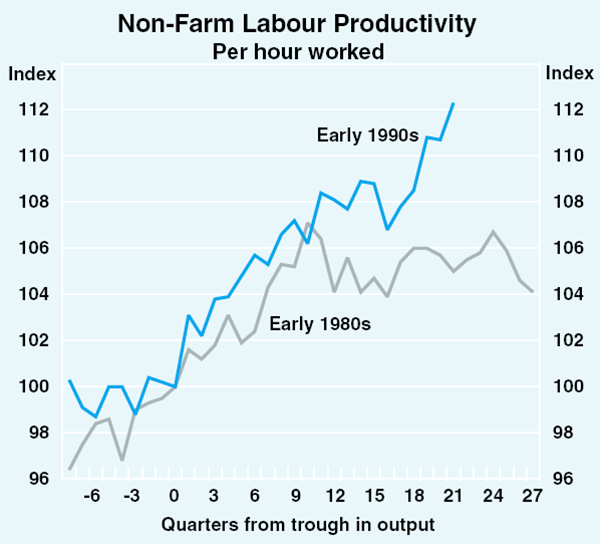
The strong productivity growth evident in the initial stages of the recovery from the early 1990s recession has continued well into the expansion (Graph 11). Since the trough in output in mid 1991, private-sector labour productivity has grown at an average annual rate of 2 per cent, well above the productivity gains made during recovery from the early 1980s recession. On the most recent data, this shows no sign of slowing. Economy wide, labour productivity seems to be growing at a trend rate of around 1¾ per cent per annum. Strong investment growth and ongoing structural reform should contribute to further solid productivity gains, which are ultimately the underpinning for sustainable increases in real incomes.
The external sector
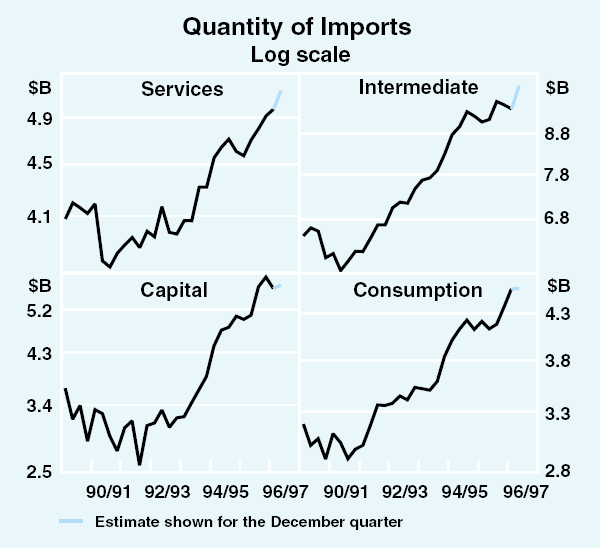
Import volumes look to have increased by 4 per cent in the December quarter, after a decline of 0.6 per cent in the September quarter. There was a sharp rise (7 per cent) in imports of intermediate goods, while consumption imports weakened in line with softer demand. Imports of capital goods rose marginally (Graph 12).
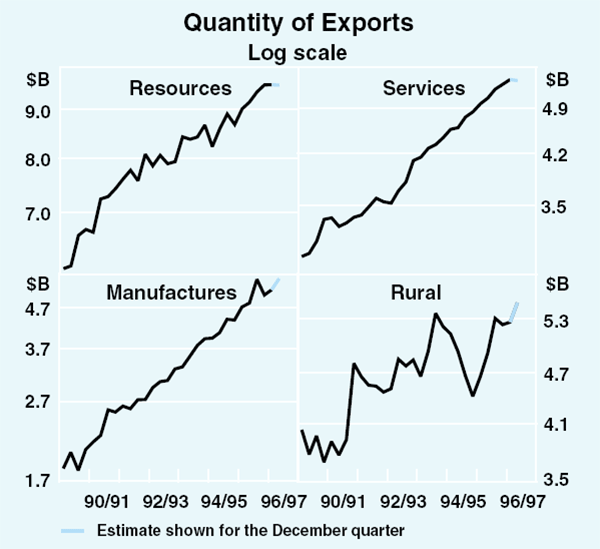
Export growth picked up in the December quarter, following little growth in the previous two quarters. A sharp rise in manufactured and rural exports, with the latter reflecting shipments of the record wheat crop, were the main contributors to growth. In contrast, resource exports showed little growth through the second half of last year (Graph 13).
The current account deficit increased through the second half of 1996, from a low point of around 3½ per cent of GDP in the June quarter. By the end of 1996 it was running at about 4¼ per cent of GDP. This increase reflects a rise in both the goods and services and net income deficits. At least in part, the widening in the former reflects a fall in the terms of trade of around 1 per cent over the second half of 1996.
Public finance
The Commonwealth Government's Mid-Year Review of the Budget showed a significant deterioration in the projected budget deficit for 1996/97 and subsequent years. In 1996/97, the underlying budget deficit is now expected to be $8.5 billion (1.7 per cent of GDP), an increase of $2.9 billion from the budget-time estimate. This deterioration largely reflects a shortfall in company tax revenue and a number of one-off payments. In subsequent years, the increase in the expected deficit primarily reflects the lowering in the Government's forecasts for wages growth and inflation, although a decline in the company tax base also has an effect. The lower wage and inflation forecasts reduce projected revenue collections, but have a smaller effect on projected outlays. As a result, on current policy assumptions, a budget surplus in underlying terms is now not anticipated until 1999/2000, a year later than previously expected.
Based on the Commonwealth's Mid-Year Review and ABS estimates, the underlying PSBR – that is, the PSBR adjusted for net advances – is estimated to be 1.7 per cent of GDP, compared with 1.2 per cent in 1995/96 and 2.0 per cent in 1994/95. The fiscal consolidation by the Commonwealth in 1996/97 is more than offset by a deterioration in both the State general government and PTE sectors. However, in the following year, Commonwealth fiscal consolidation is likely to see a sizeable improvement in the PSBR.
| 1996/97 | 1997/98 | 1998/99 | 1999/2000 | |
|---|---|---|---|---|
| 1996/97 Budget estimate of underlying balance |
−5,605 | −1,504 | 1,002 | 5,716 |
| – % of GDP | −1.1 | −0.3 | 0.2 | 0.9 |
| Less revisions since 1996/97 Budget | ||||
| Policy decisions | 1,048 | −325 | 288 | 301 |
| Parameter revisions | 1,719 | 2,537 | 2,643 | 3,519 |
| Senate amendments(a) | 45 | 211 | 223 | 228 |
| Revised underlying balance | −8,490 | −3,926 | −2,152 | 1,668 |
| – % of GDP | −1.7 | −0.7 | −0.4 | 0.3 |
|
(a) Includes Senate amendments not accepted by the Government; those accepted by the Government are included in policy decisions. Source: Mid-Year Economic and Fiscal Outlook, 1996–97, Commonwealth of Australia |
||||
Private finance
Financial intermediation is running at a pace consistent with steady economic growth. Over the second half of 1996, total credit extended by Australian financial institutions (adjusted to exclude the effects of privatisation activity on the business credit component) grew at an annual rate of around 10 per cent. Growth was broadly similar across the major components.
|
3-month annualised rate |
6-month annualised rate |
|||
|---|---|---|---|---|
| Sep 1996 | Dec 1996 | Jun 1996 | Dec 1996 | |
| Currency | 2.6 | 1.8 | 3.5 | 2.2 |
| Broad money | 9.7 | 11.3 | 8.8 | 10.5 |
| Total credit | 10.8 | 8.8 | 11.5 | 9.8 |
| Business | 10.1 | 8.8 | 11.8 | 9.4 |
| Housing | 9.8 | 9.6 | 11.3 | 9.7 |
| Personal | 17.7 | 5.9 | 11.2 | 11.7 |
| NB: Business and Total credit adjusted for privatisations. | ||||
Intermediaries funded this expansion through both domestic raisings of funds and off-shore borrowing. Broad money – a measure of the public's holdings of the liabilities of intermediaries – grew at an annual rate of around 10 per cent over this period. The public's demand for currency, in contrast, grew only slowly at an annual rate of just above 2 per cent over the second half of 1996. This may be associated with subdued consumer spending.
Inflation Trends and Prospects
Trends in labour costs
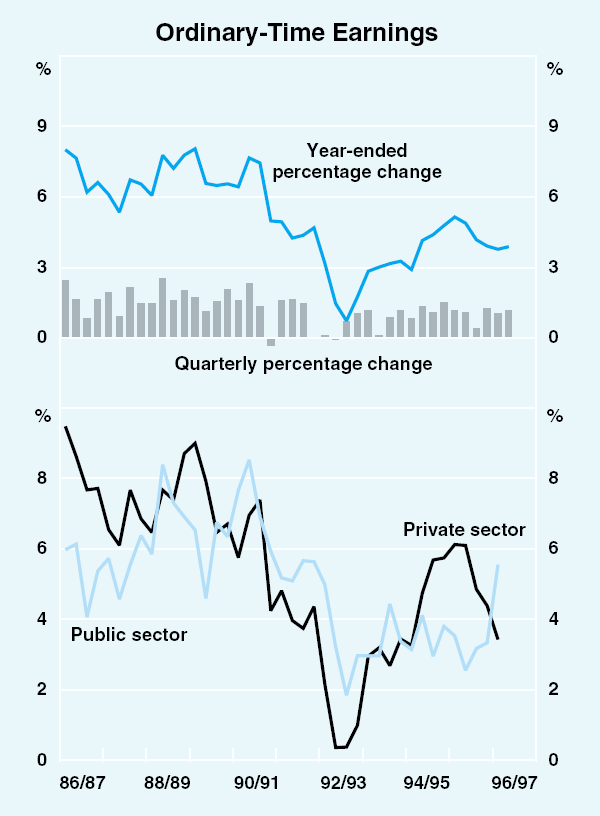
Ordinary-time earnings of adults working full time (AWOTE) increased by 1.2 per cent during the three months to November 1996, and by 3.9 per cent over the year (Graph 14). A break down of this relatively high quarterly result into earnings in the private and public sector is not yet available. This information is more than usually important at present, because over recent quarters there has been a substantial pick-up in measured earnings in the public sector. Over the year to August, public-sector AWOTE rose by 5.5 per cent; in the six-month period ended August, it rose at an annual rate in excess of 8 per cent. In the private sector, by contrast, AWOTE has grown more slowly, and in August was only about 3½ per cent higher than a year earlier.
The strength of public-sector AWOTE is unusual, in light of the fact that the coverage of enterprise bargains in the public sector is very wide, and the bulk of enterprise bargains struck are delivering increases of about 4 per cent per annum. A possible explanation may be compositional change within the public sector, if declines in public-sector employment have been concentrated amongst people on below-average earnings. If measures of public-sector wages are being distorted at present, and if this is affecting the overall wage measures, then it may not be appropriate to draw firm conclusions from the strong growth in AWOTE over recent quarters.
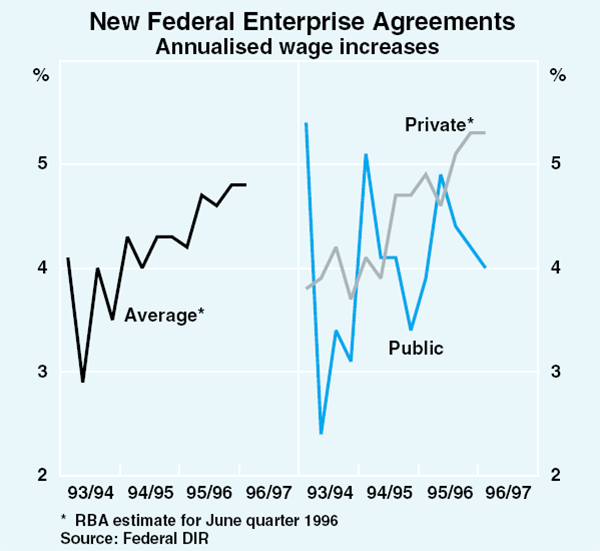
That said, some important issues remain unresolved in the debate over wages. There is considerable variation in growth in wages between different segments of the labour market. Award rates of pay have risen by much less than average earnings, while the rate of wage rises negotiated in new enterprise agreements remains high (though these statistics are now dated). Annualised wage rises in new enterprise agreements in the September quarter averaged 4.8 per cent, similar to the outcome recorded in the June quarter (Graph 15). In the private sector, annualised wage rises in new agreements averaged 5.3 per cent in both the June and September quarters. Growth in executive salaries, meanwhile, remains even faster. The Cullen Egan Dell survey of skilled employees reported that executive salaries grew by 6 per cent over the year to the December quarter, little changed from rates in 1995. Growth in non-executive salaries in this survey appears to have stabilised at around 4½ per cent.
The considerable dispersion in wage rises currently seen in the economy can create pressures for ‘catch up’ in an effort to restore earlier relativities. The ACTU's Living Wage claim is a clear example. The claim seeks an increase in minimum award wages of 8.75 per cent over the next year and 30 per cent over the next three years. The Bank's estimate is that if the first stage of the claim were to be granted in full, the direct effect would be to contribute an additional 1.6 percentage points to aggregate wage growth. This assumes, perhaps unrealistically, that there would be no flow-on effects to higher-paid workers. Such a large increase in minimum award wages could well generate pressure for increased wages elsewhere in the labour market, leading to an even more substantial rise in aggregate wage growth. It would also, almost certainly, adversely affect employment prospects, particularly for relatively unskilled workers.
Recent developments in inflation
In underlying terms, consumer prices increased by 0.4 per cent in the December quarter 1996, and by 2.1 per cent over the year (Graph 16). This compares with an annual rate of 2.4 per cent in September.
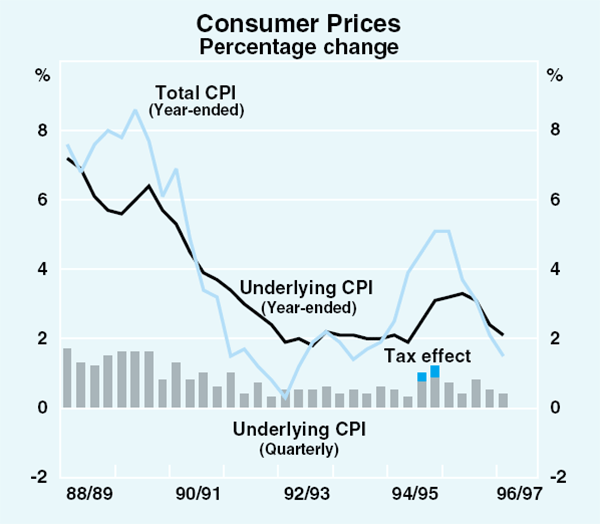
The headline CPI rose by 0.2 per cent in the quarter, bringing the year-ended inflation rate to 1.5 per cent, down from 2.1 per cent in the September quarter and well down from its recent peak of 5.1 per cent in the December quarter 1995. The falls in mortgage interest rates announced in June and August subtracted 0.5 of a percentage point from the quarterly CPI result.
Broader national accounts measures confirm that annual rates of inflation are decelerating. Over the year to September, the fixed-weight deflator for private consumption rose by only 1.4 per cent, while that for GDP rose by 1.7 per cent, both substantially smaller rises than a year earlier.
Sectoral differences in price movements confirm an important role for the exchange rate, but also point to a more broadly based easing of inflationary pressure. Final retail prices of imports have been falling. In addition to this, falling input prices, weaker than expected sales and intense domestic competition have helped contain the growth in goods prices more generally. Services price inflation is also abating.
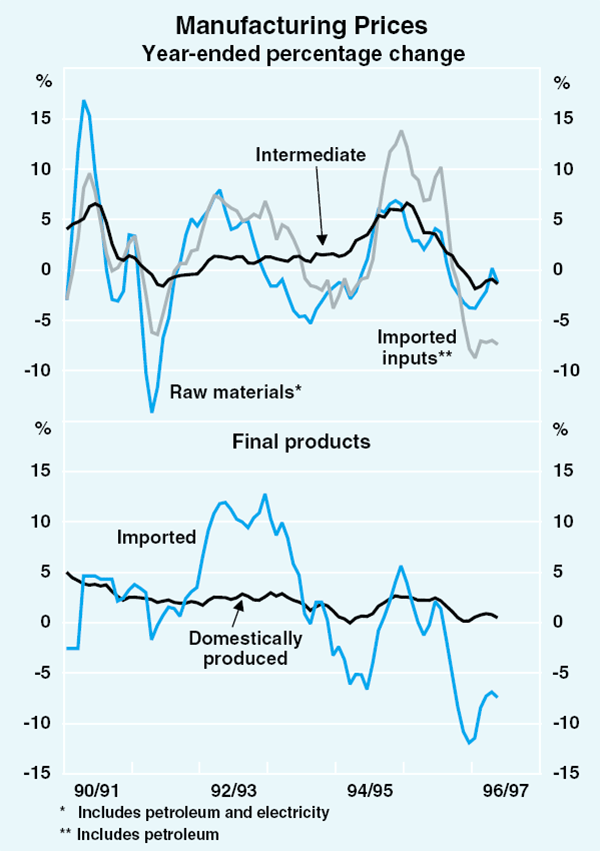
Continued weakness in wholesale prices suggests that consumer price inflation will remain subdued in coming quarters (Graph 17). Although the prices of raw materials strengthened slightly in recent months, they remain well down on levels of a year ago. The prices of most other domestic and imported inputs have been flat or falling for the past year. In addition, the wholesale prices of final imports continue to fall, reducing the pricing power of domestic producers. Reflecting lower non-labour input costs, and increased competition, the price of domestically produced final manufactured goods rose by only 0.5 per cent over the year to November.
| September quarter | December quarter | Over latest three months | Year to latest | |
|---|---|---|---|---|
| Consumer prices | ||||
| Consumer price index (CPI) | 0.3 | 0.2 | 1.5 | |
| Underlying CPI | 0.5 | 0.4 | 2.1 | |
| Private-sector goods & services | 0.3 | 0.5 | 2.0 | |
| Fixed-weight private consumption deflator | 0.3 | – | 1.4 (Sep) | |
| Producer prices | ||||
| Final manufacturing prices | ||||
| – domestic(a) | 0.3 | – | 0.1 | 0.5 (Nov) |
| – imported(a) | −0.7 | – | −1.7 | −7.4 (Nov) |
| Domestic input prices | ||||
| – raw materials | −1.6 | – | 0.5 | −1.2 (Nov) |
| – intermediate(a) | −0.3 | – | −0.4 | −1.4 (Nov) |
| Imported inputs | −2.7 | – | −1.3 | −7.4 (Nov) |
| Oil prices(b) | 3.6 | 9.0 | 1.3 | 33.5 (Jan) |
| Import prices | ||||
| Import price index(a) | −1.1 | – | −1.6 | −7.5 (Nov) |
| Imported component of CPI | −0.6 | −0.2 | −0.6 | |
|
(a) Excluding petroleum. (b) West Texas crude. |
||||
Inflation expectations
In recent months there has been a reduction in inflation expectations of both producers and financial markets, influenced by the recent falls in inflation.
In the near term, business surveys point to continued weak growth in selling prices (Graph 18). A net balance of 11 per cent of respondents to the latest ACCI-Westpac survey recorded falling selling prices in the December quarter, continuing the pattern of unrealised expectations that has become evident over the past year. For the March quarter, expectations fell once again. The ABS survey also suggests continuing low price pressures; selling prices are expected to rise by just 0.1 per cent in the March quarter, the lowest recorded quarterly expectation for this survey. Over the coming year, a rise of only 0.9 per cent is expected. Respondents to the latest NAB survey expect a rise of 0.4 per cent in the March quarter. There also appears to have been some decline in consumers' inflation expectations as measured by the Melbourne Institute.
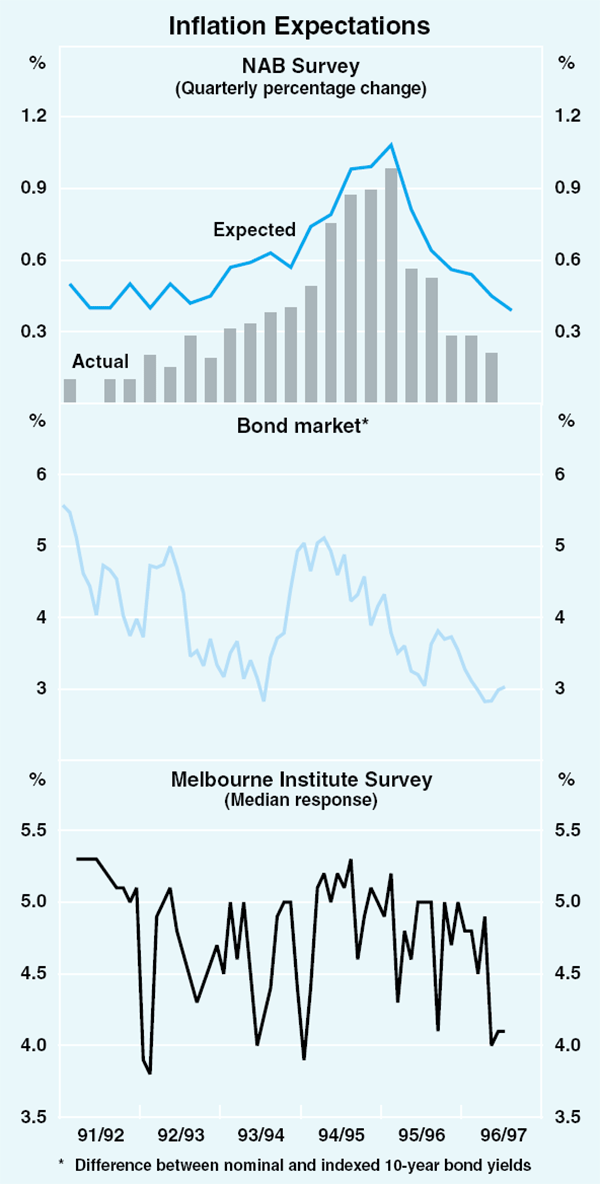
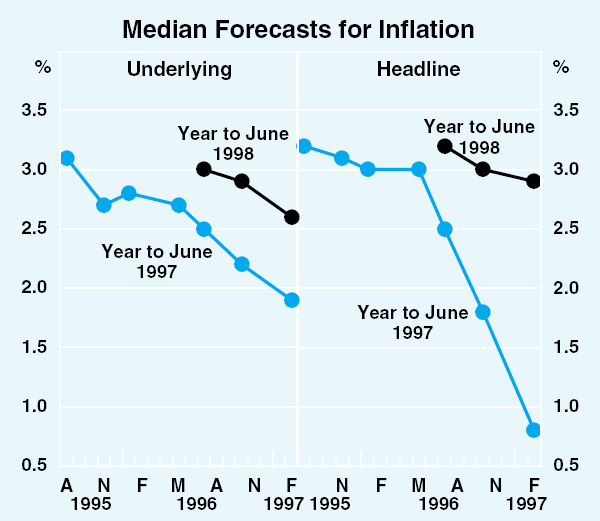
Financial market participants have also lowered their expectations. The gap between the yield on indexed and conventional bonds fell in the December quarter. Currently it suggests that investors in bond markets in Australia expect inflation to average around 3 per cent over the next decade. This has fallen from around 3½ per cent in the middle of last year and 5 per cent in mid 1994. Financial market economists, surveyed by the Bank in February, have lowered their median forecasts for underlying inflation over the year to June 1997 to 1.9 per cent, down from 2.2 per cent in the previous survey. The median forecast for headline inflation over the year to June 1997 is 0.8 per cent, down sharply from 1.8 per cent in the previous survey due to the recent round of mortgage interest rate reductions. Looking further ahead, the median forecast for underlying inflation over the year to June 1998 is 2.6 per cent, with headline inflation expected to be slightly higher (Graph 19).
Longer-run inflation expectations are also declining, though further adjustment is required. In recent quarters, the NAB survey has reported that the proportion of producers who expect inflation to exceed 4 per cent for the remainder of the decade has fallen sharply. While this is encouraging, the majority of producers still expect inflation in the remainder of the decade to average between 3 and 4 per cent; that is, clearly above the Bank's target of 2–3 per cent.
Inflation outlook
In the near term, the Bank expects the recent good performance on inflation to be maintained. This reflects the continuation of influences which are already at work. With the trade-weighted exchange rate around its current level, the effects of the appreciation of the currency during 1996 will continue to be felt for some time yet. The moderate average wages growth over recent quarters will also be beneficial. In the very short term, sluggish consumer demand may also exert an unusually high degree of price discipline on retailers, though this weakness in spending will most likely pass as 1997 progresses. On current indications, barring unforseen changes in the exchange rate or labour costs, underlying inflation could be maintained around 2 per cent during 1997. At this point, the Bank expects inflation to be in the 2–3 per cent range in 1998.
Headline inflation will remain clearly below the underlying rate for the next few quarters. Reductions in mortgage interest rates and credit charges will continue to detract substantially from headline inflation in the March and June quarters, and the annual headline rate should fall to around 1 per cent, possibly even a little less, by mid 1997. This may help cement the reduction in inflation expectations. Should this also lower the starting point for wage negotiations, it would help to generate an environment in which low rates of inflation could be combined with improved economic growth for an extended period.
The main uncertainty to the outlook for inflation (and for employment) remains labour costs. Specifically, has the period of labour-market weakness, particularly in the first half of 1996, set in train any downward pressure on the size of wage increases obtained in enterprise agreements? Will the pace of ‘safety-net’ increases, which have been running at 1½ to 2 per cent over recent years, pick up as a result of the current wage case, and if so by how much?
To provide room for faster employment growth with good control over inflation, some moderation in wage increases given in enterprise agreements, and prudence in adjusting minimum wages, are two very important ingredients.
International Economic Conditions
The international economic situation provides a good, but not particularly stimulating, environment for the Australian economy. Amongst the major countries, industrial output has picked up over recent months, and this has lifted base metal prices. GDP growth amongst the OECD group of countries is expected to be about 2½ per cent in 1997, about the same as 1996. The IMF is presently forecasting growth in world output, which includes the faster-growing Asian region, of around 4 per cent. This global growth should support most commodity prices and demand for Australian exports as well as underpin a reasonable level of business confidence.
Conditions vary considerably across the major economies. After six years of growth, the US economy continues to expand solidly, and growth around trend is expected over the coming year. In Japan, despite some encouraging signs, growth has been uneven and confidence is at a low ebb. While the depreciation of the yen should help support activity, the approaching fiscal consolidation and depressed share prices are working in the other direction. Elsewhere in Asia, growth prospects appear to be improving in response to easier monetary conditions and a recovery in the world electronics market. In Europe, growth remains relatively slow, with structural rigidities and fiscal consolidation programs weighing on the expansion.
Inflation in the industrialised economies remains unusually subdued. The price environment, while reflecting to some extent the slightly weaker nature overall of the present expansion compared with those in the past, bodes well for its longevity.
United States
The United States economy continues to perform well, with solid output growth and subdued inflation (Graph 20). Real GDP rose by 1.2 per cent in the December quarter reflecting stronger consumption and net exports. Strong investment has meant that despite industrial production continuing to grow at a healthy pace, capacity utilisation remains below the high levels of early 1995. Solid growth in output is ensuring continuing employment growth, with the level of employment increasing by 2.5 per cent over the year to January. The unemployment rate is currently 5.4 per cent, down slightly on the level a year ago.
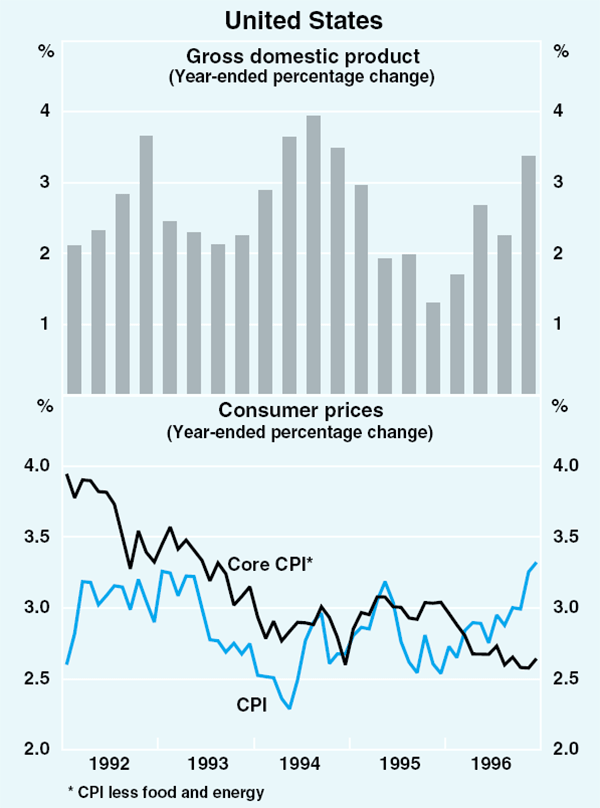
The tight labour market is putting some upward pressure on wages. Over the year to the December quarter, average hourly wages increased by 3.4 per cent, the highest outcome for six years. Despite this, broader measures of labour cost growth show little sign of a pick-up, as continuing rationalisation of the health insurance industry is reducing growth in non-wage costs; over the year to the December quarter, the Employment Cost Index rose by 2.9 per cent. The moderate labour cost increases are helping sustain low inflation. Core consumer prices rose by 2.6 per cent over the year to December, while core producer prices rose by just 0.6 per cent. Headline measures of inflation have been somewhat higher, primarily as a consequence of relatively large increases in energy and food prices. There is, however, little sign as yet that these price increases are flowing through into more general pressure on prices.
Asia-Pacific
Recent indicators of the Japanese economy suggest some pick-up in the pace of growth after a flat spot in the middle of 1996 (Graph 21). Current assessments are complicated, however, by the possibility that expenditure by consumers and businesses is being brought forward in response to an announced increase in the value-added tax (VAT) to take place in April. The recent strength of purchases of passenger motor vehicles and other consumer durables, and orders of industrial machinery, have been widely attributed to this future increase in tax. Thus, while stronger demand has led to industrial production recording solid rises over recent months, this has not helped confidence.
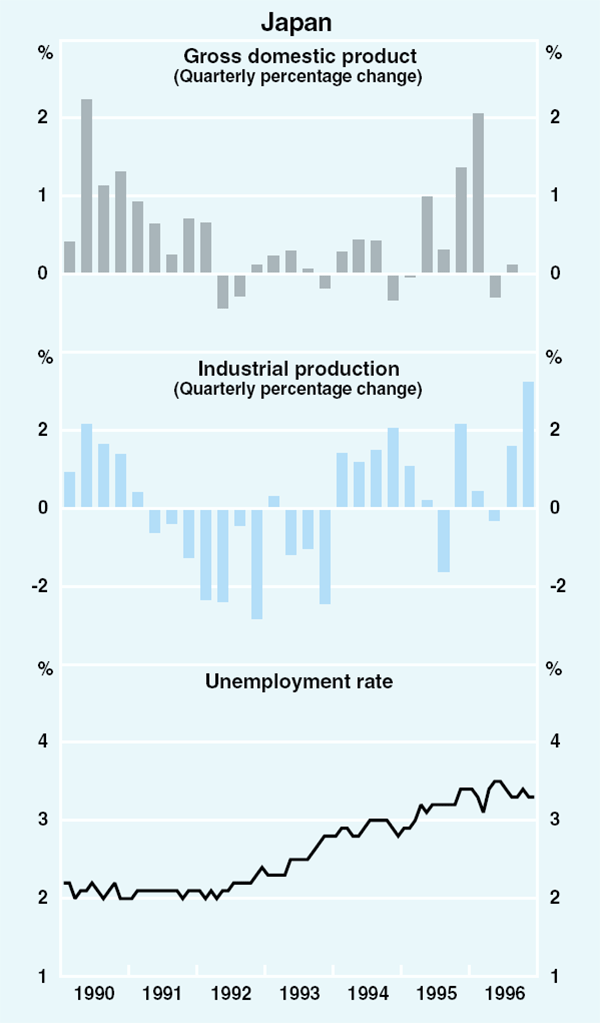
The Bank of Japan's November Tankan survey reported only a relatively small improvement in business sentiment, and employment has fallen in recent months. The unemployment rate, at 3.3 per cent in December, is close to its post-war peak. Not surprisingly, there are no inflationary pressures; core consumer prices increased by 0.3 per cent over the year to December.
Looking forward, the recent depreciation of the yen has improved prospects for the Japanese economy, and the external sector may make a significant positive contribution to GDP growth in 1997. Continuing low interest rates should help support aggregate demand. The fall in the share market and the impending fiscal consolidation, however, may exert dampening influences.
Elsewhere in Asia, growth has generally eased over the past year (Table 4). This reflects the combined effects of weak global demand for electronics products, a tightening of monetary conditions in 1995 and exchange rate appreciations in several countries. There are, however, tentative signs that growth will pick-up in 1997, with China again likely to lead the region. Stronger industrial production in the industrialised countries, recent monetary policy easings and a run down in stocks of electronics products are favourable cyclical influences in a number of countries.
| Real GDP |
Consumer prices |
||
|---|---|---|---|
| Previous year | Latest reading | ||
| China | 10.5 | 9.7 | 6.9 |
| Hong Kong | 2.5 | 5.1 | 6.7 |
| Indonesia | 8.1 | 7.5 | 5.2 |
| Malaysia | 8.9 | 8.0 | 3.3 |
| New Zealand | 3.1 | 2.2 | 2.4 |
| Philippines | 4.4 | 5.2 | 5.0 |
| Singapore | 9.8 | 3.2 | 2.0 |
| South Korea | 6.8 | 7.0 | 4.7 |
| Taiwan | 4.5 | 6.6 | 2.0 |
| Thailand | 8.6 | 6.6 | 4.3 |
|
Sources: National Governments. |
|||
In South Korea – Australia's second largest merchandise export destination – growth slowed significantly in 1996. Export growth has moderated and the subsequent reduction in profits has adversely affected manufacturing investment. Large wage rises and labour-market unrest are also having adverse effects. In contrast, output growth in China remains robust, despite a modest slowing as firms run down excessive inventories, and the Hong Kong economy appears to be recovering, with firming business and consumer confidence reflected in stronger indicators of economic activity.
In the South-East Asian economies, the overheating pressures which were evident in 1995 are receding. In Indonesia, Thailand and Malaysia growth remains firm, albeit a little weaker than a year earlier. In Singapore, continued weakness in manufacturing output and exports slowed growth to only a little above 3 per cent over the year to September.
In New Zealand, the pace of growth remains relatively subdued, with the Reserve Bank of New Zealand forecasting growth of 1.3 per cent over the year to March 1997. The underlying inflation rate over the year to December was 2.4 per cent; it is expected to decline over the course of 1997.
Europe
Economic activity in the major European economies has continued to expand, but rather slowly, and the recovery lacks momentum. Across the region growth is being encouraged by quite low real interest rates and more competitive exchange rates which have seen solid rises in foreign demand. The recovery continues to be hampered, however, by low consumer and business confidence, in part because of the anticipated effects of ongoing regional fiscal consolidation. Despite these factors, the OECD forecasts GDP in the European Union to rise by 2.4 per cent in 1997, up from an estimated 1.6 per cent in 1996.
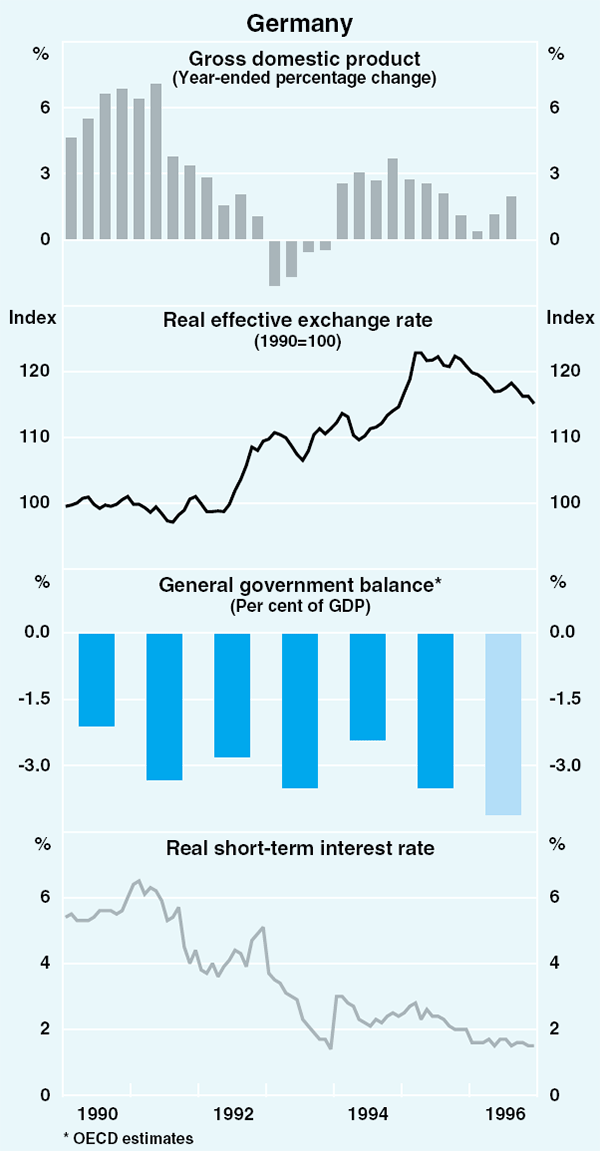
In Germany, GDP rose by 0.8 per cent in the September quarter with much of the growth coming from net exports, and only a small contribution from domestic demand (Graph 22). This pattern appears to have continued into the December quarter. Industrial production has been soft with output little changed from the September quarter. Manufacturers' domestic orders have shown continued weakness; foreign demand, in contrast, has been rising strongly. The unemployment rate stood at 11.3 per cent in January, the highest level since reunification. Over the year to December, the underlying inflation rate was 1.5 per cent.
Activity in the other major continental economies remains mixed. In France and Italy, growth is weak. In contrast, growth has picked up in the United Kingdom and the smaller economies of Ireland, Spain, Denmark and The Netherlands.
Inflation remains subdued throughout continental Europe, prompting official interest rates to be cut in France, Italy, Spain and Sweden. In the United Kingdom, above-trend growth and concerns about the re-emergence of inflationary pressures saw the Bank of England increase official interest rates by 25 basis points in October to 6 per cent.
Commodity prices
The pick-up in OECD industrial production is supporting base metal prices, after a period of weakness. Over the three months to January, the Bank's Base Metals Index rose 15.1 per cent, driven largely by increases in the prices of aluminium and copper (Graph 23). Oil prices also rose through the December quarter and into January, supported by low stockpiles and a cold northern-hemisphere winter. In the month of January, the price of a barrel of West Texas Intermediate averaged $US25.18, up about 14 per cent on the average level in 1996.
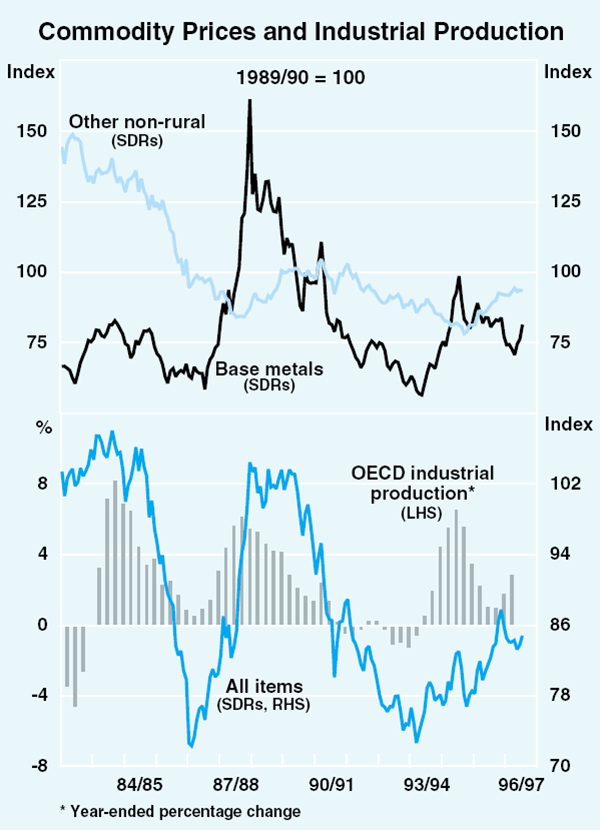
In contrast, some other major commodity prices have shown weakness in recent months. The price of gold fell by $US14 per ounce through the December quarter, and continued to fall in January; it currently stands around 9 per cent below its December quarter average. The outlook for bulk commodity prices is mixed. The annual contract price negotiations with Japanese producers have resulted in a fall in coking coal prices of $US1 per tonne (2 per cent); thermal coal prices have fallen by around 7 per cent. For iron ore, negotiations have been completed with a small overall price increase; fine ore prices rose by 1 per cent with no change in the price of lump ore. Export volumes have been maintained.
The Bank's Commodity Price Index (in SDRs) rose by 0.6 per cent over the three months to January; in terms of US dollars, the Index fell by 0.6 per cent. The effects of falls in the prices of gold, beef and wheat were offset by increases in the prices of oil, wool and base metals.
Developments in Financial Markets
The easings of monetary policy
The two easings of monetary policy during the December quarter brought the total reduction in cash rates over the second half of 1996 to 1.5 percentage points (Graph 24). Prior to that, cash rates had been unchanged since late 1994.
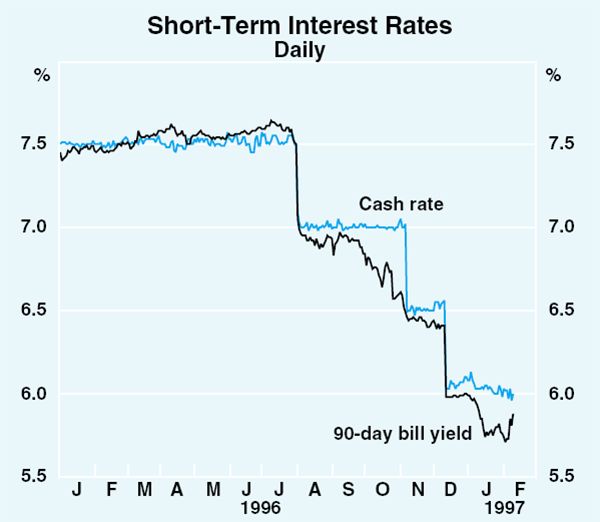
While both the July and November easings took place the morning after a Board meeting, the December easing followed some time after that month's Board meeting, as has been the case in around half of the 21 policy changes that have been announced since 1990.
In timing the implementation of its policy decisions, the Bank takes into account a wide range of factors, including the state of financial markets. Given the volatility of the foreign exchange market at the time of the December Board meeting, which included a fall in the exchange rate of about US3 cents overnight, the Bank felt that it would have been inappropriate to reduce interest rates, and deferred the change until later in the month when market conditions had settled somewhat.
Notwithstanding the volatility in the exchange rate in early December, financial markets overall responded well to the easings of monetary policy over the second half of 1996. The reduction in overnight rates reflected fully in yields along the entire yield curve out to 10 years. That is, the curve moved down in parallel over the half year, an indication that capital markets viewed the easings as fully justified by the inflationary outlook. The exchange rate over the half year showed little net change in trade-weighted terms, though it fell somewhat against a stronger US dollar.
Overall, Australian financial markets ended 1996 on a good note. Bond yields were close to their lows of the past quarter century; the share market was at record levels; and the exchange rate was around its average of the past decade. This reflected generally favourable economic circumstances as the economy notched up its fifth year of economic expansion and low inflation. Bullish sentiment on world financial markets provided a supportive backdrop, a development which owed importantly to the success of the Federal Reserve in maintaining the US economy on a relatively stable growth path, with full employment and low inflation.
Bond markets
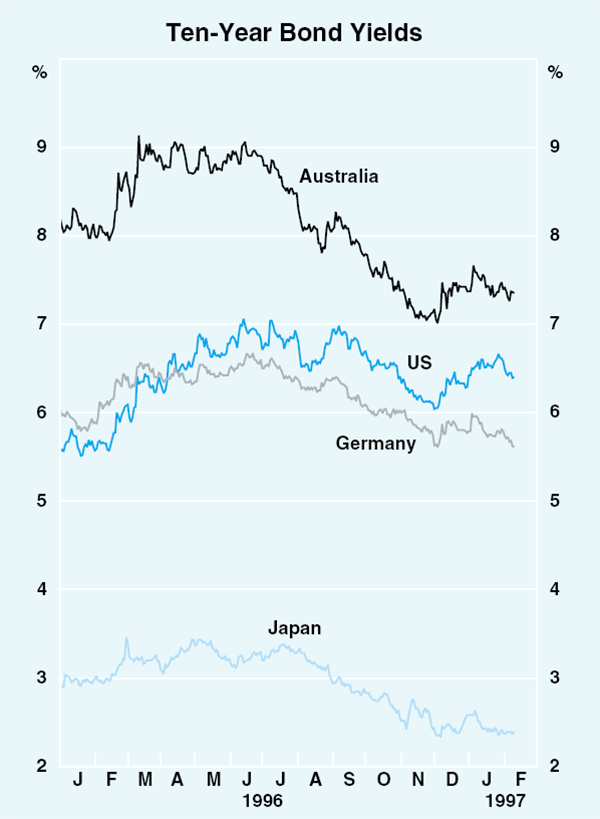
With the US economy relatively well balanced, variability in US bond yields over the second half of 1996 was not high by past standards. Yields had risen in the first half of the year as a run of strong data engendered expectations of an imminent tightening by the Fed. With the pace of expansion slowing in the September quarter, some of this rise in yields was reversed, though as it became clear that this slowing was only temporary, bond yields subsequently rose back towards their mid 1996 highs. Over the past six months, therefore, there was little net change (Graph 25).
While the records of the Federal Open Market Committee show that, by mid year, the Fed had become more concerned about the emergence of inflationary pressures, it did not feel that they were yet sufficient to justify a tightening at that stage, particularly as growth in the economy was expected to slow of its own accord. US monetary policy has remained steady since January 1996, with cash rates at 5.25 per cent, though the Fed has maintained a bias towards tightening since the middle of 1996.
While US bond yields were broadly unchanged over the second half of 1996, those in Japan, where a large amount of excess capacity remains in the economy, fell by three-quarters of a percentage point, to an all-time low of 2.4 per cent. Expectations of a rise in Japanese official interest rates, which have been at a record low of 0.5 per cent since mid 1995, have been pushed back further.
In Europe, German bond yields also fell by about three-quarters of a percentage point as it became clear that the economic recovery remained sluggish. Reflecting a combination of subdued economic activity and falling inflation, there were widespread easings of monetary policy throughout Europe over the second half of 1996, including in Germany. The biggest falls in bond yields were in what are sometimes known as the ‘peripheral economies’, such as Italy and Spain. Both these countries experienced reductions in bond yields of about 2 percentage points over the second half of 1996, which saw their differentials to Germany contract sharply. Very large gains on inflation and reductions in fiscal deficits, as attempts were made to meet criteria for European Monetary Union, were the main factors allowing bond yields in these countries to fall.
Improved inflation and a much better fiscal position also played a large role in the Australian bond market, where yields fell by about 1.5 percentage points over the half year. The recent improvement in the Australian bond market dates from April 1996, when better news of inflation and fiscal policy began to emerge.
Reflecting these forces, the spread between Australian bond yields and US bond yields narrowed over 1996 from 250 points at the start of the year, to 200 points mid year, and 80 points recently. This has brought Australian bond yields to around par with those in the UK and New Zealand, though they remain 80 points above those in Canada. This latter spread can be largely explained by significantly weaker economic activity in Canada, and its lower inflation rate.
Share markets
The low level of world bond yields has provided a solid underpinning to share markets, as they have induced investors to accept lower earnings yields on their shares (ie high price/earnings ratios). The pace in share markets continues to be set by the US, where shares are benefiting from not only low bond yields but from continuing high levels of profitability and a strong trend by households towards investment in equity mutual funds. Inflows to these funds totalled US$225 billion in 1996, 70 per cent higher than in the previous year. This combination of forces has seen the US share market rise in value by 75 per cent since the start of 1995.
This rise has lifted share prices to levels which few professional investors regard as good value. An increase of this size over a two-year period has been rare, having been achieved only twice previously in the post-war period. One was in the lead up to the 1987 share market crash; the other was in the mid 1950s. While in late 1996, the market dipped noticeably on Fed Chairman Greenspan's comments about the level of the share market, it subsequently rebounded to new records in January 1997 as inflows to mutual funds remained robust.
Share markets in most other developed countries have shown more moderate, though still sizeable, increases over the past couple of years (Graph 26). Typically, increases have been in the range of 30–40 per cent. The Australian share market has participated in this upward trend, although it has tended to rise at a rate a little below the average of other industrial countries; it has increased by about 25 per cent over the past couple of years. The resources sector in particular has lagged, though there has also been disappointment with profits of some industrial stocks.
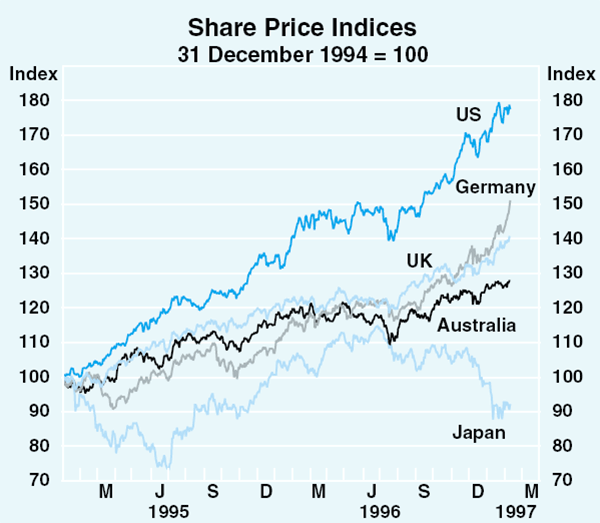
The exception in share markets is Japan, where share prices have fallen by about 15 per cent since late 1996, taking them back to levels of late 1995. This fall took place despite the fact that the Japanese economy recorded solid growth in 1996, helped by low interest rates and a weakening yen. It seems that what is worrying the share market is the outlook for economic growth in the year ahead. Specifically, there are concerns that the scheduled increase in the consumption tax from 3 per cent to 5 per cent on 1 April, as well as more general fiscal consolidation, will undermine economic growth.
Other Asian share markets have generally recovered in recent months, after a setback in mid year associated with slowing regional growth. Share markets in South Korea and Thailand, however, have continued to fall sharply on a combination of slower growth, growing current account deficits and domestic problems. Share markets in China experienced a good deal of turbulence towards the end of the year, but appear to have stabilised in recent weeks.
Foreign exchange markets
There has been a major re-alignment of exchange rates between the US, Japan and Germany over recent months, with the US dollar rising strongly, particularly against the yen which has weakened against all currencies (Graph 27). These movements seem to be a belated recognition by markets of the very different economic circumstances of these three economies. There also appears to have been a change in view about currencies among the authorities in the major countries, with all, including the US, supporting the recent strengthening in the US dollar.
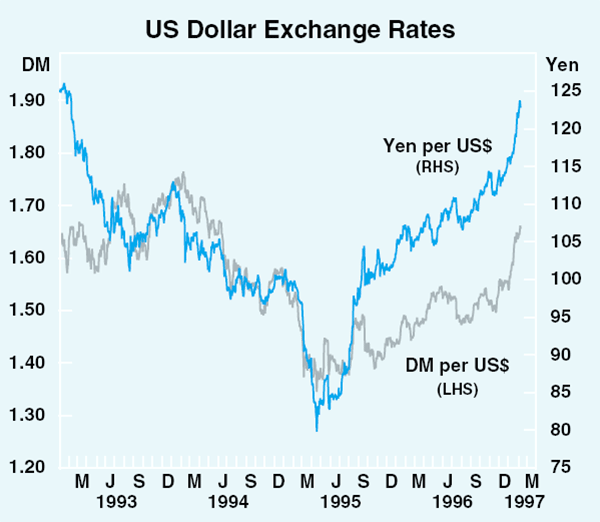
The exchange rate of the US dollar against the yen has moved in a very large range over the past three years. From a level of about 120 in early 1993, it fell to a low of around 80 in mid 1995, only to return to above 120 recently. The fall in the period to 1995 was clearly a case of market overshooting, and no doubt added to the difficulties faced by Japan in recovering from the collapse of the asset-price bubble in the early 1990s.
The weakening of the yen over the past 18 months or so is part of the transmission process of the very easy monetary policy being followed by the Japanese authorities. There are signs that the recent move of the exchange rate back to 120 is helping the recovery process, with Japanese industrial production, and exports in particular, rising quite solidly in late 1996.
To this extent, the easy monetary policy is achieving its objectives, but one of its side effects has been to inflate asset markets in other countries. Japanese households were the first to respond to very low domestic interest rates by increasing investment abroad. More recently, there have been increasing signs of Japanese institutions diverting their investments offshore. This group had suffered substantial foreign exchange losses in the early 1990s and, for a time, were reticent in undertaking offshore investment again. Some international investors have also taken advantage of low Japanese interest rates to leverage asset purchases in other countries; hedge funds are said to have actively pursued this strategy.
| All countries | |
|---|---|
| 1992 | 37.9 |
| 1993 | 48.7 |
| 1994 | 77.1 |
| 1995 | 88.2 |
| 1996 | 109.7 |
The implications for the Australian dollar of these re-alignments of major currencies have been mixed. Through the second half of 1995 and most of 1996, it worked to push up the Australian dollar, as there were heavy inflows from Japan into Australian investments. Australia received a particularly large share of the Japanese retail offshore investment noted above. This spurred the issue of large amounts of dual currency ($A/yen) bonds to satisfy this demand.
The combination of strong inflows from Japan and a general improvement in sentiment towards the Australian dollar by international funds managers as the world economic outlook improved, saw the Australian dollar rise strongly over the course of 1996. From around US74 cents early in the year, it rose to around US79–80 cents in the second quarter. It then remained broadly in this range through to late in the year, apart from a spike up to US82 cents in early December.
Since then, the Australian dollar has weakened noticeably against the US dollar, falling back to under US77 cents (Graph 28). Initially, this was due to reductions in Australian interest rates, which narrowed the extent to which interest differentials favoured Australia. As a result, there has been a noticeable slowing in capital inflows from Japan in recent months, with flows from that country being diverted more to the US and the UK where interest rate increases are expected (Graph 29). Expectations of further interest rate cuts kept the exchange rate under downward pressure through the first half of January, even though these expectations seemed to be supported at times largely by rumours. More recently, a slightly stronger tone in the economic data has seen these expectations recede a little, though the exchange rate against the US dollar has slipped lower, due mainly to the strength of the latter.
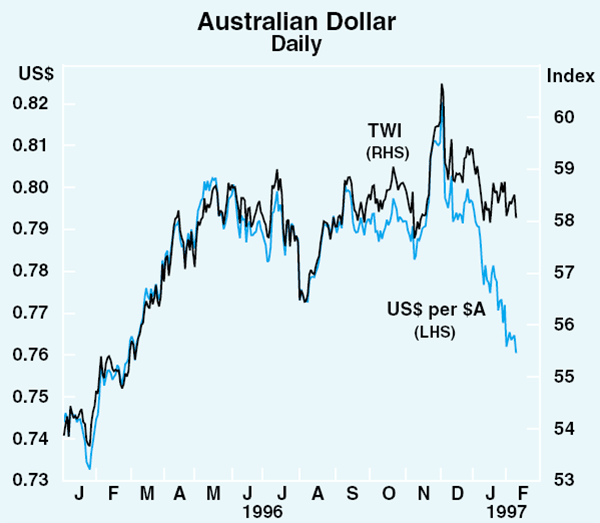
Notwithstanding the recent fall against the US dollar, which has taken the exchange rate back to its level around the end of the first quarter of 1996, the trade-weighted index has fallen by only a relatively small amount. Overall, the trade-weighted index remains around the level which has prevailed since April 1996.
The Bank used the strength of the exchange rate over 1996 to buy back some of the foreign currency reserves it had sold in the early 1990s in support of the exchange rate. Over the course of 1996, purchases of foreign exchange totalled $11.6 billion, with about $4 billion of this being undertaken in the December quarter. Some of the year's purchases ($3.7 billion) were used to meet the Government's regular foreign exchange needs. The rest were applied to reducing outstanding foreign currency swaps which had been built up to fund the early 1990s sales of foreign exchange.
Financial intermediaries
As was the case with the July easing, both easings in the December quarter were fully passed on, with a lag, by financial intermediaries to interest rates charged on variable rate housing and business loans. The predominant standard variable rate on housing loans is now 8.25 per cent, its lowest level since June 1974. The small business indicator rate has been reduced to 9.75 per cent, and the large business indicator rate is 9.3 per cent (Graph 30).
The reductions in these rates in the second half of 1996 reversed most of the increases in business lending rates that took place following the 1994 tightening of monetary policy, even though cash rates in late 1994 were increased by more than they have fallen recently (2.75 per cent against 1.5 per cent). In 1994, banks were able to hold the increase in indicator rates below the rise in cash rates because deposit costs increased significantly less than cash rates. In the case of housing loans, the 1994 increases have been more than reversed, reflecting the additional reduction in these interest rates in June 1996 which was related to increased competition from non-banks rather than a change in monetary policy (Table 6).
| 1994 | 1996 | |
|---|---|---|
| Change in cash rate | 2.75 | −1.5 |
| Change in indicator rates | ||
| – Housing | 1.8 | −2.25 |
| – Small business | 1.9 | −1.5 |
| – Large business | 1.7 | −1.5 |
While the 1996 reductions in the cash rate were fully reflected in lower indicator lending rates, the time taken to pass the changes through to borrowers has been generally longer than the response to the 1994 tightenings. This is particularly the case for existing housing loans, where the average lag in 1996 between the time of the monetary policy announcements and the reductions in housing loan rates becoming effective was around 6–7 weeks, compared with about 2 weeks when banks raised rates in 1994 (Table 7). This lag was also much longer than the lag for new borrowers, for whom the reduced housing loan rates became effective within a week. The implementation lags for new and existing small business borrowers (around 5–6 weeks) and large businesses (around 3–4 weeks) were also longer than the lags in 1994.
| Lending rate | Easings | Tightenings | ||
|---|---|---|---|---|
| July | November | December | 1994 | |
| Housing indicator rate | ||||
| – New borrowers | 21 | 5 | 5 | 16 |
| – Existing borrowers | 58 | 47 | 44 | 16 |
| Large business indicator rate | 23 | 19 | 25 | 16 |
| Small business indicator rate | 27 | 37 | 42 | 16 |