
Statement on Monetary Policy – November 2026 1. Financial Conditions
Summary
- Financial conditions are judged to be restrictive, but with various cross-currents making it difficult to determine the extent of this. Over the course of this year, the rise in the cash rate target and the expected path of rates, along with higher term premia, have contributed to tighter financial conditions. And while some estimates of the neutral rate have also risen, the cash rate and market-implied path are still a little above the top of the range of central estimates of neutral. Also, housing prices have declined by more than expected and new housing lending has declined sharply in response to tighter monetary policy and recent tax changes. Meanwhile, the nominal exchange rate has appreciated since the start of the year but remains broadly in line with estimates of its long-run equilibrium relationship. By contrast, business credit growth remains very strong and corporate risk premia are very low. Moreover, funding remains readily available for banks and most household and business borrowers.
- Overnight indexed swap (OIS) pricing implies market participants assign an 85 per cent probability to a cash rate increase in November, with around one and a half cash rate increases priced in by mid-2027. Expectations for the cash rate have increased since the August Statement. This reflects stronger-than-expected domestic inflation data, higher oil prices, the September cash rate increase, and RBA communications that on balance were interpreted as hawkish. Almost all market economists tracked by the staff expect a cash rate increase in November.
- Most advanced economy central banks are expected to raise policy rates further over the next year. Since the August Statement, the US Federal Reserve (Fed), European Central Bank (ECB), Bank of Japan (BoJ), Bank of Canada (BoC), Reserve Bank of New Zealand (RBNZ), Norges Bank and Bank of Korea (BoK) increased their policy rates, while the Bank of England (BoE) left its policy rate unchanged but retained a tightening bias. These actions, and the increase in market-implied future policy paths since August, reflect the re-escalation of the Middle East conflict and, in some economies, persistent inflationary pressures stemming from capacity constraints. Market pricing implies that most advanced economy central banks are expected to increase policy rates at least twice by the end of 2027.
- Government bond yields have increased notably across advanced economies in recent months, in many cases reaching their highest levels in many years, including in Australia. Higher yields reflect expectations of tighter monetary policy in the near term, higher neutral interest rates and higher term premia. The increase in longer-term yields has occurred at a time of strong public and private sector debt issuance, and models suggest that roughly half of the rise in yields is due to term premia and half to perceptions of neutral (although there is considerable uncertainty around these estimates). Long-term inflation expectations remain consistent with central bank targets even though shorter-term expectations are elevated. While sovereign debt markets have continued to function well across major advanced economies, bond market volatility has increased in recent weeks and the rise in bond yields in some European countries has been large (particularly France, amid fiscal concerns).
- In corporate funding markets, equity and credit risk premia remain low for higher-quality firms but have risen for lower-rated and more interest-rate-sensitive firms. Spreads on investment-grade corporate bonds, including in Australia, remain around historical lows despite strong issuance, while sub-investment grade spreads have widened but remain very low in historical terms. In major equity markets, strong gains in energy stocks and some IT stocks since the August Statement have offset declines in most other sectors, though investors are differentiating more between AI-related firms. Australian equity prices have declined in response to the rise in interest rates and as the downturn in the housing market has lowered earnings expectations in some key sectors.
1.1 Assessment of financial conditions
Financial conditions in Australia are assessed to be restrictive, but with various cross-currents making it difficult to determine the extent of this.
The cash rate is slightly above the range of model-based and market economist estimates of neutral, and the expected cash rate path based on market pricing is higher still, suggesting that policy is restrictive. Other indicators paint a mixed picture. For example, housing market conditions have weakened by more than the tightening in monetary policy would suggest and funding conditions for property developers have tightened, suggesting that financial conditions are clearly restrictive. At the same time, however, funding conditions for most other businesses remain favourable and do not suggest that conditions are particularly restrictive. Table 1.1 summarises evidence contributing to this assessment.
| Measure | Implications for financial conditions | Notes supporting assessment |
|---|---|---|
| Cash rate path (as per market) |
Restrictive (●) | Cash rate is slightly above the top of the range of model and market economists’ estimates of neutral; the market path rises above that |
| Housing market indicators and household credit | Weakening, implies financial conditions are restrictive (●) | Tax changes amplifying the effects of monetary policy; prices and lending falling faster than expected (albeit after very strong growth) |
| Long-term Australian Government Securities (AGS) yields | May be adding to restrictiveness at the margin (○) | At least some of the recent increase is judged to be driven by term premia, raising longer-term borrowing costs and weighing on asset valuations; however, effects of longer-term yields are less than shorter-term yields in Australia |
| AUD trade-weighted index (TWI) | TWI judged to be in line with fundamentals, although there is uncertainty around this assessment | Broadly consistent with moves in interest rates |
| Bank lending rates | In line with the rise in the cash rate | Broadly consistent with moves in the cash rate |
| Business credit | Implies financial conditions are less restrictive (♦) | Growth remains strong and credit remains readily available for most borrowers |
| Corporate risk premia | Implies financial conditions are less restrictive (♦) | Credit and equity risk premia are low despite subdued Australian earnings expectations |
|
(a) Red shading (● and ○) is used for measures that imply more restrictive financial conditions, while green shading (♦) is used for measures that imply less restrictive conditions. Source: RBA. |
||
There are some tentative signs that neutral rates may be rising, globally and in Australia. Since the pandemic, estimates of neutral rates in advanced economies have increased by 1–3 percentage points, and the recent sharp increase in long-term global bond yields is consistent with market participants revising their estimates of the global neutral rate higher still (see Box A: How Does an Increase in Longer-term Real Yields Affect Financial Conditions?). As a small open economy, Australia’s neutral rate is likely to be significantly influenced by neutral rates globally (see Box B: Developments in the Neutral Rate of Interest). Consistent with that, some of our estimates of neutral and those of market economists have increased since the August Statement, though the average of all measures is not much changed (Graph 1.1).
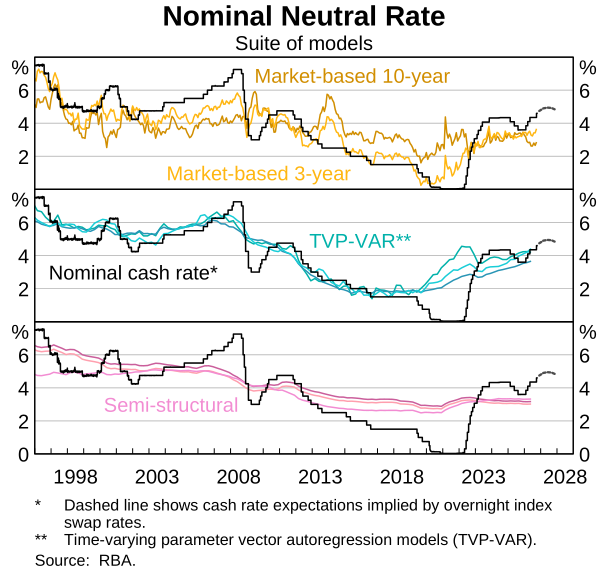
By itself, a rising neutral rate would imply that any given path for policy rates is somewhat less restrictive than previously assessed. However, the cash rate and market path have also increased since the August Statement, and term premia estimates are higher. Long-term inflation expectations are little changed and consistent with the inflation target, suggesting that market participants expect policy will be set at a level that is sufficiently restrictive to contain inflationary pressures.
Other indicators of financial conditions provide a mixed picture. Bank lending rates and short-term bond yields have evolved broadly in line with increases in the cash rate and its expected path. Housing prices and new lending have declined by more than expected, indicating tight financial conditions for the housing sector in response to monetary policy tightening and tax changes. By contrast, strong business credit growth and generally very low corporate borrowing spreads and equity risk premia suggest that financial conditions are not overly restraining aggregate business funding (though conditions have tightened considerably in some sectors, most notably housing construction).
This assessment of financial conditions is subject to uncertainty. Elevated global borrowing by the public and private sector, including to fund AI investments – and the possibility of stronger AI-led productivity growth in future – could materially raise global and domestic neutral rates over time. Conversely, the strong response of the Australian housing market could indicate that the tax changes are amplifying the effects of tighter monetary policy by more than expected, while weaker-than-expected labour market outcomes suggest that policy is working to restrain economic activity. Term premia also appear to have risen, which would tighten financial conditions at the margin. However, there is considerable uncertainty around estimates of term premia, neutral rates and the lags with which changes in the cash rate affect financial conditions.
1.2 Interest rate markets
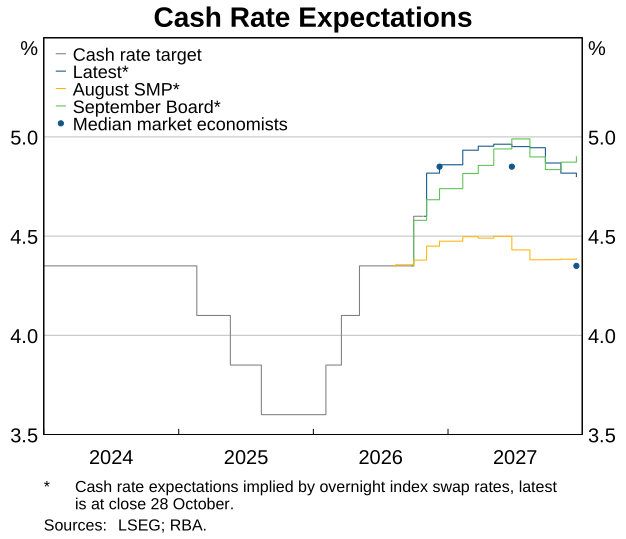
Expectations for the cash rate implied by market pricing have risen since the August Statement.
OIS pricing implies market participants assign an 85 per cent probability to a cash rate increase in November, and around one and a half cash rate increases are priced by mid-2027 (Graph 1.2). The rise in expectations reflects stronger-than-expected domestic inflation data, higher oil prices, the September cash rate increase, and RBA communications that on balance were interpreted as hawkish. Almost all market economists tracked by the staff expect a cash rate increase in November.
Most advanced economy central banks are expected to tighten policy further, reflecting inflationary pressures, including from the effects of the Middle East conflict.
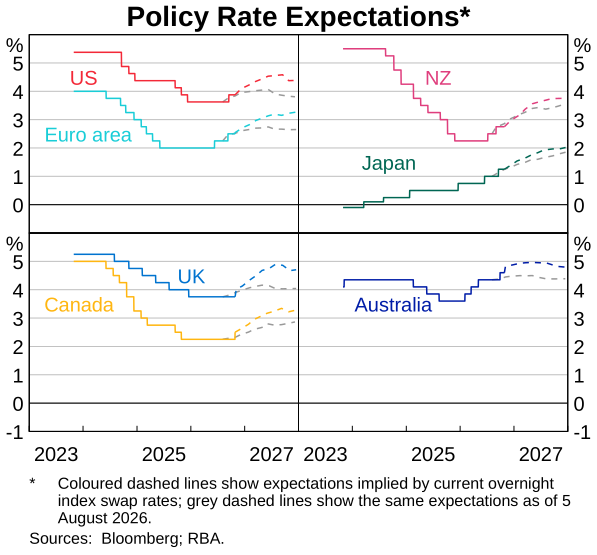
Since the August Statement, the Fed, ECB, BoJ, BoC, RBNZ, Norges Bank and BoK all increased their policy rates. Many of these central banks highlighted the strength or resilience of economic growth and inflationary pressures from the re-escalation in the Middle East conflict, with inflation already persistently above target in some economies. By contrast, the BoE left its policy rates unchanged, citing a balance between downside risks to activity and upside risks to inflation. The BoE indicated that it would tighten policy further if upside inflation risks were to materialise.
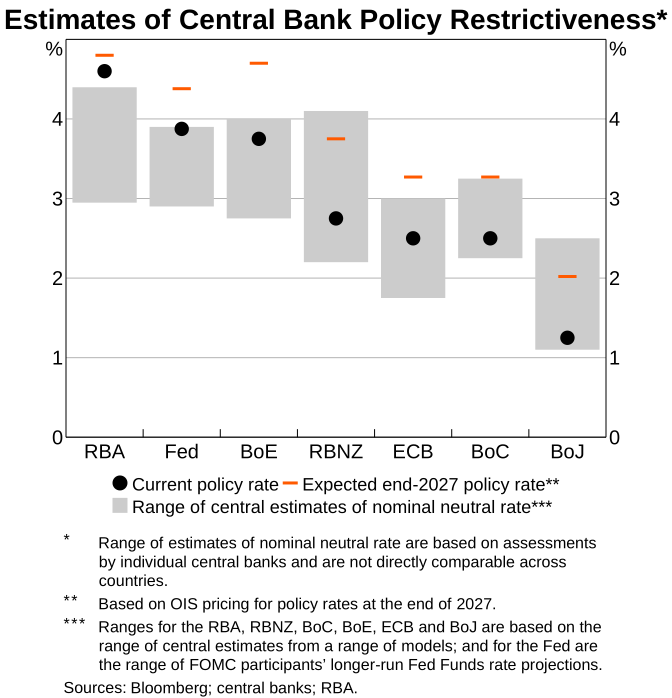
Market-implied policy paths have shifted up in advanced economies since the August Statement (Graph 1.3). Market pricing implies policy rates are expected to increase by around 75 basis points and be at or above the range of estimates of neutral in many advanced economies by the end of next year (although central banks have expressed uncertainty about the level of neutral) (Graph 1.4). For most economies, much of the increase in policy rate paths occurred following the re-escalation in the Middle East conflict. Stronger-than-expected economic activity and central bank communication emphasising upside risks to inflation also contributed to the upward shift in some economies.
The People’s Bank of China (PBC) has retained a slight easing bias amid low inflation, and incrementally eased policy in late September through structural policy tools. The tools direct lending to priority sectors, including infrastructure and manufacturing, and accompanied increased bond issuance quotas for local governments (see Chapter 2: Economic Conditions). Authorities have said that they are concerned that broader monetary easing through a lower policy rate would pressure bank profitability.
Advanced economy government bond yields have risen further to be around their highest level in many years.
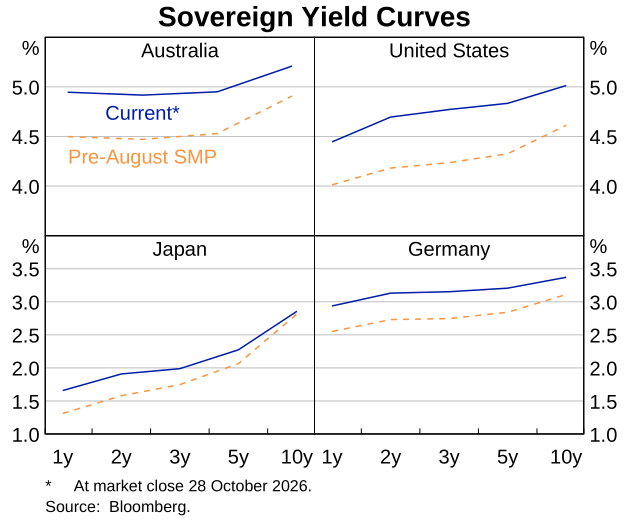
Government bond yields have increased materially across advanced economies since the August Statement, notwithstanding some retracement over recent weeks alongside declines in equity prices. Shorter-term yields are around 40 basis points higher, reflecting expectations of monetary policy tightening in response to near-term inflationary pressure (Graph 1.5). Longer-term yields have increased by around 30 basis points for many economies, driven by an increase in real yields. Most recently, growing concerns about the sustainability and profitability of capital expenditure plans at some AI-related firms (see below) has seen yields decline somewhat as investors have switched into safer government bonds. Model-based decompositions attribute roughly half of the increase in the US 10-year nominal Treasury yield since the August Statement to higher expected future real policy rates, and the rest to higher term premia, but there is considerable uncertainty around these estimates. Box A: How Does an Increase in Longer-term Real Yields Affect Financial Conditions? discusses the recent increase in yields globally and the implications for financial conditions in Australia, while Box B: Developments in the Neutral Rate of Interest discusses the neutral rate and its longer-term drivers.
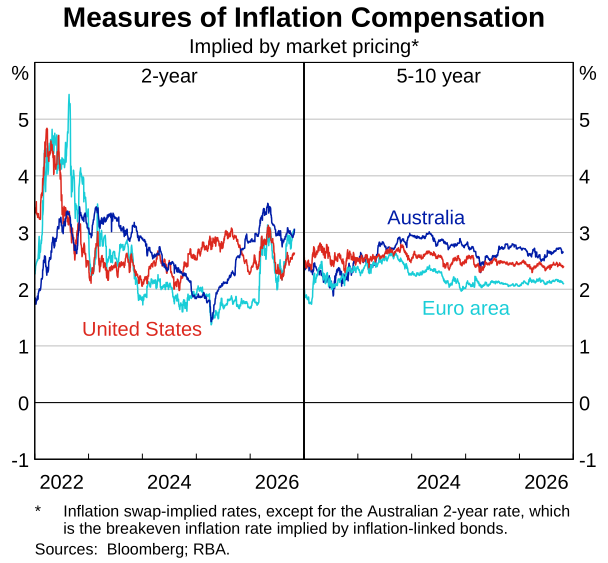
Longer-term inflation compensation is little changed and remains consistent with central bank targets, implying that market participants expect central banks to set policy rates to ensure that inflation is returned to target in a timely way (Graph 1.6).
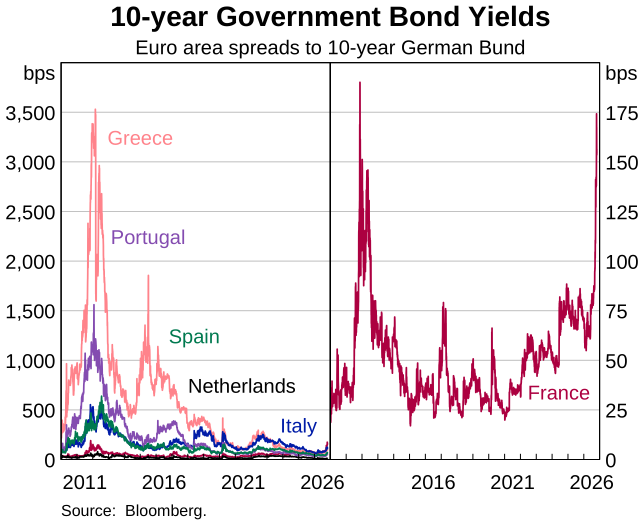
Volatility has increased in many sovereign bond markets. Concerns about fiscal sustainability in France saw the spread between 10-year French and German government bonds rise to around the highest level since the eurozone crisis (Graph 1.7). However, outside Europe, market pricing provides little evidence of material concerns about sovereign credit risk: government bond auctions have generally remained well supported, long-term inflation compensation remains anchored and sovereign credit default swap premia remain low.
In emerging markets, local-currency sovereign bond yields have risen since the August Statement, though in many cases by a little less than in advanced markets. Chinese bond yields remain little changed, underpinned by low inflation and low policy rates, and with capital controls reducing the sensitivity of Chinese yields to movements in global rates. In the rest of emerging Asia, lower debt-to-GDP ratios in many countries, compared with advanced economies, may be contributing to generally more modest yield increases.
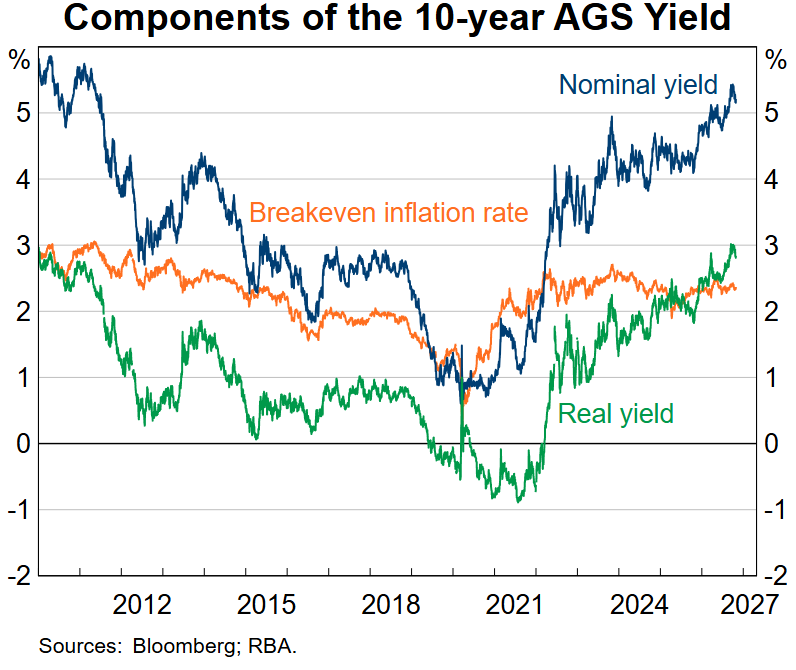
Australian government bond yields have also increased since the August Statement to be around their highest levels in many years (Graph 1.8). As in other advanced economies, much of the increase in longer-term yields has been driven by a rise in real yields, while measures of longer-term inflation compensation have been little changed. Market contacts have attributed the rise in longer-term real yields to a combination of higher expected policy rates (including because of a potential rise in the neutral rate) and higher term premia, although views differ on the relative importance (the RBA’s model estimates suggest a roughly even split between the two). In recent weeks, yields have declined a little alongside similar moves offshore. The increase in volatility in AGS has been smaller than in peer economies, and AGS market functioning remains good.
1.3 Corporate funding markets
Risk premia for equities and investment-grade corporate bonds remain very low but have increased for lower-rated bonds.
Equity prices in advanced overseas economies have been overall little changed since the August Statement, masking significant divergences across sectors and economies (Graph 1.9). Higher interest rates and ongoing tensions in the Middle East have weighed on some sectors, with consumer discretionary and industrial stocks – which are more sensitive to higher yields and energy prices – declining the most (Graph 1.10). By contrast, energy stocks and some IT stocks have continued to rise, although investors are differentiating between technology firms more (see below). In China, equity prices have declined sharply, particularly for AI stocks affected by declining data centre investment sentiment. Meanwhile, earnings growth in the United States has remained broadly based, reflecting continued resilience in economic activity, with growth strongest in AI-related firms. Measures of equity risk premia remain around long-term lows.
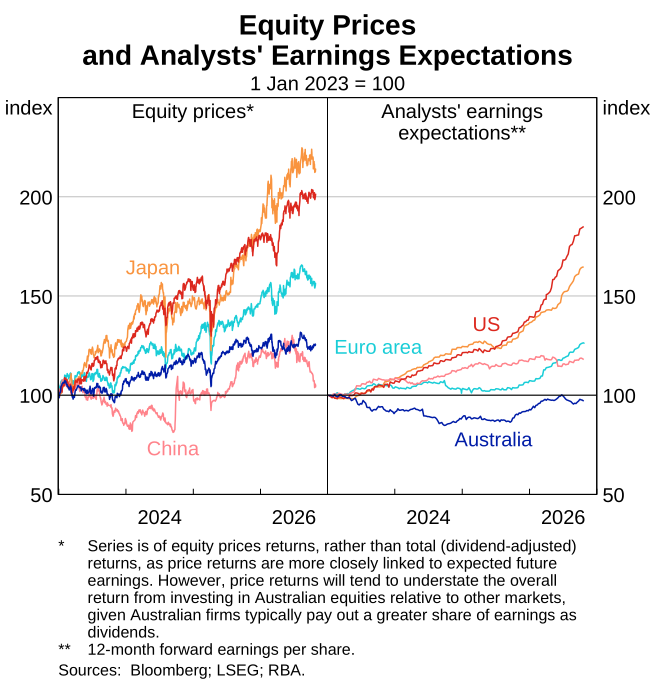
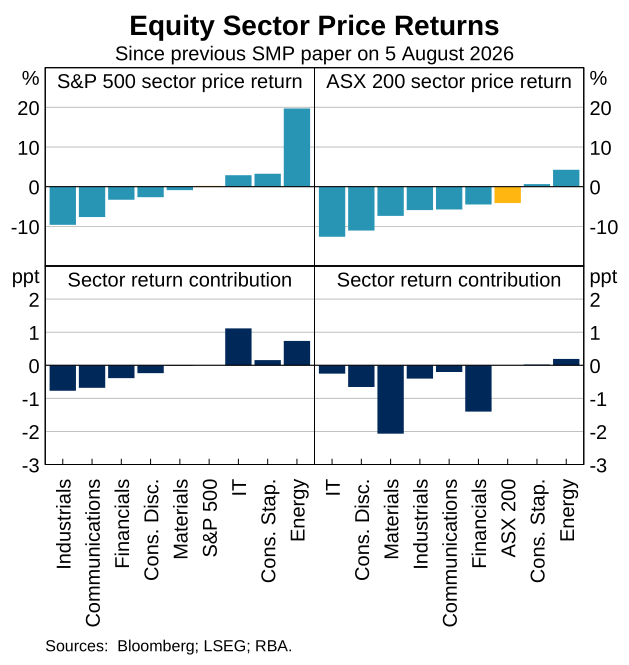
Australian equity prices have declined since the August Statement, owing to the effect of higher interest rates and weakness in sectors exposed to the downturn in the domestic housing market. Share prices for banks, consumer discretionary and real estate firms have declined alongside weaker earnings expectations and a higher expected path for the cash rate, and suggest that investors expect consumer spending to remain subdued. Consumer-facing firms continue to report that households remain value conscious and are trading down to lower-cost alternatives, weighing on profitability in discretionary sectors. Profits at consumer staples firms have been more resilient, while equity prices for Australian-listed energy companies have increased alongside higher oil prices. Overall, analysts’ earnings expectations for Australian firms have declined recently, having trailed other advanced economies for some years including due to lower prices for key commodities and subdued economic growth.
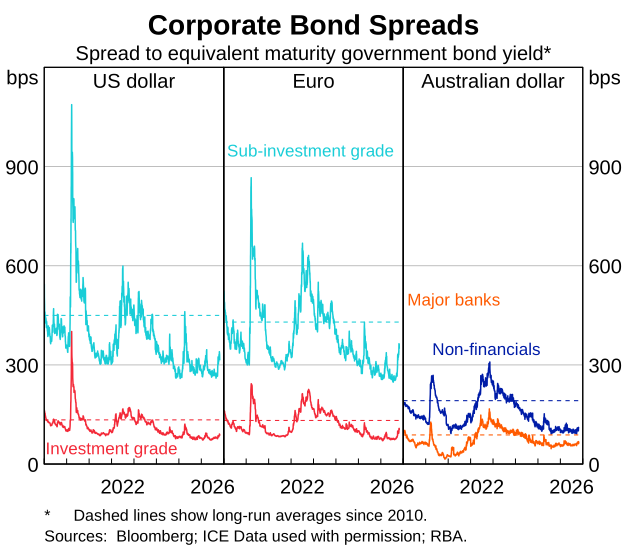
Investment grade corporate bond spreads have increased slightly in advanced economies but remain around historically low levels (Graph 1.11). The rise in spreads for sub-investment grade firms has been more noticeable, in part because their creditworthiness is more sensitive to higher interest rates, although spreads remain low. The slight increase in Australian bond spreads has tightened funding conditions in Australia at the margin, though funding is readily available to investment grade firms. Borrowers reliant on private credit have seen a more significant tightening of funding conditions, discussed below.
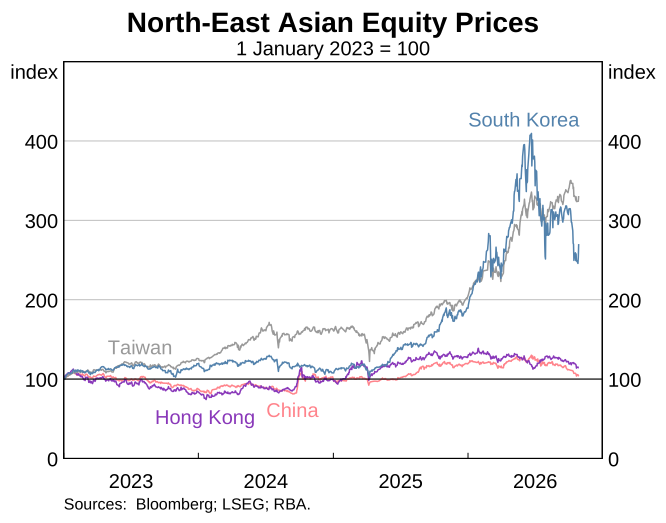
Investors are differentiating between technology firms more. Large ‘AI hyperscalers’ reported very strong revenue growth in the latest quarter, but their share prices and bond spreads have become more sensitive to substantial upward revisions to planned capital expenditure and to concerns about whether this investment will earn adequate returns (Graph 1.12). Capital expenditure by these firms is now expected to be around US$800 billion this year and to approach US$1.4 trillion by the end of 2027 – around 5 per cent of US GDP and around twice what was expected in late 2025 – with a growing share financed through bond issuance. Korean equity prices have declined, driven by falls in the share prices of memory chip producers amid concerns about the scale and sustainability of the AI data centre build-out; these concerns have also affected Chinese AI stocks (Graph 1.13). By contrast, Taiwanese equities have outperformed those elsewhere in Asia, partly reflecting stronger earnings expectations for chip manufacturer TSMC.

Similarly, some Australian data centre firms have faced increased investor scrutiny. Most notably, AI data centre developer Firmus withdrew its planned initial public offering (IPO) in October following weak investor demand at the proposed valuation, and some other data centre operators have experienced equity price falls and a widening in credit spreads; commentators suggest that the IPO withdrawal may have been one factor contributing to weaker global sentiment towards AI-related firms. By contrast, a range of other Australian data centre operators have seen little change in their cost of capital.
Low corporate credit and equity risk premia suggest that investors continue to expect the economic impact of the Middle East conflict to be limited and AI investment to ultimately be profitable, among other things. However, a material reassessment of the economic viability of AI-related investment, the effects of the Middle East conflict, US policy uncertainty following the midterm elections or concerns about fiscal sustainability globally could lead to a broader weakening in risk sentiment. This could spill over to Australian markets via higher risk premia and reduced access to funding.1
1.4 Foreign exchange markets
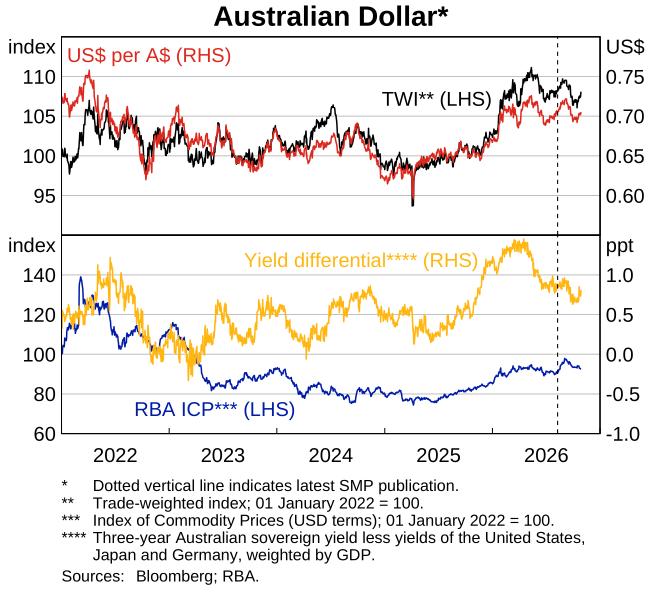
The Australian dollar is little changed since the August Statement and remains around 5 per cent higher than the start of the year.
The Australian dollar TWI is little changed since the August Statement (Graph 1.14). Australian government bond yields have risen since August, but major trading partner yields have risen by a similar, and in some cases greater, degree. This modest narrowing in yield differentials has been offset by support from the weaker euro following concerns regarding fiscal sustainability in France. Since the start of the year, the Australian dollar has appreciated by around 5 per cent in TWI terms and remains broadly consistent with estimates of its long-run equilibrium level, although there is a degree of uncertainty around this assessment.
1.5 Australian banks and credit markets
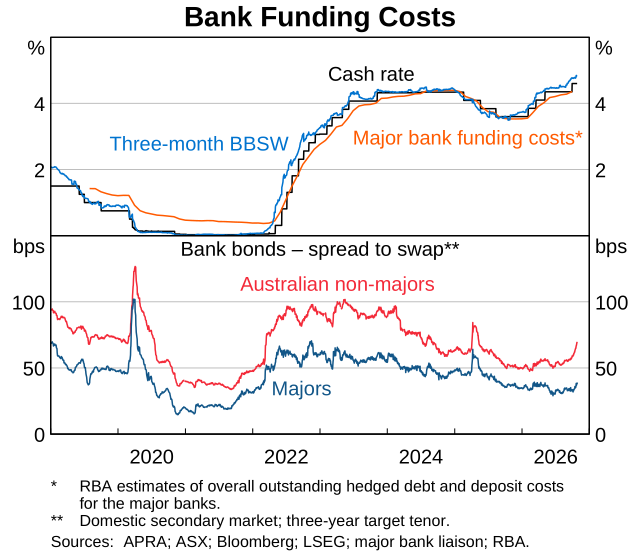
Banks’ funding costs and lending rates have increased in line with the cash rate since the beginning of the year.
Banks’ funding costs rose by around 80 basis points between January and September, and will rise further as September’s increase in the cash rate continues to be passed through (Graph 1.15). Banks have increased average deposit rates broadly in line with increases in the cash rate this year. This contrasts with previous easing and tightening phases, when average deposit rates have tended to change by less than the cash rate because some deposits, such as transaction accounts, do not reprice fully when the cash rate changes. The stronger-than-usual pass-through this year is consistent with some banks highlighting strong competition for deposits over recent quarters. Wholesale funding conditions remain favourable, with spreads between bank bond yields and swap rates remaining low. Bank bond issuance has been a little above average in 2026.
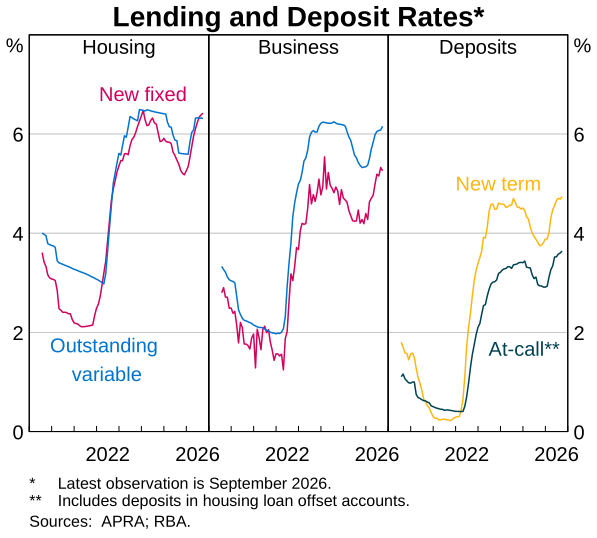
Lending rates have increased broadly in line with the cash rate and other reference rates over 2026 (Graph 1.16). Variable mortgage rates rose by almost 75 basis points between January and September, and most banks have since increased their standard variable mortgage rates in line with the September cash rate increase. Prior to September, some lenders had reduced advertised mortgage rates slightly amid strong competition for mortgage customers, though this has had a negligible effect on average new and outstanding mortgage rates. Variable business rates have increased broadly in line with increases in bank bill rates (BBSW) and the cash rate this year.
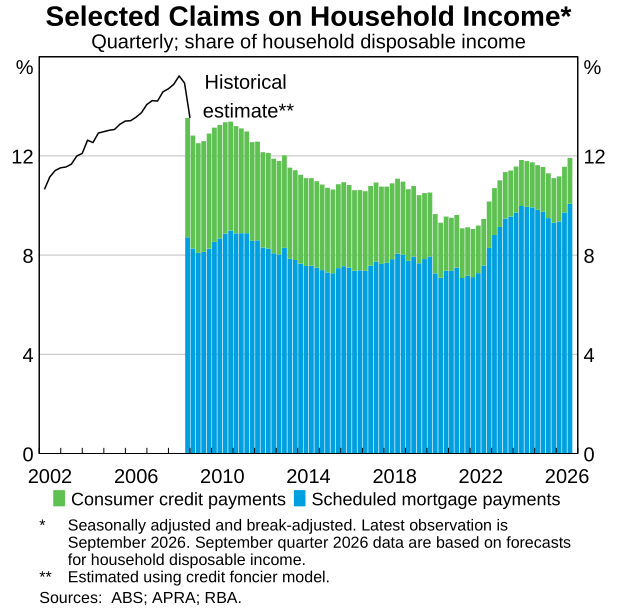
Cash rate increases over 2026 have flowed through to higher scheduled mortgage payments.
Scheduled principal and interest mortgage payments increased to just over 10 per cent of household disposable income in the September quarter, around their 2024 peak (Graph 1.17). Scheduled mortgage payments will rise a little further as September’s increase in the cash rate is passed through to mortgage payments (which can take up to three months). Nonetheless, total scheduled household debt payments (including estimated repayments on consumer credit) remain well below the 2008 peak, reflecting a long-run decline in consumer credit relative to household disposable income.2
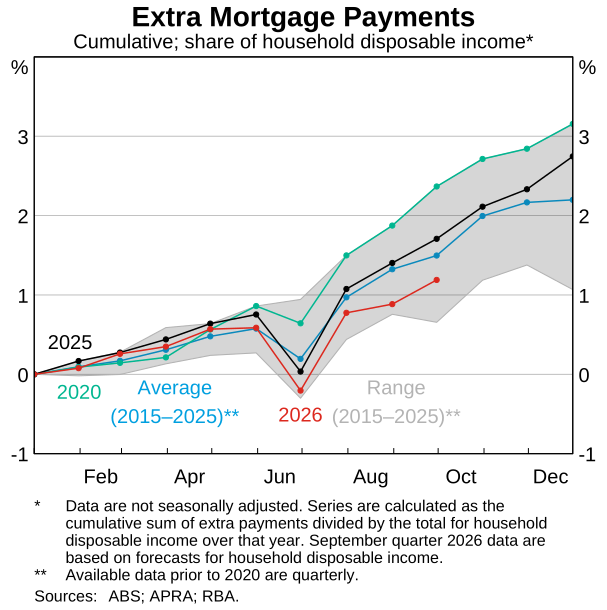
Extra mortgage payments have been a bit lower in 2026 compared with 2025 (Graph 1.18). By contrast, the overall household saving ratio has remained relatively stable (see Chapter 2: Economic Conditions). While higher interest rates provide an incentive to save, they also reduce borrowers’ cash flows, which can lead to a reduction in extra mortgage payments. Nonetheless, extra payments are still positive and so adding to the significant mortgage buffers that most borrowers have. Indeed, the median borrower in the lowest income quartile has enough savings in offset and redraw accounts to cover around a year’s worth of scheduled mortgage payments.3
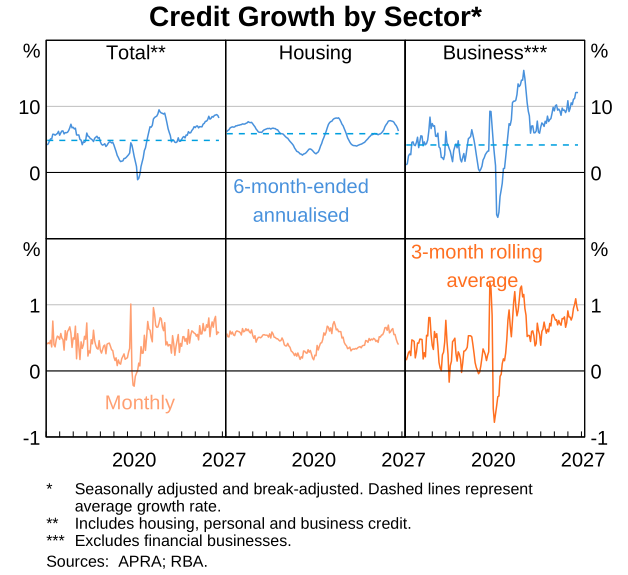
Total credit growth has remained well above its post-global financial crisis (GFC) average over recent months.
Total credit growth has declined slightly since the August Statement, but remains strong at 8.2 per cent in six-month-ended annualised terms (Graph 1.19). A decline in housing credit growth, to around its post-GFC average, has been largely offset by an increase in business credit growth. These contrasting trends are discussed in more detail below.
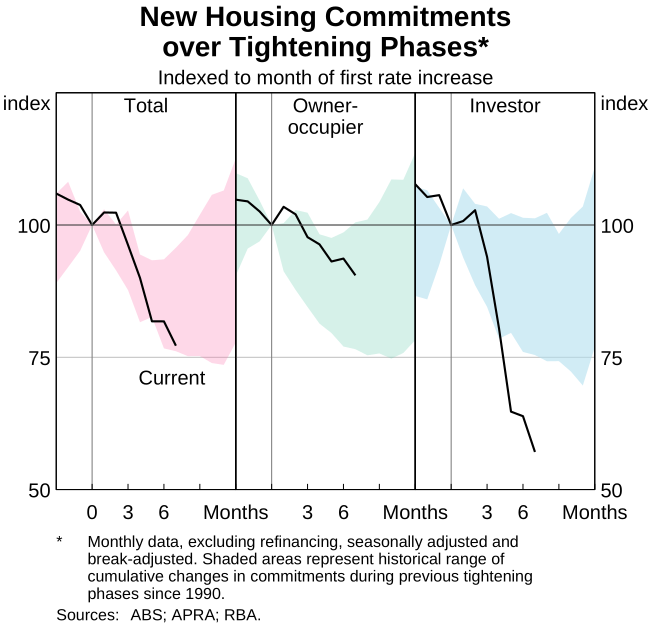
New housing loan commitments have declined sharply, particularly for investors, and housing credit growth has eased.
New housing loan commitments have declined further since the August Statement and are now 27 per cent below their peak in November 2025. The decline in overall housing loan commitments to date is larger than most tightening phases since 1990, though not as large as at the same point in the 2022 tightening phase (Graph 1.20).4 While the increase in interest rates over 2026 has weighed on demand from all categories of borrowers, the decline in new lending has been most pronounced for investors and has been concentrated in loans to purchase established dwellings. This is consistent with the recent changes to negative gearing and capital gains tax decreasing the after-tax returns on investments in established housing.
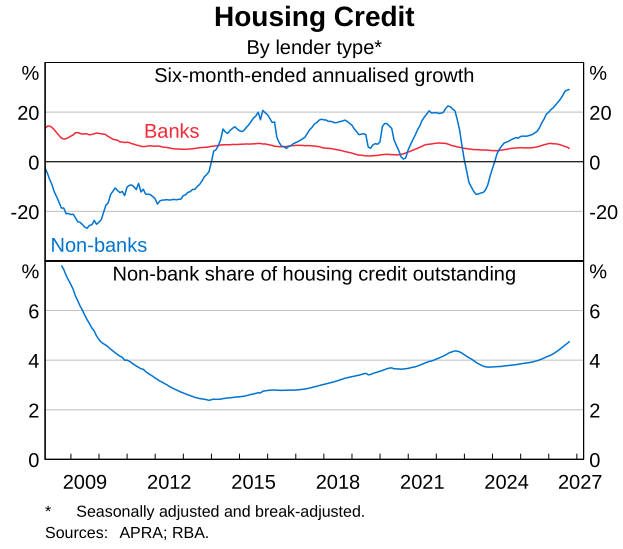
Housing credit growth is now 6.3 per cent in six-month-ended annualised terms, lower than at the time of the August Statement but still around its post-GFC average. The recent decline has reflected a fall in investor credit growth; owner-occupier credit growth has remained little changed in six-month-ended terms and has softened only slightly in monthly terms, in line with the more modest decline in owner-occupier commitments. Housing loan commitments and credit growth tend to lag housing price growth by up to three months, largely reflecting lags between the purchase and settlement of property. As a result, housing credit growth is expected to decline further over coming months as recent declines in housing prices and turnover continue to flow through to credit (see Chapter 2: Economic Conditions).
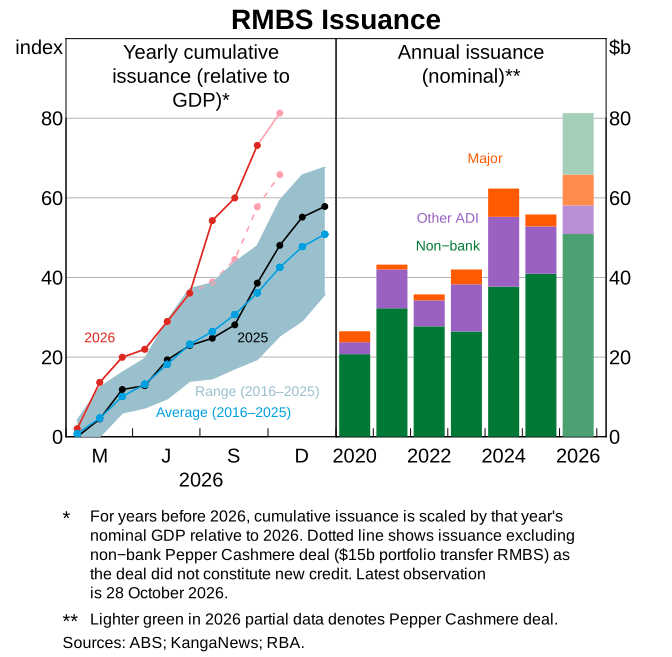
Non-bank housing credit is a small share of total housing credit but has been growing quickly (Graph 1.21). Growth in non-bank housing credit has accelerated considerably over the past 18 months, mainly reflecting new lending rather than refinancing of bank loans. In part, this growth is likely to reflect less stringent debt servicing tests at some non-banks compared with banks (which are required to assess serviceability at an interest rate that is three percentage points above the prevailing mortgage rate, reflecting the Australian Prudential Regulation Authority’s (APRA) serviceability buffer). Non-bank credit growth has also been supported by generally favourable conditions in securitisation markets – a key funding source for these lenders – allowing non-banks to compete more readily with banks for customers. Issuance of residential mortgage-backed securities has been very strong, with cumulative issuance in the year-to-date (relative to GDP) exceeding the range seen in recent years (Graph 1.22). While spreads on residential mortgage-backed securities have increased recently they remained very narrow in historical terms.
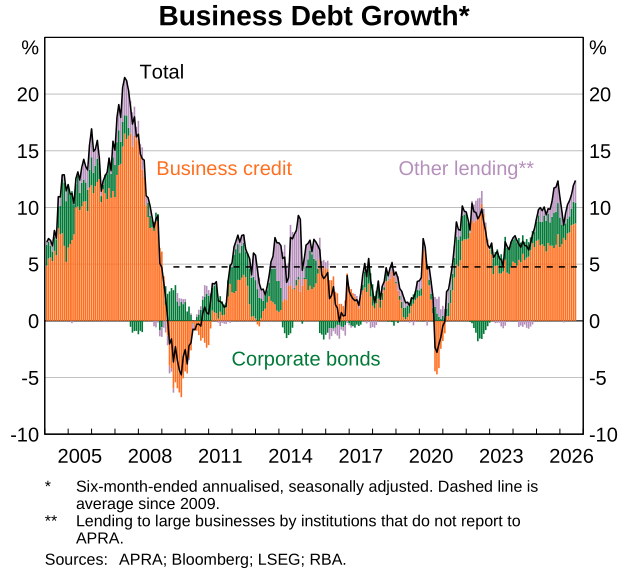
Growth in business debt remains strong and has increased recently.
Business debt growth is well above its post-GFC average (Graph 1.23). Business credit growth has accelerated in recent months, supporting the strong growth in overall business debt. By contrast, corporate bond issuance has slowed, largely because high earnings have allowed some resource companies (which typically play a material role in debt issuance) to rely more heavily on internal funding. The largest contributors to business debt growth have been industrial businesses – including borrowing to fund data centre investment, discussed below – as well as consumer-facing industries and real estate businesses.
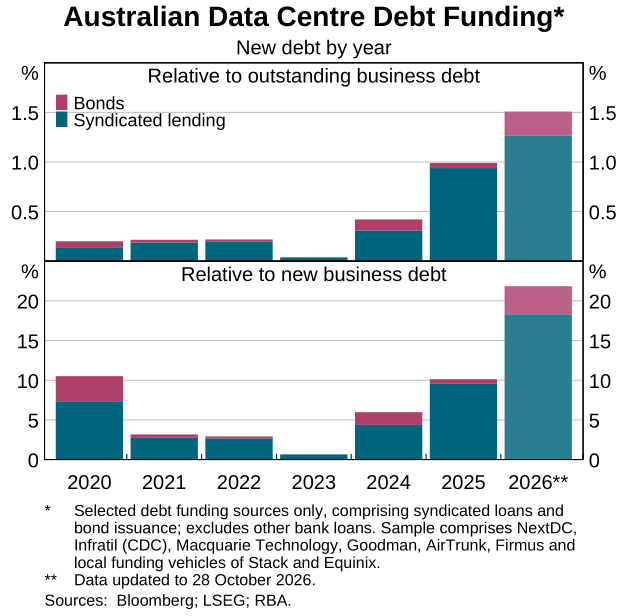
As in some overseas jurisdictions, debt financing for Australian data centre operators has been an important contributor to strong business debt growth. In 2026 to date, operators have raised at least $30 billion in the bond and syndicated loans markets (domestically and offshore), including syndicates involving Australian banks. This is equivalent to around one-fifth of the increase in the stock of business debt so far this year (Graph 1.24). However, operators may also use other sources of debt funding such as bilateral bank loans and private credit. This suggests that the total volume of borrowing by operators is likely to be higher than the $30 billion quoted above (though it is unclear how much higher). So far, the decline in global and domestic investor sentiment towards some riskier AI-related firms (discussed above) is having only a limited effect on broader cost and availability of funding for most Australian data centre operators. Even so, this remains a risk if sentiment were to deteriorate further.
Funding conditions for private credit lenders have tightened recently, which could reduce the availability of credit for new residential construction. Media reports and liaison information have noted an increase in investors’ redemption requests at some funds. At the same time, lenders have noted a less profitable outlook for new residential property developments due to higher construction costs and weaker housing market conditions, which is expected to weigh on both developers’ demand for finance and lenders’ appetite to supply finance. Available information suggests non-bank lenders (including private credit funds) comprise at least 40–50 per cent of lending for residential property construction.5
Endnotes
1 For further discussion, see RBA (2026), Financial Stability Review, October.
2 See Appendix A of Jennison S and M Miller (2025), ‘An Update on the Household Cash-flow Channel of Monetary Policy’, RBA Bulletin, January.
3 See Graph 2.4 in RBA (2026), ‘Chapter 2: Resilience of Australian Households and Businesses’, Financial Stability Review, October.
4 At the same point in the 2022 tightening phase the cash rate target was at 3.10 per cent, following 300 basis points of cash rate increases (with around 75 basis points of additional increases expected over the coming year).
5 For example, see Graph 12 in Jennison S, J Spiller and P Wallis (2026), ‘Recent Changes in Credit Markets and Their Implications for Monetary Policy’, RBA Bulletin, February.