
Statement on Monetary Policy – November 2026 Box B: Developments in the Neutral Rate of Interest
Long-term bond yields in advanced economies have increased substantially recently, continuing their upward trend in the post-pandemic period (see Chapter 1: Financial Conditions). Part of this increase is likely to reflect a rise in the neutral rate of interest – the level of the short-term real interest rate that balances saving and investment and neither stimulates nor dampens demand once temporary influences on the economy have faded. The neutral rate can help inform assessments of the stance of monetary policy. All else equal, a higher neutral rate implies that a given level of the cash rate is less restrictive than otherwise. However, the neutral rate is not directly observed and estimates are subject to considerable uncertainty both about its level and underlying drivers. There is also uncertainty about estimates of other influences on long-term interest rates, notably term premia, which have also contributed to the increase in longer-term sovereign bond yields. This Box discusses the concept of the neutral rate, its possible drivers and the associated uncertainties.
What is the neutral interest rate?
The neutral rate of interest can refer to short-run or long-run concepts, each of which has different connections to forecasts and policy. The long-run neutral rate is the level of the cash rate that neither stimulates nor dampens demand once temporary shocks and structural forces have played out. At that point, demand and potential supply will be in balance, with full employment and inflation at target. It is also consistent with global saving and investment being in balance. Some of the RBA’s Australian neutral rate models lend themselves more to this long-run concept of neutral.1
However, the long-run neutral rate may not correspond to the appropriate setting for the cash rate in the short term because monetary policy may need to respond to temporary influences on activity and inflation. The short-run neutral rate is a related concept that aims to capture these forces. This is the cash rate that neither stimulates nor dampens demand over the next few years, taking account of ongoing shocks and structural changes.2 The short-run neutral rate is less commonly estimated in the literature, although some models in the RBA’s suite provide signals about shorter-run developments, particularly those based on forward-looking financial market pricing. In practice, it is often unclear in real time whether developments are temporary or persistent, meaning that short-run and long-run concepts of neutral can overlap. Consequently, even models that are intended to represent a long-run forecast of the policy rate may partly capture shorter-run trends.
The RBA’s forecasts set out our assessment of how shorter-run developments in financial and economic conditions are likely to affect inflation and unemployment, which helps inform the Monetary Policy Board’s assessment of the appropriate stance of monetary policy. The forecasts also attempt to capture the direct impact on the economic outlook of structural change, for example by factoring in estimates of the non-accelerating inflation rate of unemployment and potential output. Estimates of neutral rates provide a useful cross-check of the forecasts. These estimates are shaped by many of the same developments but infer their effects from economic data and market prices using different techniques. This provides an additional perspective on developments in the economy but can also make it difficult to tell whether developments driving the neutral rate estimates are reflected in the forecasts. The value of the cross-check comes from understanding what the estimates imply about the stance of monetary policy and what is likely to be driving these estimates.
When examining the neutral rate and its drivers, it is important to consider both domestic and global factors. Australia is a small open economy, which means that we are price takers in global financial (and other) markets given the sizeable influence of capital flows on domestic financial conditions. Hence, shifts in the global balance of saving and investment will have a large influence on the neutral rate in Australia, though they are not the only influence (see below). Global forces relevant to the neutral rate include productivity growth, demographic trends and government debt levels.
Estimates of neutral rates have increased in the post-pandemic period and there are a range of possible explanations.
Estimates of the neutral rate in Australia have increased over recent years to be above their pre-pandemic levels, partly reversing a long-run decline (Graph B.1). A similar trend is evident in many advanced economies, including the United States.3 Although the increase over recent years is relevant to the assessment of the current stance of monetary policy, understanding it requires considering why neutral rate estimates declined over the decades leading up to the pandemic. The research literature has put forward two competing explanations. First, the decline could reflect slow-moving structural factors, such as demographics, weak productivity growth and inequality, that caused ‘secular stagnation’. Second, the particularly sharp decline in neutral rate estimates in the 2010s could be picking up more temporary factors, such as the need to repair balance sheets in the aftermath of the global financial crisis (GFC).4
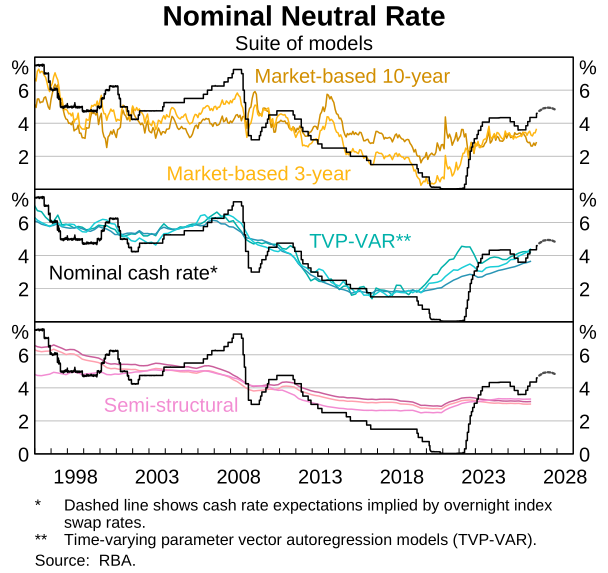
The first explanation, secular stagnation, argues that households and businesses increasingly wished to save more, relative to firms’ desired investment, placing downward pressure on interest rates.5 Three possible causes identified in the literature are demographic change, weak productivity growth and rising inequality globally. Population ageing and rising inequality can increase desired saving, while weaker productivity growth can reduce desired investment. Together, these factors will put downward pressure on interest rates. At the same time, a number of governments globally ran substantial fiscal deficits, including because of increased social security expenditure to support ageing populations. The literature argues that the decline in neutral rates would probably have been even larger without these fiscal deficits.
A second explanation is that the unsustainable credit boom in the 2000s and the balance sheet damage caused by the resulting GFC placed persistent, but ultimately temporary, downward pressure on interest rates.6 This literature argues that many of the slow-moving structural factors associated with secular stagnation do not align with either the steep decline in estimated neutral rates during the 2010s or their subsequent increase. For example, the working-age population has declined relative to the old-age population in the OECD in a relatively steady way that does not match the sharper decline and then rebound in neutral rate estimates. Instead, this literature argues that high levels of household and business debt and large falls in asset prices led households, businesses and financial intermediaries to spend a prolonged period repairing their balance sheets. This desire to increase private saving and reduce private investment worked to lower neutral rates. As the effects of the GFC faded and balance sheets were repaired, this downward influence on neutral should have dissipated.
While the estimates presented above suggest that neutral interest rates have increased materially since the pandemic, the drivers of that increase remain uncertain. The increase over recent years is broadly consistent with explanations that emphasise the fading effects of the GFC, but it could also reflect changes in longer-running structural factors (Graph B.2; Table B.1). For example, the post-pandemic rise in neutral rate estimates has coincided with a rapid expansion in AI-related investment and stronger US productivity growth than in the 2010s. Higher expected productivity can raise the expected return on investment and encourage businesses to invest more, placing upward pressure on neutral rates. Large and persistent fiscal deficits in advanced overseas economies could also be putting upward pressure on neutral rate estimates by reducing public saving. As a share of GDP, post-pandemic deficits in the United States and elsewhere have been larger than in the late 2010s or before the GFC.
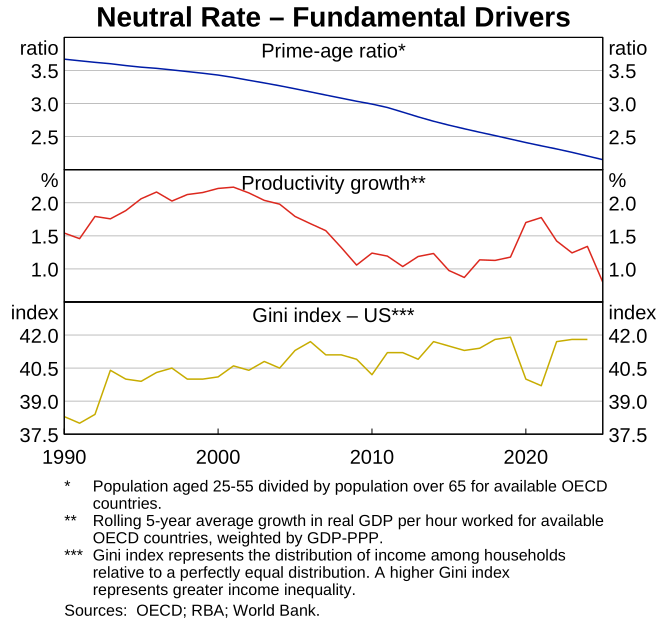
The magnitude of these effects remains highly uncertain.7 Structural changes, such as in expected future productivity, are hard to measure and do not necessarily occur gradually nor independently of other forces. Newer and ongoing structural changes are likely to be evolving in their effect on neutral rates. The effects of climate change, for example, are ambiguous: additional investment in renewables, including to meet the energy requirements of AI, could put upward pressure on neutral rates, whereas the higher returns required by investors to compensate for physical climate risks could work in the opposite direction.8 Globally, government deficits have also continued to increase, and political and geopolitical factors could sustain this trend. At the same time, ageing populations and rising inequality continue to weigh on neutral rates.
| Economic/financial development | Channel | Implication for r* | Persistence |
|---|---|---|---|
| Population ageing | Increases desired household saving | Lower | Structural |
| Rising inequality | Shifts income towards households with higher saving propensities | Lower | Structural |
| Stronger/weaker productivity growth | Increases/reduces expected returns to capital and desired investment | Higher/Lower | Structural |
| Post-GFC balance sheet repair | Raises private saving and reduces investment while households and firms deleverage | Lower | Persistent but temporary |
| Larger government deficits | Reduce public saving | Higher | Depends on fiscal persistence |
| Climate change and adaptation | Raises investment in energy transition, while greater physical climate risk can weigh on investment, among others | Ambiguous | Potentially structural |
|
(a) Summary of potential macroeconomic drivers of the neutral rate discussed above and in International Monetary Fund (2023), ‘The Natural Rate of Interest: Drivers and Implications for Policy’, World Economic Outlook, April, Chapter 2. Other potential economic/financial drivers of neutral rates from IMF (2023) include scarcity of safe assets, risk aversion and financial stress. Sources: IMF (2023); RBA. |
|||
The global neutral rate is not the only driver of the neutral rate in Australia.
As mentioned above, global forces have a strong influence on the Australian neutral rate because of Australia’s role as a small open economy. However, they do not determine it completely. One study suggests that changes in US neutral rates explain around half of the variation in Australian neutral rate estimates.9 In theory, once the economy is in balance, shocks have dissipated and monetary policy is therefore no longer responding to domestic or international shocks, the neutral rate in a small open economy should equal the global neutral rate plus a risk premium. This risk premium could reflect impediments to the free flow of capital or differences in the compensation that domestic and international investors require for risk.
There remain considerable uncertainties about both the level and drivers of the neutral rate, which are consequential for policy.
Although neutral interest rates are an important conceptual framework for considering the stance of policy, they cannot be observed directly and are difficult to measure. Different approaches to measuring neutral rates offer different perspectives. Some approaches infer neutral from financial market prices and some are estimated by examining the evolution of macroeconomic variables. The RBA accounts for this uncertainty by examining a range of models. Another source of uncertainty arises from how these statistical models are estimated, meaning that even a single model can produce a wide range of plausible estimates of the neutral rate.10 And, as noted above, it is difficult to tell in real time how much each model reflects long-run trends rather than shorter-term developments.
Reflecting this uncertainty, policymakers are cautious when interpreting (small) short-term moves. Most models suggest that neutral rates have increased over recent years. However, the rise in long-term bond yields over the year to date could reflect a number of factors other than changes in neutral rates, such as expectations about future inflation and the additional compensation that investors require to hold longer-term bonds (see Box A: How Does an Increase in Longer-term Real Yields Affect Financial Conditions). An increase in long-term yields therefore does not, by itself, mean that the neutral rate has risen.
Even if neutral rates have increased, it is difficult to determine what has driven the increase. The relevance of the long-run neutral rate estimates to current policy is mainly the information they contain about underlying developments in the economy, and whether those are adequately reflected in the RBA’s forecasts. The persistence and effects of these developments matter for the appropriate setting of policy over the next few years, as captured by the short-run concept of neutral.
As an example, suppose the emergence of AI technologies leads to a modest increase in global productivity in the long term. This could place some upward pressure on long-run neutral rate estimates without necessarily significantly affecting near-term inflation or the appropriate cash rate today. However, if AI also increased near-term aggregate demand by increasing investment in data centres and related infrastructure, then the appropriate policy response could be to increase the cash rate by more than the change in the long-run neutral rate. Given the uncertainty around both the extent of any increase in neutral rates and the forces driving it, the possibility of a higher neutral rate is partially embedded in the current forecasts and is otherwise being monitored as a source of uncertainty for the outlook (see Chapter 3: Outlook).
The RBA will continue to develop our understanding of the structural drivers of neutral rates and the degree to which they are likely to have implications over different horizons for the appropriate setting of monetary policy. Key areas for research include connecting movements in the neutral rate suite to fundamental economic drivers, including better understanding the ‘wedge’ between domestic and global neutral rates.
Endnotes
1 See, for example, Kent C (2026), ‘Reassessing Australian Financial Conditions’, Speech at the KangaNews Debt Capital Market Summit, Sydney, 26 March. Also see Smith P (2025), ‘How Developments in International Financial Markets Shape Financial Conditions in Australia’, Speech at Australian Securitisation Conference, Sydney, 26 November, on the role of global neutral.
2 See Kent, n 1. Also see Obstfeld M (2023), ‘Natural and Neutral Real Interest Rates: Past and Future’, NBER Working Paper No 31949.
3 See Federal Reserve Bank of New York (2026), ‘Measuring the Natural Rate of Interest’, available at <https://www.newyorkfed.org/research/policy/rstar/>.
4 This is not an exhaustive survey of possible drivers of the neutral interest rate; other explanations include changes in the demand for safe and liquid assets and associated convenience yields. See International Monetary Fund (2023), ‘The Natural Rate of Interest: Drivers and Implications for Policy’, World Economic Outlook, April, Chapter 2.
5 See Rachel L and L Summers (2019), ‘On Secular Stagnation in the Industrialized World’, Brooking Papers on Economic Activity No 26198.
6 Eggerston G and P Krugman (2012), ‘Debt, Deleveraging, and the Liquidity Trap: A Fisher-Minsky-Koo Approach’, The Quarterly Journal of Economics, 127(3), pp 1469–1513; and Rogoff K (2025), ‘Debt Supercycle Versus Secular Stagnation’, Journal of Policy Modelling, 47(4), pp 723–737.
7 See Korinek A et al (2026), ‘Economic Scenarios for Transformative AI’, Centre for Economic Policy Research Paper No 21939.
8 See Angeli M et al (2022), ‘Climate Change: Possible Macroeconomic Implications’, Bank of England Quarterly Bulletin, October.
9 Morley J and B Wong (2026), ‘How Important is Global R-star for Open Economies?’, European Economic Review, 188(August), No 105391.
10 For example, in one of the RBA’s semi-structural models, the 90 per cent probability interval for the current neutral rate spans around 7 percentage points, indicating that the true neutral rate could be far from the central estimate.