
Statement on Monetary Policy – November 2026 2. Economic Conditions
Summary
Global cost pressures from the Middle East conflict and AI boom have increased since August.
- The re-escalation of the Middle East conflict has pushed up energy prices, as global energy supply continues to be constrained by disruptions to shipping and damage to refineries. Crude oil and refined product prices have risen by 20–25 per cent and are materially higher than was assumed in the August forecasts. Prices of a range of base metals and agricultural commodities have also increased this year, including because of the conflicts in the Middle East and Ukraine and adverse weather.
- Global economic activity has been more resilient than expected, underpinned by the AI boom and supportive fiscal measures. GDP growth in Australia’s major trading partners has trended higher over the past few years. Recently, the strength in global AI-related demand and fiscal measures in some major economies have more than offset the negative impacts of the Middle East conflict. The underlying strength in the global economy has added to global cost and price pressures, with the surge in data centre activity creating capacity constraints in related supply chains.
- The extent to which global cost pressures will pass through to consumer prices is uncertain. Headline inflation has increased in most economies following increases in energy prices, while core inflation is already above central bank targets in many advanced economies. Policy rate expectations implied by market pricing have increased in many advanced economies, in line with higher near-term inflationary pressures (see Chapter 1: Financial Conditions).
In Australia, GDP growth has slowed this year to a little below its potential growth rate.
- This largely reflects softer growth in household consumption, consistent with the earlier easing in household income growth, as well as in exports and public demand. The Middle East conflict is assessed to have had only modest effects on overall domestic activity so far. Notwithstanding the slowing in growth, recent data suggest that activity growth this year has been a bit stronger than anticipated in the August forecasts, supported by very strong investment in data centres.
- Conditions in the housing market have eased and the unemployment rate has increased, both by more than expected in August. Housing prices have declined further from their peak in March, primarily reflecting the effects of monetary policy and tax changes announced in the federal budget. The unemployment rate increased to 4.6 per cent in the September quarter. That appears largely to reflect stronger-than-expected labour supply; employment growth held up in the September quarter as expected and liaison and leading indicators suggest a stable near-term outlook for labour demand.
Domestic inflation is elevated and has been stronger than expected recently. We now assess that capacity constraints in the first half of the year were a little tighter than previously judged.
- Headline inflation was 3.9 per cent over the year to the September quarter and trimmed mean inflation ticked up to 3.7 per cent. The upside surprise in trimmed mean inflation – relative to the August forecasts – is judged to reflect that domestic capacity pressures this year have been stronger than previously assessed, with the indirect effects of cost pressures related to the Middle East conflict passing through to inflation broadly as anticipated. While the price of fuel has increased strongly, inflation has been broad-based, including significant price increases for a range of market services. This is consistent with elevated growth in unit labour costs. Liaison contacts across most industries continue to report sustained cost pressures.
- Despite the easing in GDP growth and increase in the unemployment rate we continue to assess that there are some capacity pressures in the economy. While below-trend GDP growth and rising unemployment by themselves imply that aggregate demand and potential supply are moving closer to balance, a range of data – including persistently high inflation and elevated growth in labour and non-labour input costs – suggest that domestic capacity constraints are greater than previously assessed and so capacity pressures remain. Accordingly, we have raised our estimate of the unemployment rate consistent with low and stable inflation a little, though this estimate remains very uncertain.
- Some measures of short-term and longer-term inflation expectations have increased since August. Elevated inflation expectations, including shorter-term expectations, may contribute to higher realised inflation if they influence wage- and price-setting decisions today.
2.1 Commodity price developments
Some of the upside risks to global cost pressures identified in the August Statement have materialised. Global oil and refined product prices have increased sharply due to ongoing disruptions related to the Middle East conflict, and these prices are now expected to remain elevated for longer. More broadly, a range of supply disruptions caused by conflicts and adverse weather events, alongside strong AI-related demand, are boosting prices of a range of commodities and inflation in many economies.
Energy prices have increased since the August Statement.
Front-month Brent crude oil futures prices have increased by around 25 per cent since the August Statement and are currently around US$115 per barrel (Graph 2.1). A renewal of hostilities in the Middle East led to a sharp increase in global crude oil prices in September and October, to around their peak level from earlier this year. That is despite a recovery in crude oil exports from the Middle East owing to the rerouting of oil flows and use of ship-to-ship transfers to enable crude oil flows through the Strait of Hormuz. Elevated prices likely also reflect an increased geopolitical risk premium associated with the risk of further disruption to crude oil flows due to the conflict.
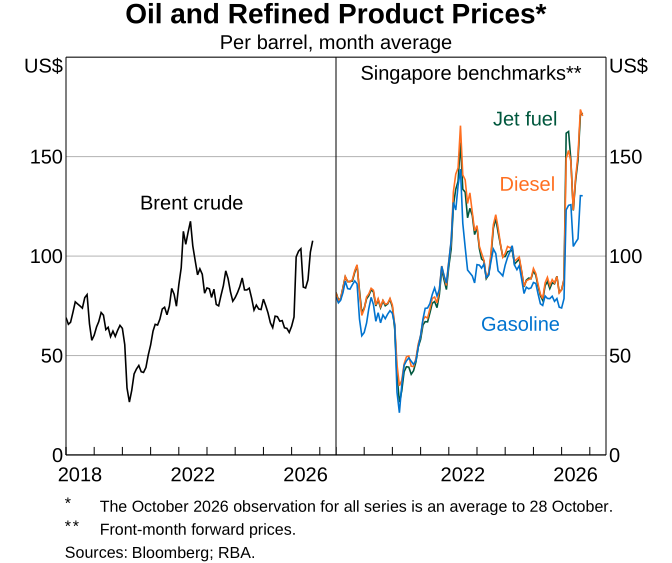
There continues to be little sign of progress toward a resolution of the conflict and commodity analysts have revised their outlook for oil prices higher in 2026 and 2027. The downward slope of the futures curve has also steepened since the August Statement, reflecting tight physical oil supply and falling inventories as conflicts escalated over September and October (see Graph 3.1 in Chapter 3: Outlook).
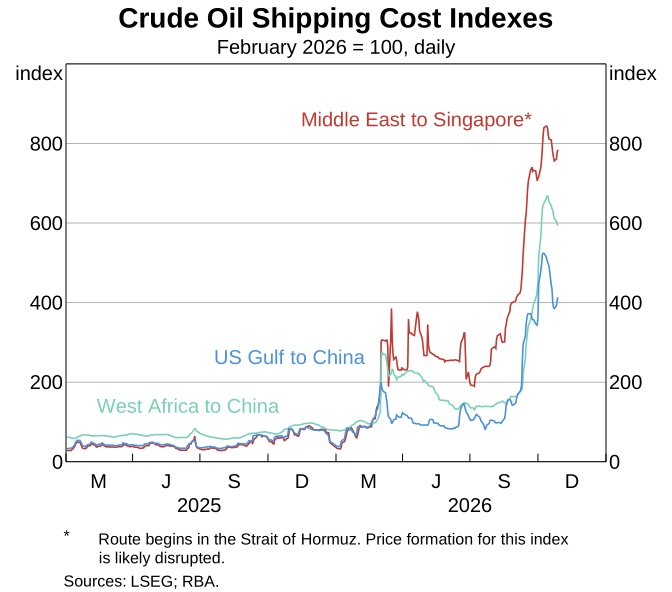
Prices of refined oil products have increased substantially since the August Statement. The spreads between the prices of refined products and crude oil (‘crack spreads’) have been elevated for some time, reflecting supply constraints. Refined product exports from the Middle East have recovered by less than crude oil exports in recent months. In addition, global refining capacity remains constrained due to outages in Russia and the Middle East, further limiting supplies, particularly of diesel. Since August, gasoline, diesel and jet fuel prices have increased by around 20–25 per cent. That largely reflects increases in the cost of buying and shipping oil, as the rerouting of crude oil and the use of ship-to-ship transfers have caused congestion and raised shipping costs for refiners (Graph 2.2). Market reporting indicates that higher shipping costs have not been fully passed through to refined product prices, as profit margins for some Asian refiners have been squeezed. Compressed margins may discourage refiner production in the near term, helping maintain elevated refined product prices and crack spreads.
Low inventory levels and a recovery in Chinese oil imports leave energy markets vulnerable to further supply disruptions and upward pressure on prices. A drawdown in global inventories and a reduction in Chinese demand for oil imports helped energy markets absorb the initial impact of the Middle East conflict. While increases in crude oil supply over August and early September allowed for a modest restocking of global crude oil inventories, market analysts estimate that inventories remain around historically low levels. Refined product inventories have continued to decline and are approaching historical minimum levels. Chinese oil imports have increased recently and a sustained recovery – for example, to support inventory restocking – presents an upside risk to global crude oil prices.
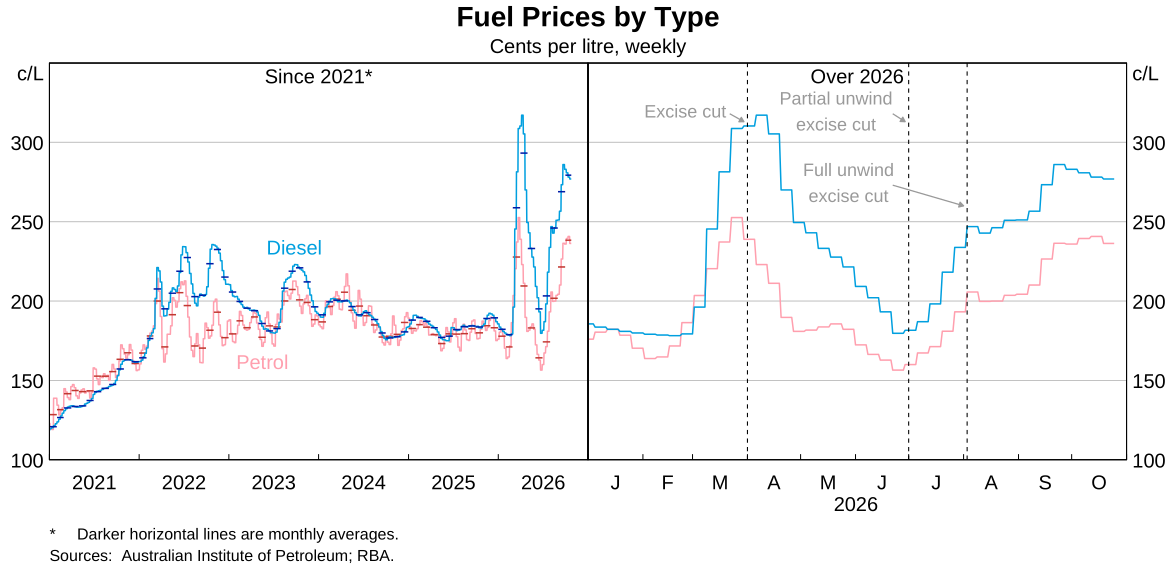
Retail petrol and diesel prices in Australia have increased substantially and are well above the August forecast assumption and their pre-conflict levels (Graph 2.3). The increase reflects both the rise in regional benchmark prices for refined fuel and the ending of the temporary fuel excise reduction in July and August. Nonetheless, refined fuel prices, especially for diesel, remain below the peaks observed earlier this year, which reflected severe dislocations in Asian refined product markets following the announcement of export bans in several exporting countries in the region.
Prices of natural gas have increased in line with other energy commodities. Asian liquefied natural gas (LNG) and European natural gas prices have increased by more than 50 per cent to be around the high levels observed during the early stages of the Middle East conflict, driven by restocking demand in Europe ahead of winter and concerns over future supply from the Middle East.
Supply disruptions continue to affect a range of other commodity prices.
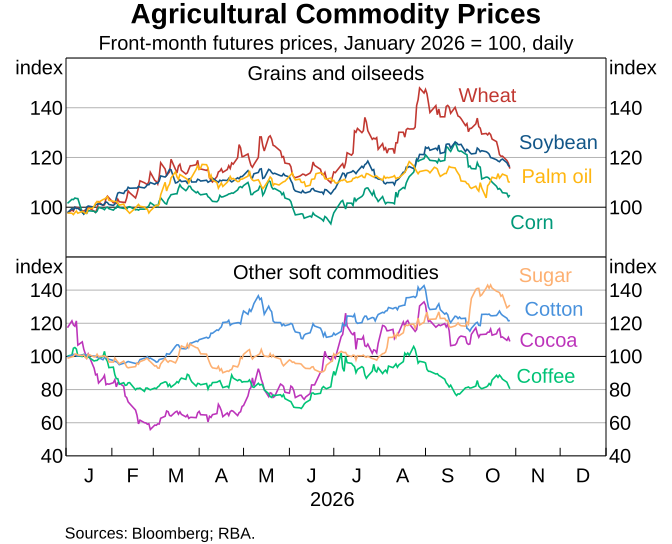
Prices of some base metals have risen since August, while agricultural commodity prices remain elevated. Copper, zinc and aluminium prices remain elevated following mining and shipping disruptions, including due to the Middle East conflict, alongside continued demand pressure from the energy transition and AI-related investment. Prices for agricultural commodities, including wheat, have risen through 2026, following supply chain disruptions in the Middle East and Ukraine (Graph 2.4). The increase in fertiliser prices in March and April as a result of the Middle East conflict may now also be contributing to elevated agricultural commodity prices. Adverse weather conditions, including drought in parts of the United States and repeated heatwaves in Europe, have also affected harvests, pushing up grain prices earlier this year.
The internationally declared El Niño event is yet to materially affect commodity prices but poses risks to agricultural yields and prices over the year ahead. The estimated effects on agricultural output and prices in previous El Niño episodes have varied and tend to differ across both regions and commodities. El Niño can increase the likelihood of extreme weather events, which may exacerbate supply disruptions and contribute to periods of elevated commodity price volatility.
In terms of key Australian commodity exports, the price of iron ore has fallen slightly, while the price of coking coal has increased by 6 per cent since the August Statement. Iron ore price pressures remain subdued as supply remains abundant, while coking coal prices have been boosted by supply disruptions in China and Indonesia.
2.2 Global economic conditions
Economic growth in Australia’s major trading partners (MTPs) has trended higher and been consistently stronger than expected over the past year or so. MTP growth has been resilient and slightly higher than some estimates of trend growth recently. Growth has been supported by the global surge in AI-related investment, fiscal policy measures targeted at households and business in many economies, and higher defence spending in some economies. Against a backdrop of higher public and private investment, government bond yields have increased across advanced economies; this reflects expectations that policy rates will remain higher for longer, as well as increases in term premia (see Chapter 1: Financial Conditions). Upstream cost pressures are intensifying as capacity in AI-related supply chains struggles to keep pace with soaring demand – particularly in high-income east Asia – and global energy prices have been persistently elevated. These pressures are passing through to some consumer goods prices. The rise in goods prices has occurred alongside a stalling in disinflation in services prices, leaving core measures of inflation elevated relative to central banks’ targets. Central bank policy responses are discussed in Chapter 1: Financial Conditions.
MTP growth has been stronger than expected in the August Statement, supported by the boom in AI-related investment that has more than offset headwinds from the Middle East conflict.
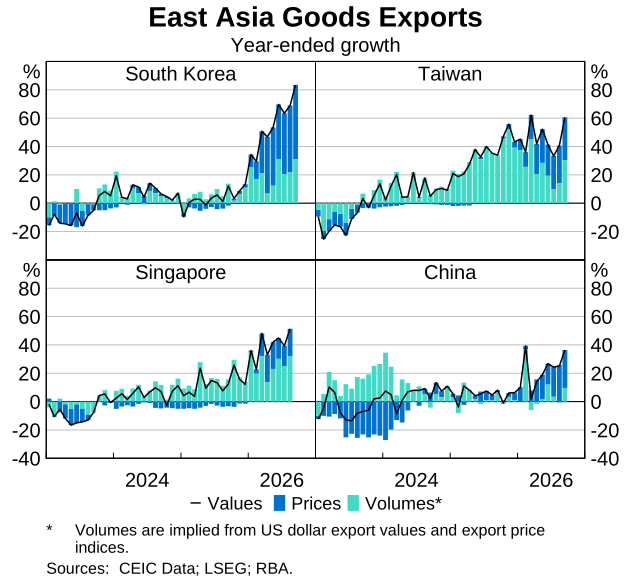
Growth in Australia’s trading partners remained resilient in the June and likely also the September quarters, partly reflecting the global investment boom, particularly for AI-enabling products. GDP growth was stronger than expected in economies with significant exposure to AI-related supply chains, such as South Korea and Singapore, reflecting robust net exports and an increase in construction activity. Timely trade data across several east Asian economies indicate that export prices continued to rise sharply in the September quarter – by around 40 per cent in year-ended terms in South Korea – consistent with manufacturing capacity being fully utilised, compounding cost pressures from higher energy prices (Graph 2.5). These upstream cost pressures have flowed through east Asian supply chains and into some consumer goods prices.
Outside of east Asia, growth in advanced economies appears to have remained steady in the September quarter following stronger-than-expected growth in the June quarter. Timely indicators point to continued strength in manufacturing activity and investment in the September quarter, reflecting AI- and defence-related demand. Business surveys also suggest that services activity growth may have strengthened in the September quarter. In the United States, household consumption and private sector labour demand remain resilient despite higher energy prices; retail sales growth over August and September was strong, while employment growth has remained broadly in line with estimates of labour supply growth, leaving the unemployment rate little changed.
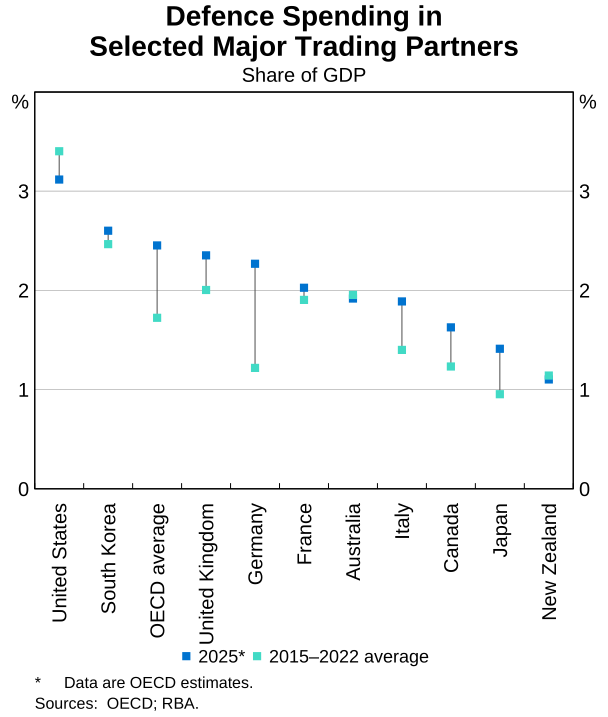
Growth in many trading partners has also been supported by fiscal policies shielding households and businesses from higher energy costs, as well as rising defence spending in some economies. In the first half of the year, many governments implemented tax cuts, subsidies and fiscal transfers to support households and businesses through the Middle East energy shock. While there had been a gradual shift away from subsidies and price caps for retail fuel, allowing upstream cost increases to pass through to producer and consumer prices, some trading partners have extended or re-introduced these policies following more recent increases in refined product prices globally. Defence spending has also supported growth in some trading partners, particularly in the euro area where its share in GDP has increased since Russia’s invasion of Ukraine in 2022 (Graph 2.6). The impact of higher government spending (and other factors) on government bond yields globally is discussed further in Box B: Developments in the Neutral Rate of Interest.
GDP growth in China rebounded in the September quarter which, alongside the announcement of additional policy support, means that growth is on track to achieve the annual GDP growth target.
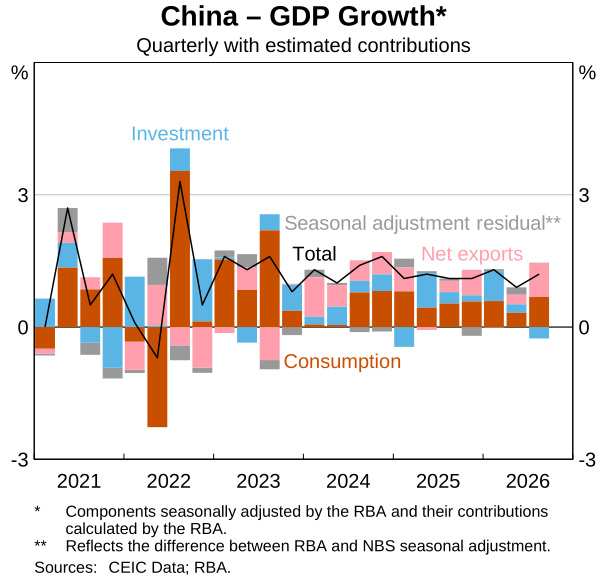
Chinese economic activity strengthened over the September quarter, following a period of subdued activity. Growth was supported by a moderate increase in consumption and a large positive contribution from net exports, while investment declined (Graph 2.7). Household income growth continued to outpace consumption, lifting the savings ratio amid ongoing weakness in household sentiment and spending. Monthly indicators suggest that there was some improvement in momentum towards the end of the quarter, led by fixed asset investment and industrial production as authorities continue to prioritise development of advanced manufacturing and ‘Six Networks’ infrastructure projects.1 Local government special bond issuance increased in August and September, which should support infrastructure investment further over the coming months. Property sector activity continued to decline. Developments in the Middle East conflict and the AI-investment boom have affected Chinese trade flows and contributed to large increases in Chinese export prices.
In response to subdued growth in the middle of the year, authorities shifted to a more supportive policy stance and reaffirmed their commitment to achieve the 2026 annual growth target. The new policy measures include expanding policy bank lending to cover infrastructure projects that are part of the ‘Six Networks’ construction initiative and allowing local governments to draw on unused special bond quotas from previous years. Alongside other adjustments to monetary policy settings and mortgage policies, the new measures signal that lifting economic growth to achieve the annual target has become more of a policy priority, which should support a strong increase in infrastructure investment over the remainder of 2026 and early 2027.
Core inflation remains elevated in many economies and energy and upstream AI cost pressures have intensified.
Headline inflation has risen across most economies, driven by higher energy prices following the re-escalation of hostilities in the Middle East (Graph 2.8). Most advanced economy central banks have revised their near-term headline inflation forecasts higher to reflect elevated energy prices, though most still expect inflation to return to target by 2028. Available measures of households’ longer-term inflation expectations have risen in some advanced economies, in line with higher energy price inflation. Producer prices and a range of indicators from timely business surveys suggest that cost pressures for firms in all advanced economies remain elevated due to higher energy, materials and transport prices related to suply disruptions caused by the Middle East conflict. Some firms also report limited ability to pass cost increases on to price-sensitive consumers.
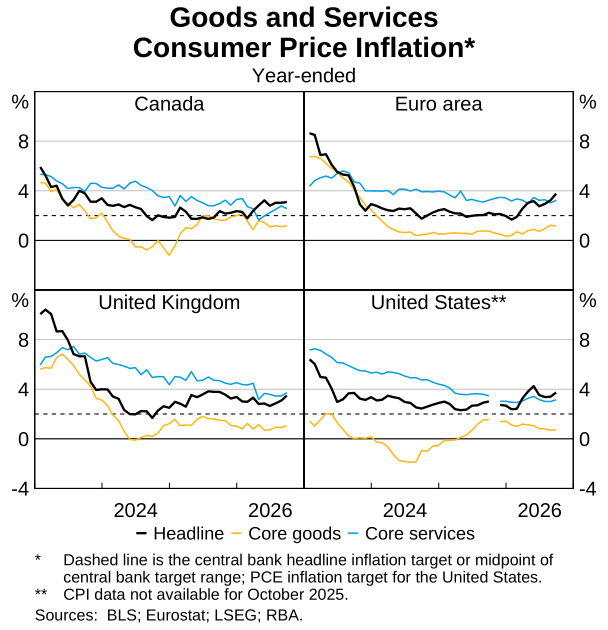
Upstream costs in AI-related supply chains are passing through to some core consumer goods prices, while disinflation in services prices has stalled, leaving core inflation elevated. Core goods inflation has picked up in many advanced economies this year and remains above its pre-pandemic averages in most economies. Prices of some consumer electronics have risen sharply as upstream costs in AI-related supply chains have been passed through to related consumer goods like personal computers. Impacts on aggregate headline and core measures of inflation have so far been limited because the affected goods tend to have small weights in consumer price baskets. Core services inflation remains above rates consistent with central bank targets and progress on disinflation in a number of advanced economies has stalled alongside upward pressure on transportation costs and signs of strengthening activity in their services sectors.
2.3 Domestic economic activity
GDP growth has slowed to below its potential growth rate in 2026, as some of the factors that supported above-trend growth in late 2025 (including strong growth in income) have waned. The initial phase of the Middle East conflict looks to have weighed only modestly on activity growth, as expected. However, the slowing has been a little more gradual than was expected in August, largely reflecting stronger-than-expected business investment related to data centres and the renewable energy transition. Household consumption growth has moderated broadly as expected, despite consumer sentiment being very low, supported by resilient household balance sheets and modest real income growth. By contrast, housing market conditions have eased by more than expected over recent months.
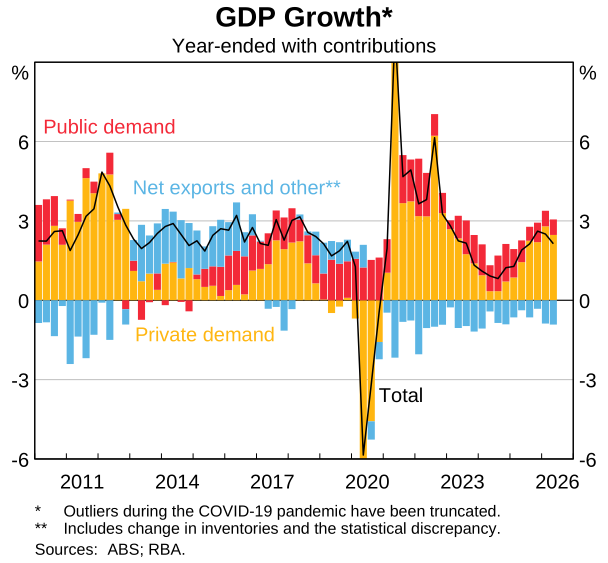
Growth in domestic activity has slowed in 2026 following strong growth over the second half of 2025.
GDP grew by 0.4 per cent in the June quarter, below its potential growth rate but a little stronger than expected in the August forecasts (Graph 2.9). Growth eased in the first half of 2026. That reflected softer growth in household consumption, exports and public demand, which outweighed strong growth in dwelling investment and business investment. The strength in business investment was relatively broad-based, though spending related to data centres and renewable energy projects was particularly strong. Investment in data centres has mostly been met by stronger imports, which has limited the impact on overall GDP. Given the usual lags, the recent tightening in monetary policy and easing in conditions in the established housing market are assessed to have had only modest effects on GDP growth in the first half of the year.
Household consumption growth has slowed this year to be a little below trend, consistent with the earlier slowing in the growth of household income.
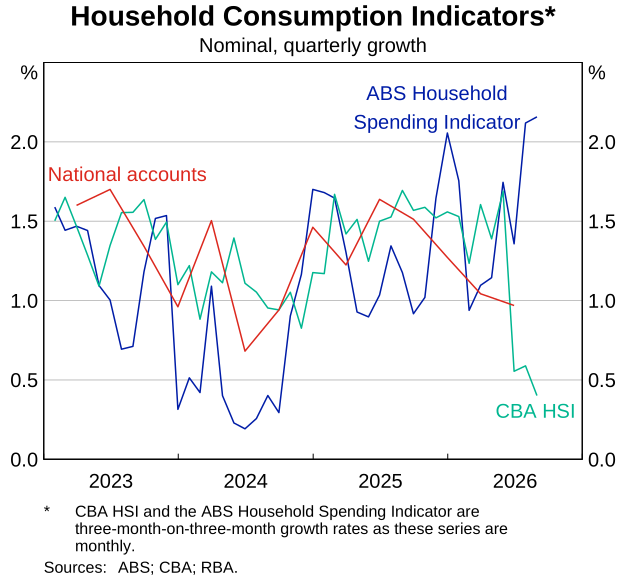
Consumption growth in the June quarter was as expected, with the net effects from the Middle East conflict appearing to be modest. Household consumption grew by 0.4 per cent in the quarter and year-ended growth slowed to 1.8 per cent alongside slowing growth in income. Australians’ spending on overseas travel fell sharply in the quarter, and consumption of fuel and transport services declined. However, this was largely offset by stronger electric vehicle purchases and discretionary spending domestically.
We assess that consumption growth in the September quarter was little changed from the June quarter’s below-trend rate, though given the mixed signals from the available timely indicators, this assessment is quite uncertain (Graph 2.10). The ABS Household Spending Indicator, which captures spending within Australia, was unchanged in August but points to strong quarterly growth in nominal spending. However, other indicators, including liaison and transaction data from some banks, suggest more modest growth. Vehicle purchases remained at very high levels in July and August but are not expected to contribute much to growth in the quarter. There appears to have been only a modest recovery in overseas travel so far, based on spending and departures data.
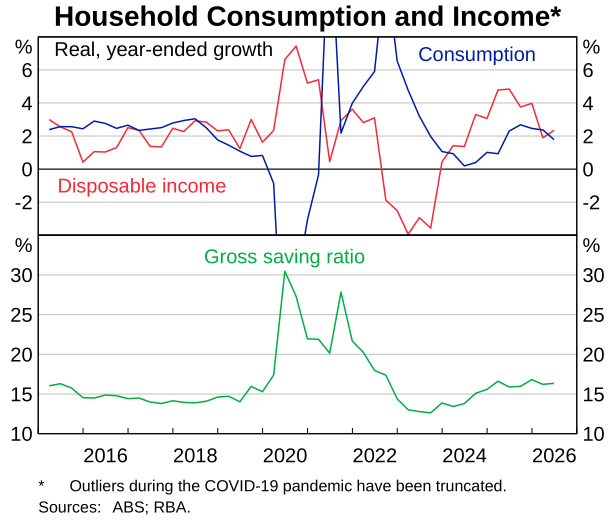
The moderation in consumption growth this year, compared with the second half of last year, is consistent with the earlier slowing in growth in household income. Year-ended growth in real household disposable income has slowed materially as the earlier boost from the Stage 3 tax cuts has waned, alongside slower growth in labour and rental income and higher inflation (Graph 2.11). Despite consumer sentiment remaining near all-time lows (across all income levels and for both renters and homeowners, regardless of whether they have a mortgage), the household saving ratio has been relatively stable since the start of the year, suggesting little change in aggregate consumption or saving behaviour so far. This is consistent with the fact that household balance sheets remain quite resilient on average – real household net wealth remains around 37 per cent higher than its pre-pandemic level – and with the results of previous analysis that sentiment is typically not an independent driver of consumption over and above fundamentals such as income and wealth. However, there is a risk that the multiple headwinds affecting households and historically low sentiment have a greater bearing on household spending decisions than would normally be expected (see Chapter 3: Outlook).
Business investment grew strongly over the past year; while increased investment in data centres and renewable energy projects were key drivers, investment picked up across other industries too.
Business investment in the June quarter was significantly stronger than expected, increasing by 10.5 per cent over the year (Graph 2.12). While investment declined a little in the quarter, we had expected a larger decline following very strong growth in the March quarter related to data centres. Non-residential construction, particularly of lumpy renewable energy projects (unrelated to data centres), made the largest contribution to the upside surprise on investment. Data centre investment grew strongly over the past year but was volatile. Much of this spending was on imported equipment, which limited the boost to GDP. Strength in investment was also evident across a broad range of industries, consistent with the earlier easing in financial conditions and the upswing in domestic activity through 2025.
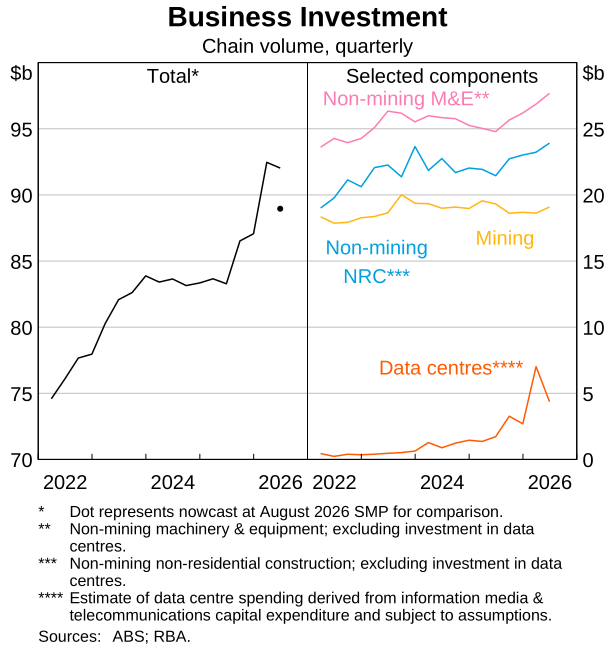
Firms’ surveyed capital expenditure intentions for the year ahead have been revised higher, underpinned by strong growth in expected investment in data centres and renewables (Graph 2.13). Building approvals for these industries have risen persistently and firms in the liaison program note that buoyant conditions for data centre development could support renewable energy investment in the medium term. Timely trade data point to strong data centre investment in the September quarter; imports of equipment related to data centre fit outs increased sharply in July and August, while prices are also expected to have risen alongside surging global demand for AI-enabling products.
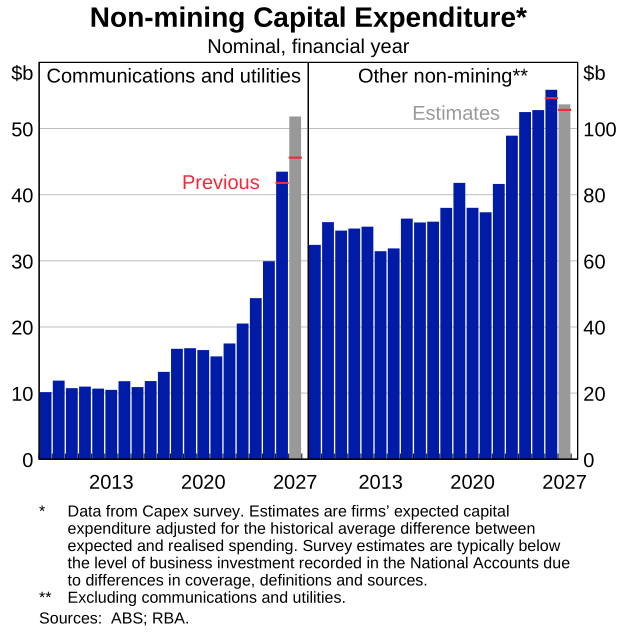
Outside of data centres and renewables, capital expenditure intentions suggest investment will decline a little but remain around the average level of recent years. The effects of tighter monetary policy and cost pressures related to the Middle East conflict appear to be dampening capital expenditure intentions a little. Surveyed business conditions in the September quarter declined to their lowest level since 2020, consistent with continued input cost growth in recent months weighing on profitability, while business confidence also remains very low. However, there is only a moderate correlation between business conditions, business confidence and investment activity. Notwithstanding the modest decline expected over the year ahead, firms in the liaison program expect investment to remain a little above the long-term average.
Established housing market conditions have continued to weaken by more than expected, driven by a range of factors, including higher interest rates and tax changes for investors.
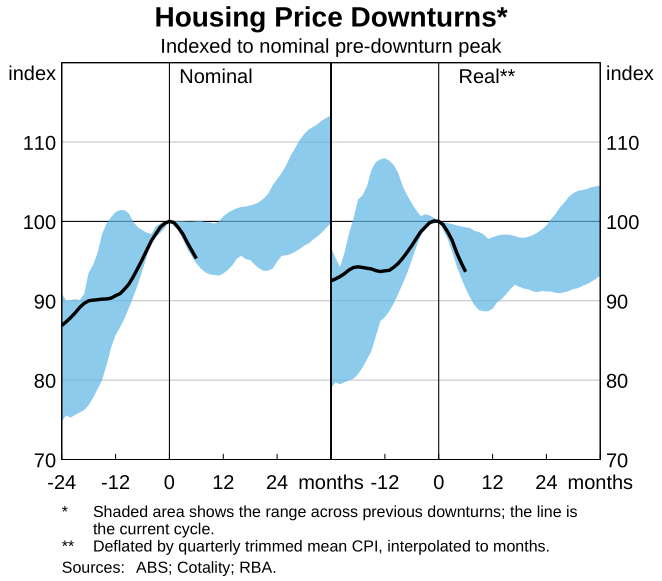
In September, national housing prices were 4.7 per cent below their recent peak (Graph 2.14). The current downturn is one of the steepest over the past 50 years, and price declines have broadened to most capital cities. Housing market activity has also continued to soften, with auction clearance rates remaining very low, time on market rising sharply to above long-run average levels and housing market turnover declining to low levels.
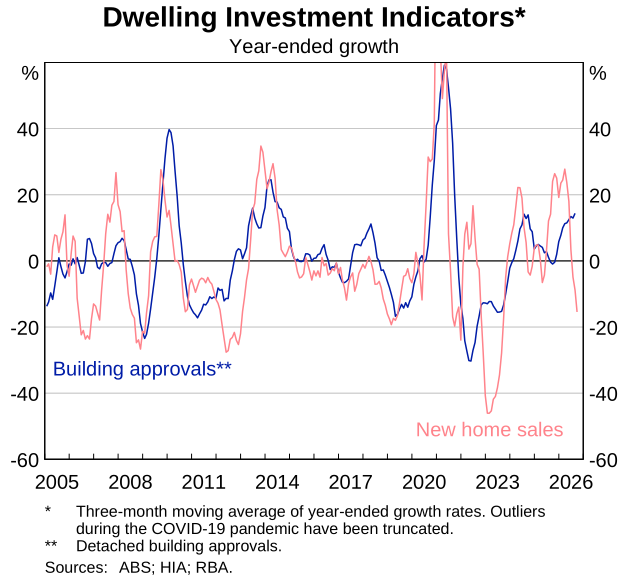
Dwelling investment was much stronger than expected over the first half of 2026, although leading indicators of activity have started to soften, consistent with the ongoing housing market downturn (Graph 2.15). Activity was stronger than expected in the June quarter and there were also upward revisions to earlier periods, suggesting there is more capacity in the sector than previously assessed. Growth in higher density construction and renovation activity were particularly strong, but construction of detached housing also increased over the year. Elevated cost growth and trade availability measures remain consistent with ongoing capacity pressures. Consistent with the usual lags, early indications of a softening in residential construction activity have become visible in recent months following the declines in established housing prices. HIA new home sales, a leading indicator of dwelling demand, have declined materially, and many builders in the liaison program have reported a decline in enquiries, buyer conversion rates and sales.
Public demand growth has moderated over the past year.
Public demand was weaker than expected over the first half of the year, with growth moderating from elevated rates observed over recent years. An easing in public consumption growth reflected the ending of some temporary cost-of-living measures, alongside moderation in some categories of government spending such as defence and disability and aged care services. Public investment has moved around a broadly stable level since late 2024, and budget projections continue to suggest that there is a substantial pipeline of public infrastructure projects.
Exports supported GDP growth in the June quarter, though the strength largely reflected temporary supply factors and growth has slowed since late 2025.
Exports increased by 0.8 per cent in the quarter, in line with expectations and driven by resource and manufactured exports, though year-ended growth slowed further. A rebound in resource exports largely reflected a recovery from weather-related disruptions in the previous quarter, met by strong mining inventory drawdowns. As expected, the effect of the Middle East conflict on resource exports has largely operated through higher commodity prices and export earnings; production and export volumes are unlikely to respond materially to price movements unless higher prices are expected to persist, given the long lead times for new investments. Services exports have declined this year, reflecting declines in both education and tourism exports, with support from stronger global growth offset by changes to student visa settings, some disruption to international travel from the Middle East conflict, and the appreciation of the Australian dollar since late last year. The boom in AI-related activity globally does not appear to have had a material influence on Australia’s exports, as production of critical minerals remains small and the expansion in data centre capacity has been to service domestic demand for computing capacity.
2.4 Labour market and wages
Labour market conditions have eased by more than expected recently. This easing is judged largely to reflect stronger-than-expected labour supply, rather than an unexpected weakening in labour demand. Elevated cost-of-living pressures may be leading some people to seek additional hours or enter the labour force, which may be contributing to the increase in labour supply. Timely indicators of labour demand, such as job advertisements, are generally consistent with stable growth in labour demand in the near term, though signals differ across the measures. Despite the recent easing in conditions, we continue to assess that the labour market remains a little tight (see section 2.5 Assessment of spare capacity). Wages growth was stable over the first half of 2026 and in line with expectations, though growth in unit labour costs picked up in the first half of the year to be further above average, and a little stronger than anticipated. Liaison contacts’ expectations for wages growth over the year ahead remain elevated, driven by an expected continuation of cost-of-living pressures.
Labour market conditions have eased by more than expected in recent months.
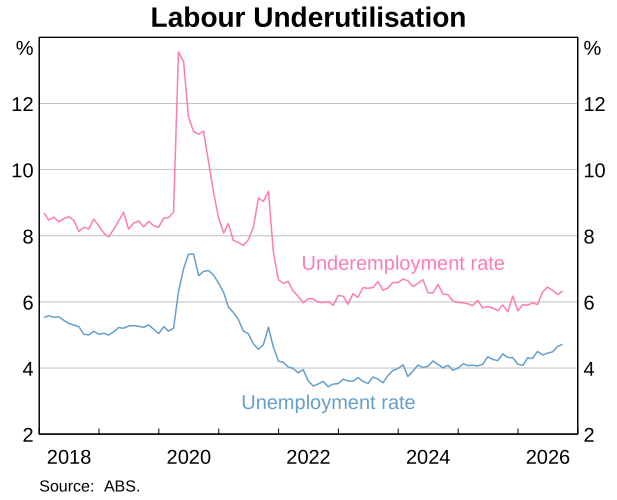
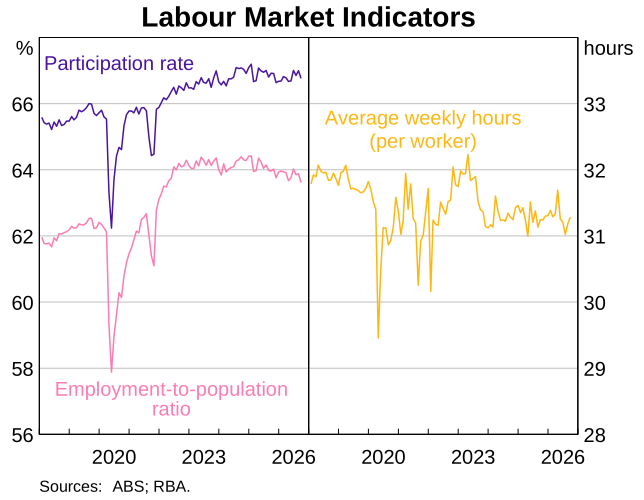
The unemployment rate was 4.7 per cent in the month of September, and averaged 4.6 per cent in the September quarter (Graph 2.16).2 This was higher than our August Statement forecast of 4.4 per cent for the quarter and was accounted for by stronger-than-expected labour force participation rather than weaker-than-expected employment. The underemployment rate increased to 6.3 per cent in September, though remained low by historical standards.
Over the year to the June quarter, employment growth was increasingly driven by the market sector, with construction making the largest contribution to growth. In the September quarter, the employment-to-population ratio was 63.8 per cent, in line with expectations in August (Graph 2.17). After declining for a few months, average hours per worker have partially recovered recently, to be near their levels at the beginning of the year (Graph 2.17).
The participation rate increased to 66.9 per cent in the September quarter, above our expectations, reflecting ongoing resilience in labour supply (Graph 2.17). The participation rate remained around historically high levels, supported by long-run trends such as higher female participation, as well as cyclical pressures – such as elevated cost-of-living pressures – which may be encouraging people to enter or remain in the labour force. The share of employed persons holding multiple jobs also increased sharply from 6.5 per cent to 6.9 per cent in the June quarter.
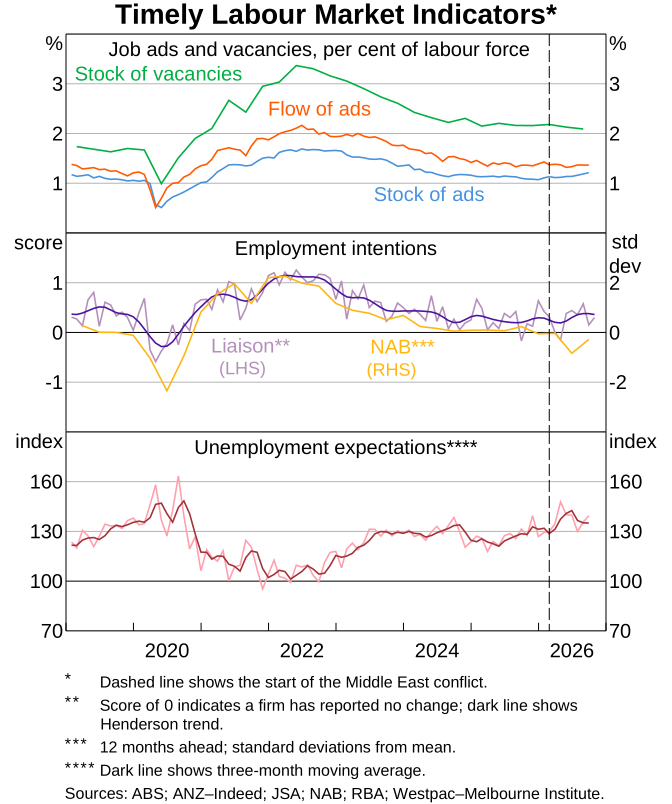
Leading indicators generally point to stable growth in labour demand in the near term, although the signal differs somewhat across measures. Job advertisements have increased slightly or remained broadly stable over recent months, while vacancies (as a share of the labour force) declined in the past quarter (Graph 2.18). Employment intentions from business surveys partially rebounded in the quarter and the measure from the RBA’s liaison program has also strengthened a little since earlier in the year. Households’ unemployment expectations have ticked back up in August and September to be a little above their long-run average.
Aggregate wages growth remained stable (at a relatively elevated rate) in the June quarter, as expected, but liaison contacts report a noticeable increase in wages growth since July.
The June quarter Wage Price Index (WPI) affirmed our assessment in the August Statement that growth in base wages had remained broadly stable. The WPI increased by 3.2 per cent over the year; private sector WPI growth remained broadly stable at 0.7 per cent in the quarter and eased to 3.1 per cent over the year, as expected (Graph 2.19). Wages growth for workers on individual arrangements – which tends to be most responsive to current labour market conditions – remained at 2.9 per cent over the year but eased a little relative to its pace in 2025, consistent with an easing in labour market conditions since then. Public sector WPI growth remained stronger than private sector WPI growth. Overall, the June quarter data are consistent with our assessment that labour market conditions remain a little tight.
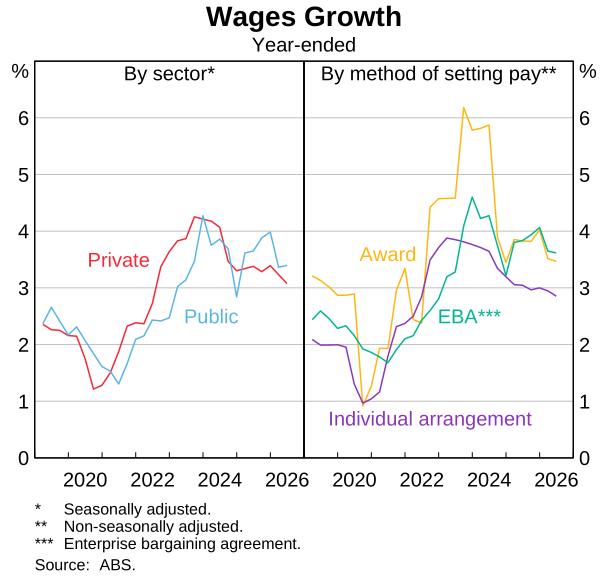
Wages growth is expected to have picked up in the September quarter, in part reflecting the recent Fair Work Commission (FWC) decision to increase all modern award wages by 4.75 per cent. Meanwhile, some pass-through from higher inflation to private enterprise bargaining agreements and individual arrangements is expected to have supported wages growth, as workers seek to preserve recent real wage gains. Consistent with this, liaison contacts have reported that wages growth has increased noticeably since July, including for firms that are not reliant on awards for setting wages. Liaison contacts’ expectations for wages growth over the year ahead remain elevated, driven by an expected continuation of cost-of-living pressures.
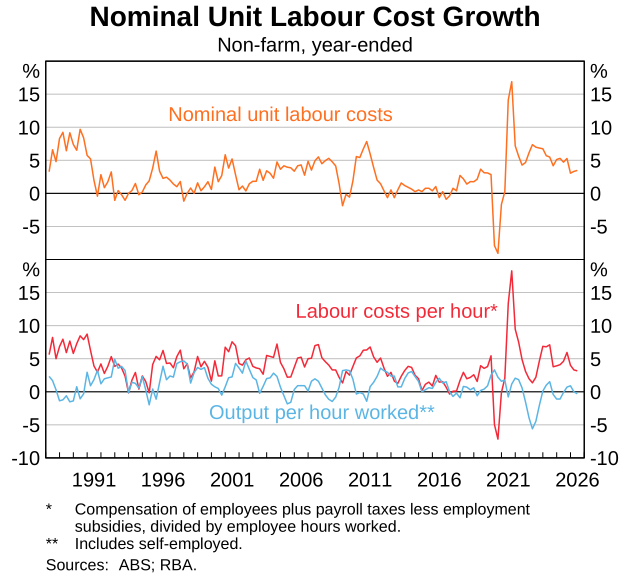
Growth in the national accounts’ measure of average earnings per hour (AENA) eased to 3.2 per cent over the year to the June quarter. AENA growth was stronger than forecast in the August Statement, suggesting there was a little more momentum in labour costs than previously expected. AENA is a broader measure of labour costs than the WPI but tends to be more volatile, and so provides a noisier read on wage pressures arising from conditions in the labour market. In real terms, AENA has grown by more than real WPI in recent years and is above its pre-pandemic level. Despite the easing in average earnings growth, it remained elevated relative to the current pace of productivity growth, and weaker productivity growth contributed to an increase in growth in unit labour costs (ULCs) in the first half of this year (Graph 2.20). At 3.5 per cent in year-ended terms, ULCs growth remained significantly above the rate that is consistent with inflation being at target, contributing to ongoing domestic cost pressures and pointing to some tightness in labour market conditions.
2.5 Assessment of spare capacity
Despite the recent slowing in demand growth and easing in labour market conditions, we continue to assess that there are some capacity pressures in the Australian economy. Further, those capacity pressures are now assessed to have been a little greater over the first half of the year than we thought at the time of the August Statement. A number of factors support this judgement, including: strong ongoing domestically generated cost and price pressures, particularly in components most sensitive to domestic capacity pressures; continued weak productivity outcomes; and survey evidence pointing to elevated capacity pressures. Consistent with that, we have raised our assessment of the non-accelerating inflation rate of unemployment (NAIRU) a little. A higher NAIRU implies tighter labour market conditions for a given unemployment rate. As a result, despite actual unemployment having increased recently, we assess that the labour market remains a little tight, broadly as anticipated in August.
Labour market conditions have eased over recent months, but are judged to remain a little tight.
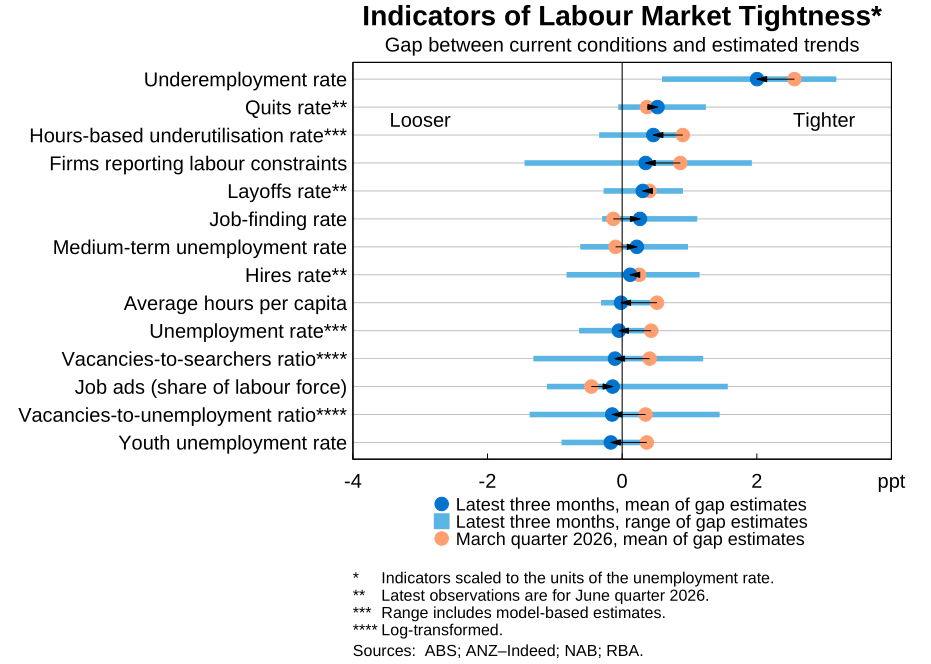
Most of the labour market indicators we monitor suggest some easing in conditions over recent months. But a majority are close to or slightly tighter than their estimated trend levels (Graph 2.21).3 The underemployment rate, hours-based underutilisation rate and quits rate in particular point to some tightness in the labour market.
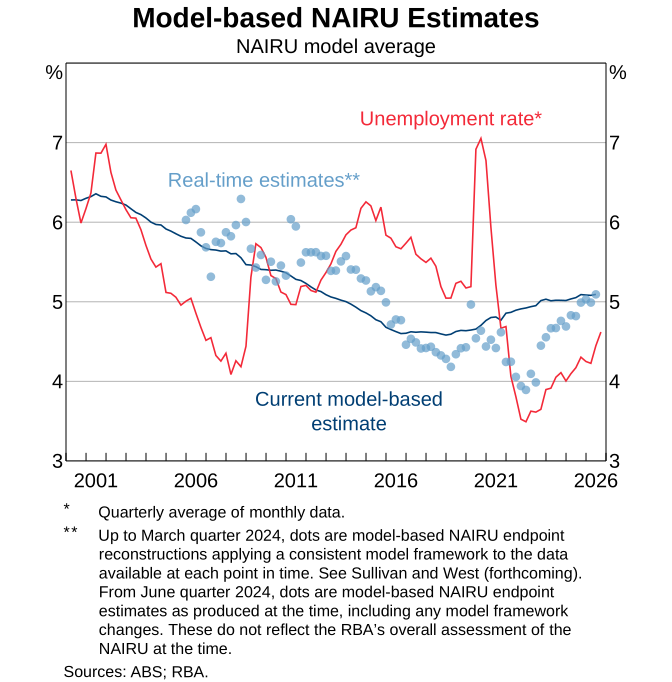
Model-based estimates of the NAIRU have gradually moved higher over recent years. The model average is now around 5 per cent (Graph 2.22), although these estimates are just one input to our overall assessment of the NAIRU (see below), alongside evidence from the broader suite of indicators and judgement. Model-based estimates have moved higher in response to persistently elevated unit labour cost growth and inflation over recent years.
We now assess the NAIRU to be slightly higher than was factored into the August forecasts. For some time we have noted that our model-based estimates have been pointing to a higher NAIRU – and therefore more capacity pressures – than the broader suite of labour market indicators (Graph 2.23). Our overall assessment has generally taken more signal from the broader set of indicators. However, underlying inflation and labour cost growth have been persistently elevated, and stronger than expected recently (see section 2.6 Inflation). These outcomes suggest putting a little more weight on the model-based estimates than we had been doing. Accordingly, we are increasing our assessment of the NAIRU to around 4¾ per cent. This is a modest adjustment when compared with the range of uncertainty around estimates from either the models or broader set of indicators.
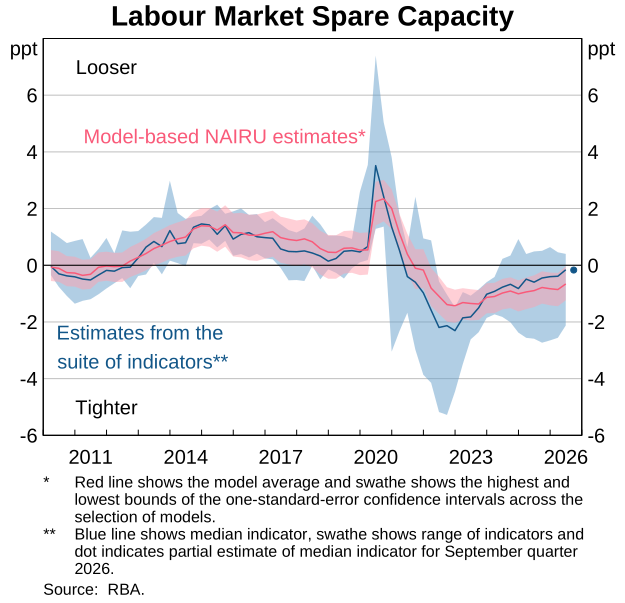
Given this judgement, we continue to assess that the labour market is a little tight, despite the recent easing in a number of indicators. The revision to our NAIRU estimate implies that the labour market was a little tighter through the first half of this year than previously assessed. It also implies that there was a small amount of tightness remaining in the September quarter, despite the unemployment rate having increased by more than expected in recent months (because the unemployment rate remained a little below our upwardly revised assessment of the NAIRU). That is consistent with the signal from the broader suite of labour market indicators for the September quarter, which continue to suggest a little tightness in labour market conditions.
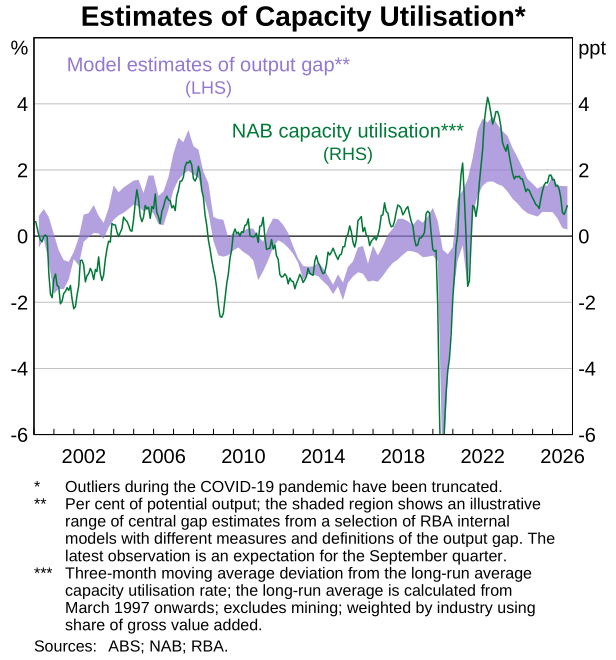
Economy-wide indicators continue to suggest that some capacity pressures remain in the broader economy, consistent with the signal from the labour market. The June quarter output gap is now estimated to have been a little larger than assessed in August.
Slower productivity growth has lowered the economy’s potential growth rate compared with previous decades. The level of productivity is broadly unchanged since the end of 2019. This has contributed to capacity pressures persisting despite relatively modest GDP growth in recent years. Combined with resilient wages growth and elevated growth in non-labour input costs, the lack of productivity improvement is likely to have limited firms’ ability to absorb higher costs without raising output prices and to have contributed to inflation being above the target range.
Indicators of capacity utilisation continue to point to there being some capacity pressures in the economy. Signals across sectors are mixed, but the NAB measure of capacity utilisation remains above its historical average. There is also marked variation across states, with business liaison suggesting that parts of Queensland in particular continue to face capacity constraints, whereas conditions are less tight in Victoria.
Taking survey evidence together with model-based estimates of the output gap, we assess that the output gap was positive in the June and September quarters (Graph 2.24) and slightly larger than assessed in August. That reflects both stronger-than-expected real activity data and a small downward judgement applied to the level of potential output. This is consistent with our judgement on the NAIRU; other things equal, a higher NAIRU implies lower potential supply capacity. Our judgement on potential output and the output gap is relatively modest compared with the uncertainty around estimates of capacity pressures; the range of model estimates and responses to the RBA survey of market economists in August suggests the output gap could be between zero and 1½ per cent. An alternative rationale for downwardly adjusting the level of potential output would be to take greater signal from the weakness in actual productivity outcomes for the trend level of productivity. We have not changed our expectation of potential output growth and productivity growth in the medium term.
2.6 Inflation
Inflation in the September quarter was stronger than anticipated in the August forecasts and remained well above target, as some of the upside risks identified in August materialised. Retail fuel prices made the largest contribution to the upside surprise in headline inflation. We judge that domestic capacity pressures also made a stronger-than-expected contribution to both underlying and headline inflation in the quarter. Wider cost pressures related to the Middle East conflict have contributed to inflation, with the size of these effects having been broadly as anticipated so far (excluding the direct effect of retail fuel prices). Measures of cost growth remain elevated, with renewed pressure on fuel costs following the re-escalation of the conflict and ongoing cost pressures from wages, technology and services. Some measures of inflation expectations – including longer-term measures – have increased, and this may be contributing to inflation if it is influencing households’ and firms’ expectations for wages and cost growth. Households and firms have increasingly been paying greater attention to inflation, which may make their inflation expectations more sensitive to future shocks.
Headline inflation in the September quarter was stronger than anticipated in the August Statement.
In year-ended terms, headline inflation was unchanged at 3.9 per cent in the September quarter. This outcome reflected stronger-than-expected underlying inflation, as well as stronger-than-expected growth in automotive fuel prices because of a material increase in regional benchmark prices for refined fuel (see section 2.1 Commodity price developments) (Graph 2.3). Fuel contributed around 0.4 percentage points to year-ended headline inflation in the quarter, which was higher than expected at the time of the August Statement. Headline inflation in the month of September increased to 4.3 per cent, consistent with ongoing upward pressure from fuel prices (Graph 2.25).
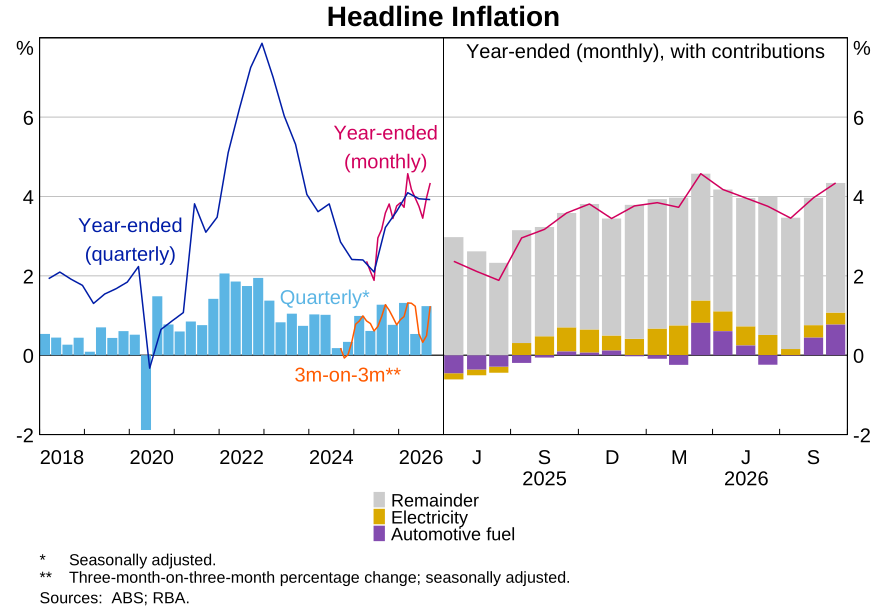
Underlying inflation picked up in the September quarter by more than expected; we attribute this to stronger-than-expected domestic capacity pressures.
Trimmed mean inflation increased to 1.0 per cent in the September quarter, from 0.8 per cent in the June quarter, and picked up to 3.7 per cent in year-ended terms. Various measures of underlying inflation from the monthly CPI also picked up in the September quarter and remained elevated in year-ended terms (Graph 2.26). A majority of items in the CPI (by count and weight) recorded inflation above rates consistent with the inflation target, and this share has increased since the beginning of the year. We assess that the upward surprise in underlying inflation reflects stronger-than-expected domestic capacity pressures this year. Inflation for market services (excluding telecommunication and domestic travel), which is typically among the most sensitive to domestic conditions, increased and was materially stronger than expected in the August forecasts; some of this strength reflects the award wage increase.
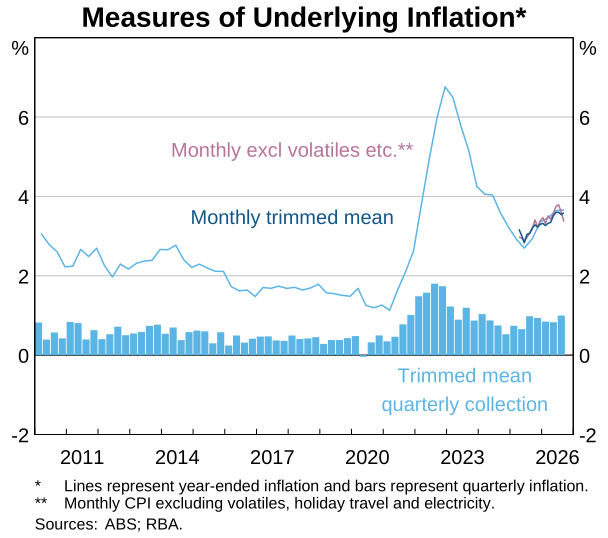
Cost pressures related to the Middle East conflict are judged to have contributed to higher prices in the September quarter.
Conflict-related cost pressures are estimated to have contributed around 0.1 percentage points to quarterly trimmed mean inflation (excluding the direct effect of higher retail fuel prices), broadly as expected in the August Statement. However, these cost pressures appear to have affected a broader range of prices in the quarter than previously anticipated. Increases in building materials costs are judged to have had less effect on new dwellings inflation than expected. However, information from RBA liaison suggests conflict-related cost pressures contributed to price increases for other items, including some market services and durable goods. Many liaison contacts have continued to report higher fuel costs, while some have also continued to note ongoing concerns about higher costs for oil-derived products such as plastics following the re-escalation of tensions in the Middle East (see Box C: Insights from Liaison).
Broader measures of cost growth from business surveys and RBA liaison remain elevated (Graph 2.27). Liaison contacts report that a broad range of cost pressures – including for wages, technology and services – are contributing to expectations of continued elevated cost growth over the year ahead. AI-related cost pressures have had only a modest impact on consumer prices to date, but strong price growth for technology-related goods and services such as computers and software is contributing to firms’ cost pressures. Firms are also noting potential future risks to food supply chains arising from El Niño and avian influenza, which could put further upward pressure on costs. Firms’ expectations for aggregate inflation are also elevated, which may be reinforcing expectations of strong growth in their own costs.
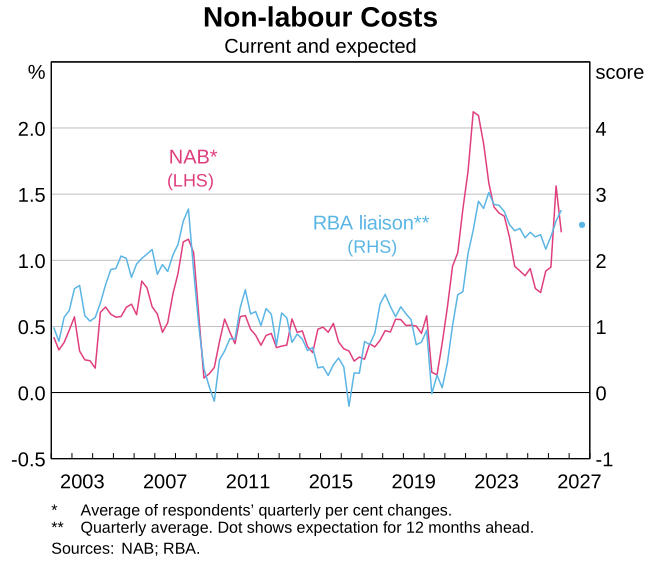
Survey and liaison data suggest that many firms have not yet been able to fully pass through increases in labour and non-labour costs to consumer prices, resulting in downward pressure on margins over the past few months. However, in the Business Outlook Scenario Survey (BOSS) in September, firms reported that they plan to continue to increase prices in response to past cost increases arising from the Middle East conflict, and that they plan to pass through a greater share of these future cost increases to prices than they had planned in April.4 Moreover, firms that experienced larger changes in costs in response to the conflict have increased the frequency with which they adjust prices. Consistent with this, liaison contacts are not expecting growth in costs, wages and selling prices to ease much over the year ahead.
Inflation was elevated across most sectors in the September quarter and picked up for market services, rents and consumer durables.
Market services inflation (excluding telecommunications and domestic travel) increased to 1.3 per cent in the September quarter, from 1.1 per cent in the June quarter. In year-ended terms, it increased to 4.2 per cent (Graph 2.28). We assess that this strength primarily reflected domestic capacity pressures and, to a lesser extent, pass-through of conflict-related cost pressures (such as from food and fuel inputs). Some of the recent increase in inflation, for example in the prices of restaurant meals, likely reflected the impact of the FWC award wage decision (which came into effect on 1 July). While the effect of the award wage increase on inflation may be short-lived, firms’ apparent ability to pass through this cost increase to prices is consistent with there being some remaining capacity pressures.
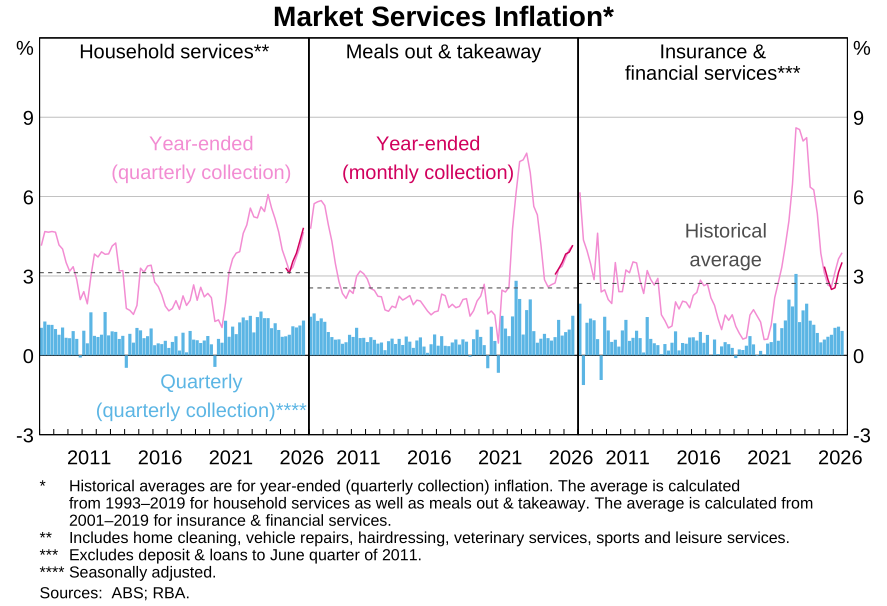
New dwelling construction prices increased by 1.0 per cent in the September quarter to be 5.2 per cent higher over the year (Graph 2.29). This was weaker than expected in the August Statement, which we judge reflected smaller conflict-related cost effects than anticipated. Liaison information suggests that while homebuilders continue to experience elevated labour and materials costs, they have been less able to pass these costs through to prices recently in states where housing demand has weakened. New dwelling inflation tends to lag conditions in the established housing market, so this may be early evidence that the easing in housing market conditions that began late last year is beginning to weigh on new dwelling construction prices (see section 2.3 Domestic economic activity).
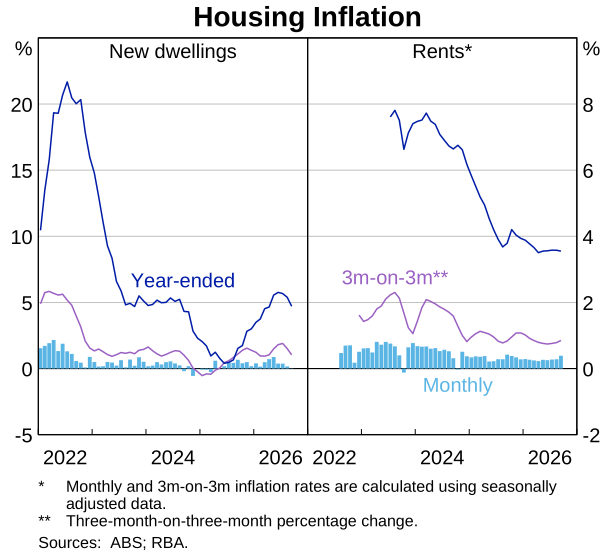
CPI rent inflation increased to 0.9 per cent in the September quarter, from 0.6 per cent in the June quarter, and was 3.6 per cent in year-ended terms. The pick-up in the quarter was stronger than expected in the August Statement. This may be early evidence that the earlier strong growth in advertised rents – arising from an imbalance between housing supply and demand, as reflected in low vacancy rates – is beginning to pass through to CPI rents, following limited pass-through over the year to the June quarter. More recently, vacancy rates have increased modestly and growth in advertised rents has slowed.
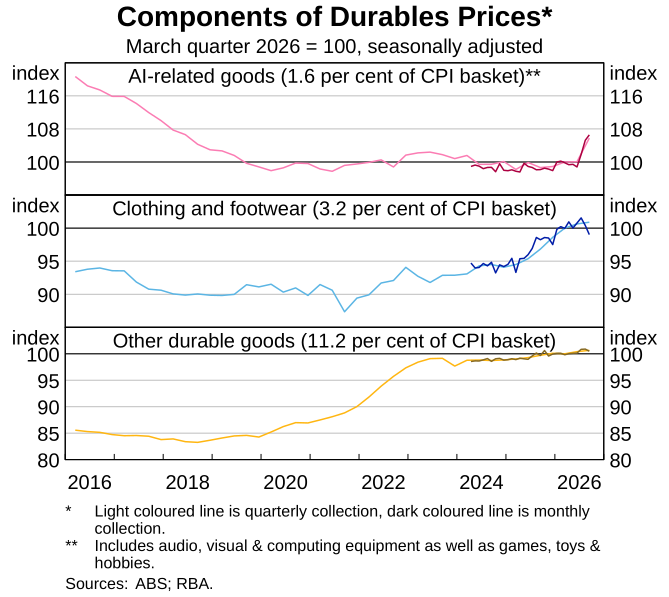
Retail goods inflation was stronger than expected in the September quarter, largely driven by a pick-up in consumer durables inflation. This outcome reflected higher prices for some consumer electronics (such as computers, televisions and gaming consoles) driven by strong memory chip cost growth associated with demand for AI-enabling inputs (Graph 2.30). Although it is too early to judge the persistence of these price rises, similar price increases from AI-related cost pressures have been observed in other advanced economies (see section 2.2 Global economic conditions).
Some measures of short-term inflation expectations have increased from already elevated levels. While most measures of longer-term inflation expectations remain consistent with achieving the inflation target, some have also increased.
Households’ short-term inflation expectations have increased in recent months, and are above levels observed prior to the Middle East conflict (Graph 2.31). Expectations rose sharply following the onset of the conflict and associated increase in fuel prices, before easing as fuel prices declined from May. More recently, they have increased again alongside stronger fuel price inflation and the re-escalation of the conflict. Firms’ short- and medium-term inflation expectations have also increased in recent months.
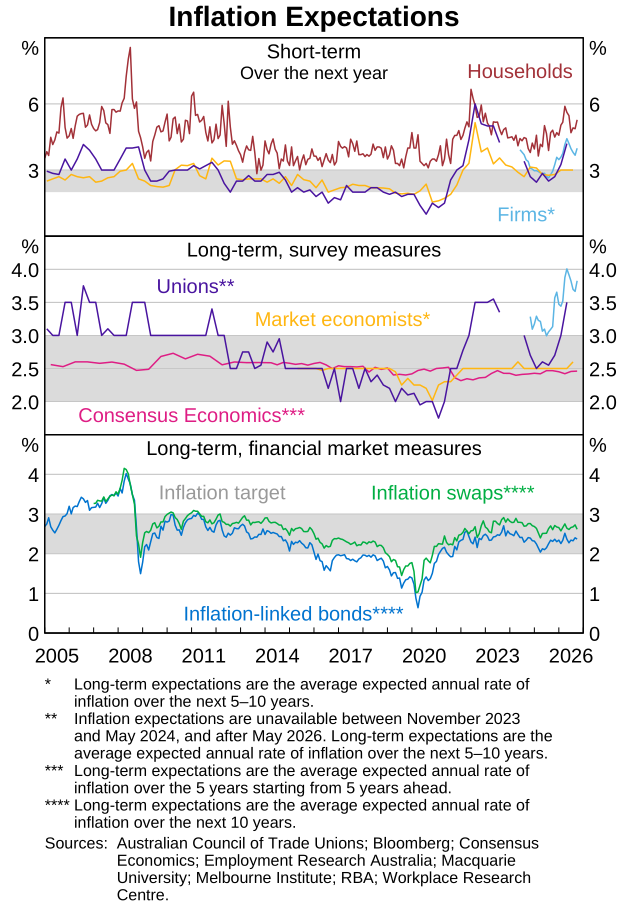
Longer-term inflation expectations are mostly consistent with the inflation target, although some measures have increased. Financial market measures of inflation expectations remain consistent with inflation at target over the longer term. However, other longer-term inflation expectations have increased. The median market economist now expects inflation to average 2.6 per cent over the next 5–10 years. Firms’ longer-term inflation expectations have also increased since mid-2025, and the BOSS survey suggests firms have become less confident that inflation will return to target, a sentiment also shared by some contacts in the liaison program.
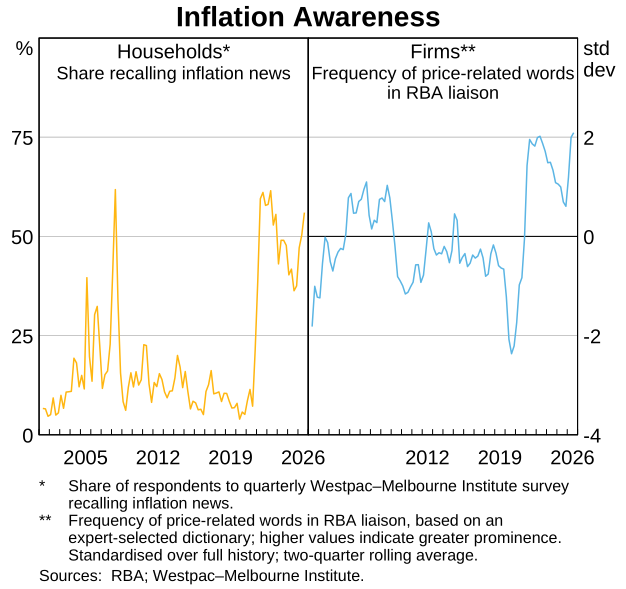
Elevated inflation expectations may be contributing to higher realised inflation if they are influencing households’ and firms’ expectations for wages and cost growth. Households and firms are increasingly paying more attention to inflation, which may make their inflation expectations more backward-looking and more sensitive to future shocks (Graph 2.32). The heightened attentiveness of households and firms to inflation – together with the re-escalation of the conflict – raises the likelihood that elevated inflation expectations feed into price- and wage-setting decisions, thereby posing a key upside risk to the outlook for wages growth and inflation (see Chapter 3: Outlook).
Endnotes
1 Authorities announced plans to invest around RMB7 trillion in the ‘Six Networks’ initiatives in 2026, as part of the 15th Five-Year Plan, with projects spanning water, energy, computing, communications, logistics and urban pipeline infrastructure.
2 Changes to the ABS Labour Force Survey in August may have introduced some additional volatility in seasonally adjusted employment and unemployment, although the ABS has said it expects these effects to be small relative to the normal month-to-month variation. For more information, see ABS (2026), ‘Supplementary Survey Methodology Changes in the Labour Force Survey’, September.
3 Some labour market indicators have been affected by changes to the Labour Force Survey from April 2026 onwards. See RBA (2026), ‘Box B: Changes to the Labour Force Survey’, Statement on Monetary Policy, May.
4 This is consistent with the pass-through of costs to prices and the role of expectations described in Georgiakakis F, J Hambur and C Ryan (2026), ‘Digest: The Literature on Non-linear Phillips Curves’, Insight 2026-01.