
Statement on Monetary Policy – November 20263. Outlook
Summary
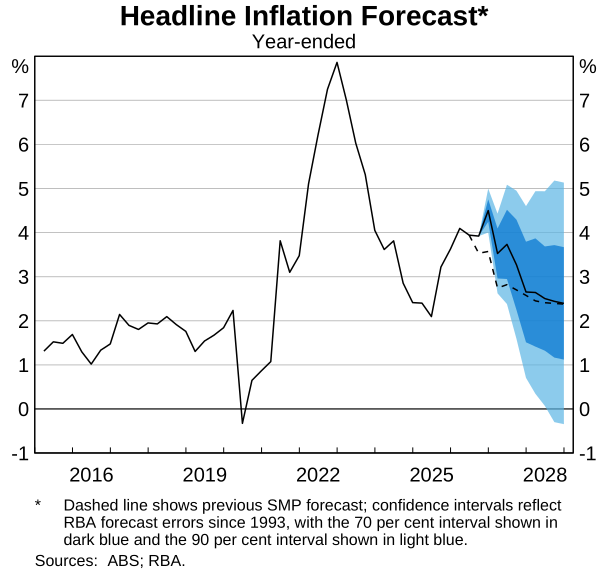
- The outlook for inflation has been revised materially higher, especially in the earlier part of the forecast period; the forecasts assume that the cash rate follows the market path. A number of upside risks flagged in the August Statement have since been incorporated into the central inflation forecast. Fuel and other commodity prices affected by the ongoing Middle East conflict are expected to contribute more to underlying and headline inflation than previously expected. Capacity constraints are also judged to have been somewhat greater throughout this year than we thought in August and inflation expectations have increased, adding to inflationary pressures. Underlying inflation is now expected to remain above 3 per cent until late 2027 and to reach 2½ per cent around mid-2028.
- Headline inflation is expected to remain above 3 per cent until late 2027, around three quarters longer than in the August forecast. Headline inflation is expected to peak at 4.5 per cent in the December 2026 quarter and reach the midpoint of the 2–3 per cent inflation target a bit later than was expected in August. The decline in inflation is expected to reflect conflict-related cost pressures easing and spare capacity emerging in the labour market and economy more broadly. Risks to the domestic inflation outlook are more balanced than they were in the August Statement, but still skewed to the upside. This reflects the incorporation in the central inflation forecast of some of the risks identified in August. However, inflation could be higher if global and domestic cost pressures are more persistent than assumed, or if inflation expectations rise further or exert greater influence on wage- and price-setting.
- The outlook for growth in Australia’s major trading partners has been revised higher, owing to a stronger outlook for AI-related activity and, more broadly, resilient demand. Growth is still expected to moderate from its current strong pace over the next couple of years, as the boost from AI-related activity slows and growth in China continues to ease. The risks to the outlook are relatively balanced. AI-related activity could continue to be stronger than expected, while ongoing higher energy prices could weigh on growth by more than anticipated. The rise in global interest rates presents risks on both sides of the outlook: it may signal stronger demand and investment than currently expected, but may also result in tighter financial conditions than assumed.
- The global inflation outlook has also been revised higher, reflecting renewed pressure from energy and other commodity prices, resilient demand and rapid growth in AI-related prices. The oil price assumption underpinning the forecasts is much higher than in August, reflecting the re-escalation of tensions in the Middle East in recent months. Consensus forecasters expect headline inflation to remain above central bank targets into 2027 in many advanced economies as a result of higher energy costs. More broadly, increases in a range of commodity prices and strong AI-related demand are driving up input costs, which are expected to be passed through to inflation to some degree. The risks to global inflation are judged to remain skewed to the upside.
- Australian GDP growth is expected to remain below estimates of potential growth over coming years. Based on financial market pricing, the forecasts assume the cash rate will increase by around 35 basis points by mid-2027; this cash rate path is up to 50 basis points higher than was assumed in the August forecasts. Compared with August, the outlook for GDP growth over the year ahead has been revised higher, driven by a stronger outlook for data centre investment. From mid-2027, however, forecast growth has been revised lower because of the higher assumed cash rate path and a weaker outlook for the housing market. Higher-than-expected global energy prices is also expected to weigh a little on activity. Overall, the forecast level of GDP at end-2028 is broadly unchanged from the August forecasts. The risks to domestic growth appear to be broadly balanced. There are upside risks to global and domestic economic activity from AI-related demand, but economic activity could be weaker if the Middle East conflict and the decline in housing prices affect the economy by more than assumed in the central forecast.
- Labour market conditions are expected to ease further, consistent with below-potential GDP growth. The unemployment rate is forecast to increase to 5.1 per cent by end-2028. This is around ¼ percentage points higher than previously expected, largely reflecting the higher starting point for the unemployment rate and an expectation that more people will remain in or join the labour force.
- Despite this, we assess that capacity constraints in the economy and labour market have been a little tighter than previously judged, contributing more to wage and inflationary pressures (see Chapter 2: Economic Conditions). From this starting point, we judge that aggregate demand and potential supply in the economy are likely to reach balance next year (slightly later than previously thought), before spare capacity emerges. It is possible we have misjudged the supply capacity of the economy and labour market.
3.1 Key judgements in the forecast
The central forecast incorporates many judgements, such as the choice of models used and whether to deviate from the models given the signal from recent data or information from liaison. These judgements are extensively considered and debated during the construction of the forecast. The three most important judgements for our current assessment of the economic outlook are discussed below.
The annual review of the staff’s economic forecasts will be discussed at the December Board meeting (and the results will be published following the meeting). The review will assess what we have learned about the economy, how the judgements that underpin the forecasts have fared and how the risks around the outlook have evolved.
Key judgement #1 – Global oil and refined product prices decline gradually but remain above pre-conflict levels.
The assumption that global oil and related prices decline gradually but remain above levels prior to the Middle East conflict underpins the central forecasts (Graph 3.1). The assumed oil price in the December quarter is 35 per cent higher than assumed in August, following a re-escalation of the conflict in recent months. From this higher starting point, oil prices are assumed to be 11 per cent higher by end-2028 than assumed in August. This assumed decline is consistent with energy markets continuing to adjust to the conflict and/or progress towards resolution of the conflict, and is within the range of the latest Consensus forecasts. The spreads between prices for refined fuels and Brent crude oil, which have widened since the start of the conflict, are assumed to return to their historical averages by mid-2027 – around two quarters later than assumed in the August Statement. Oil and refined product prices could rise further or remain elevated for longer than assumed, which would drive up global and domestic inflation and could also weigh on activity (see Key risk #1 and Key risk #3).
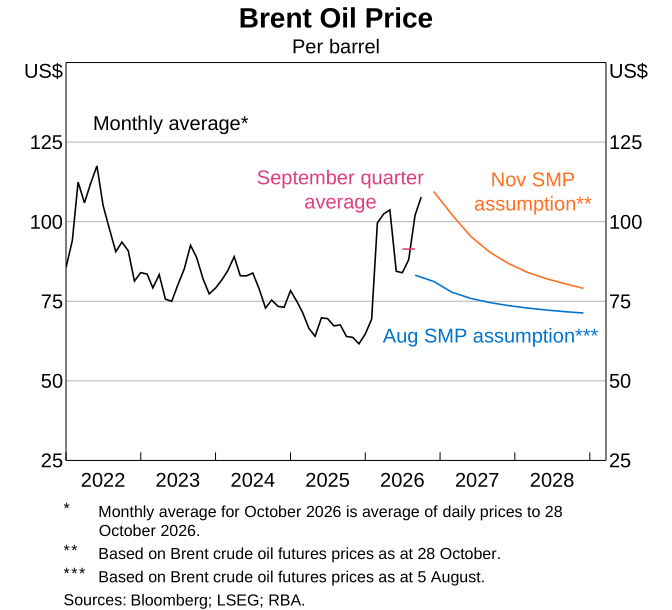
Key judgement #2 – Restrictive financial conditions will contribute to the emergence of some spare capacity in the economy and the labour market, helping reduce inflationary pressures.
The forecasts are conditioned on a market path for the cash rate that increases by 35 basis points by mid-2027, before declining a little to stabilise at 4.8 per cent in 2028. This is up to 50 basis points higher than the path that underpinned the August forecasts. Conditioned on that path, the forecast is for a period of below-potential growth that is sufficient to generate some spare capacity in the economy and help return inflation to target. In other words, the assumed path for policy is judged to be restrictive.
One way to cross-check the plausibility of this judgement is to compare the market path with current estimates of the neutral cash rate derived from models and market economists. The assumed cash rate path lies above the top of the range of these estimates (see Chapter 1: Financial Conditions). These estimates are subject to considerable uncertainty, however, and it is common for them to be revised as more information becomes available. A key question is how to interpret the recent material increase in longer-term real yields (see Box A: How Does an Increase in Longer-term Real Yields Affect Financial Conditions? and Box B: Developments in the Neutral Rate of Interest). To the extent that this reflects higher neutral policy rates globally (and for Australia), the assumed cash rate path would, by itself, be less restrictive and could weigh less on activity than projected. On the other hand, if the recent rise in global yields primarily reflects higher term premia, that would imply tighter financial conditions than assumed in the forecast, although this is less likely to materially change our assessment of restrictiveness, given the relatively short duration of household and business liabilities in Australia.
Key judgement #3 – Some of the current drivers of inflation are expected to persist and will take time to moderate.
Some of the upside risks to the inflation outlook identified in the August Statement have since materialised and are now incorporated in the central forecast for inflation. These factors have led to an upward revision to the inflation outlook over the next year or so and a delay in the expected timeframe for inflation to return to the target range. Higher fuel and other commodity prices from the Middle East conflict are expected to put sustained upward pressure on inflation over the coming year as these higher input costs are passed on to consumer prices to some degree over time. These cost pressures are expected to ease over the latter part of the forecast period, contributing to the decline in inflation. The change to the judgement around the degree of domestic capacity constraints implies more persistent inflationary pressures than in the August forecasts, all else equal (see Chapter 2: Economic Conditions). That is, we now assess that domestic capacity pressures have been contributing more to recent elevated inflation outcomes than we had previously judged, and from this higher starting point will contribute a bit more to inflation in the next year. The elevated level of inflation expectations is also projected to influence price- and wage-setting behaviour and boost inflation and wages growth a little more than previously expected.
We view the risks to the inflation outlook as still skewed to the upside. Alongside the potential for global cost pressures to be higher than assumed, it is also possible we have misjudged the extent of capacity pressures in the economy and the labour market, and the impact of the recent increase in inflation expectations in price- and wage-setting behaviour (see section 3.4 Key risks to the outlook).
3.2 The global outlook
The outlook for growth in Australia’s major trading partners (MTPs) has been revised higher over the next couple of years, but growth is expected to moderate from its current strong pace.
The MTP GDP growth forecast has been revised upwards to 4.0 per cent in 2026, before slowing to 3.5 per cent in 2027 and 3.4 per cent in 2028 as growth in global AI-related activity and China is expected to moderate (Graph 3.2). Growth has been above some estimates of potential and stronger than expected over the past year, reflecting strong AI-related activity and, in some economies, continued fiscal support. These have more than offset the headwinds from the Middle East conflict. MTP growth is expected to moderate to around potential over 2027 and 2028. Overall, we judge that the risks around this outlook for MTP growth are broadly balanced. The expansion in global AI-related investment and production may be more persistent than Consensus forecasters have factored in, but higher energy prices could also weigh on activity by more than currently assumed. The outlook for MTP growth as a whole is broadly in line with the International Monetary Fund’s projections in the October 2026 World Economic Outlook.
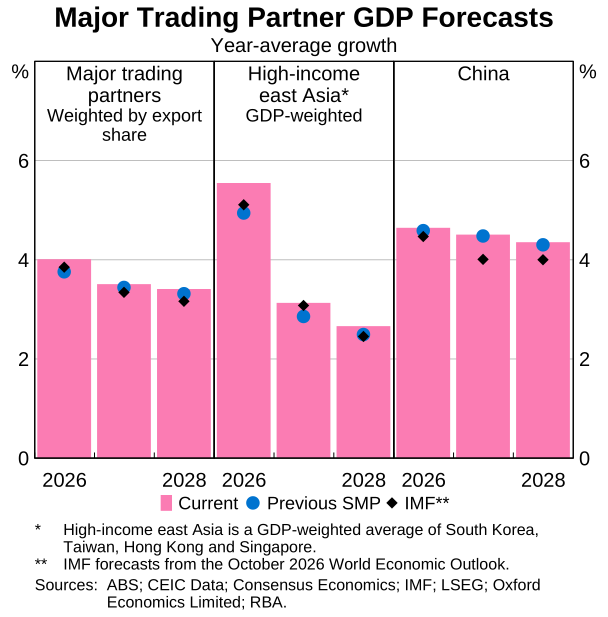
The upward revision to MTP growth is concentrated in high-income east Asian economies, which are key exporters of AI-related goods. Strong demand for semiconductors and other AI-enabling technologies has supported activity in economies that are deeply integrated into regional technology supply chains, such as South Korea and Taiwan. While the outlook for growth in 2027 has been revised a little higher by external forecasters, it is still expected to moderate from the strong pace over the past year towards estimates of potential growth.
Growth in other advanced economies has also been more resilient than expected, prompting upward revisions to near-term forecasts. AI-related investment and stronger underlying momentum have supported activity in the United States, while defence spending and broader resilience across services and investment have contributed to growth in the euro area. Activity in the United Kingdom has also held up better than expected, supported by business investment. These tailwinds across advanced economies have so far offset some of the drag to activity from higher energy costs. However, external forecasters and central banks expect persistently elevated energy costs to reduce household purchasing power, raise firms’ costs and increasingly weigh on consumption and investment. In some advanced economies, tighter financial conditions will also weigh on growth.
The outlook for GDP growth in China is broadly unchanged from the August Statement, though there have been some changes to the expected timing and composition of growth. GDP growth is forecast to be 4.6 per cent in 2026, before easing slightly to 4.5 per cent in 2027 and 4.4 per cent in 2028. The pick-up in growth in the September quarter is expected to continue in the near term, given the announcement of new policy support for infrastructure investment and signals from authorities that supporting economic activity will be elevated as a near-term policy priority. Infrastructure investment is now expected to recover from late 2026 as this support takes effect, while structural headwinds are expected to continue weighing on domestic demand more broadly. The timing and effectiveness of the policy support remain uncertain, particularly given high local government debt and a range of barriers to some local governments commencing infrastructure projects.
Longer-term government bond yields have risen across advanced economies, alongside resilient activity and persistent inflation. The increase appears to reflect a combination of higher expected near-term policy rates and higher longer-term real rates, reflecting a mix of higher term premia and potentially higher neutral rates. Market-based measures of long-term inflation expectations remain consistent with central bank targets. Strong investment and public demand may be placing upward pressure on real rates, and expectations of stronger future productivity growth – including from the adoption of AI – may also be contributing. Higher public and private debt issuance and uncertainty about inflation and fiscal trajectories may also be adding to the compensation investors require to hold longer-duration bonds (see Box A: How Does an Increase in Longer-term Real Yields Affect Financial Conditions? and Box B: Developments in the Neutral Rate of Interest).
The global inflation outlook has been revised higher, reflecting an increase in energy prices and continued resilience in global demand. Consensus forecasters expect headline inflation to remain above central bank targets into 2027 in many advanced economies. Services disinflation has stalled, while core goods inflation has picked up. The outlook for globally traded goods inflation has been revised higher, reflecting higher commodity prices and further strong increases in export prices for semiconductors and other AI-related goods across parts of Asia. AI-related price pressures have not broadened materially beyond electronics but could become more persistent or spread to other parts of global supply chains if strong demand continues to run ahead of the expansion in productive capacity (see Key risk #2). The further increase in energy prices since August could add to these upstream cost pressures, although the extent and timing of pass-through to consumer prices remains uncertain. Overall, we continue to judge that the risks to global inflation remain skewed to the upside.
3.3 Domestic outlook
Australian GDP growth is expected to remain below our estimate of potential growth throughout the forecast period.
GDP growth has slowed since the end of 2025 and is expected to remain subdued over the next couple of years (Graph 3.3). The expected slowing in growth over 2026 reflects the effects of several headwinds weighing on private activity, including the reduction in household disposable incomes from higher inflation, weaker conditions in the established housing market, and the tightening in monetary policy, which more than offset very strong data centre-related investment. Growth is expected to remain below potential over the forecast period, reflecting an assumption that financial conditions remain restrictive (see Key judgement #2). Consistent with the latest state and federal budgets, public demand is expected to continue supporting growth over the forecast period.
The risks to activity appear to be broadly balanced. Stronger-than-expected global growth and further strength in AI and data centre-related activity pose upside risks to domestic growth (see Key risk #2). However, historically low consumer and business sentiment could be pointing to the risk that the combined effect on domestic activity of the Middle East conflict, the decline in housing prices and the tightening in monetary policy could be more than assumed (see Key risk #3).
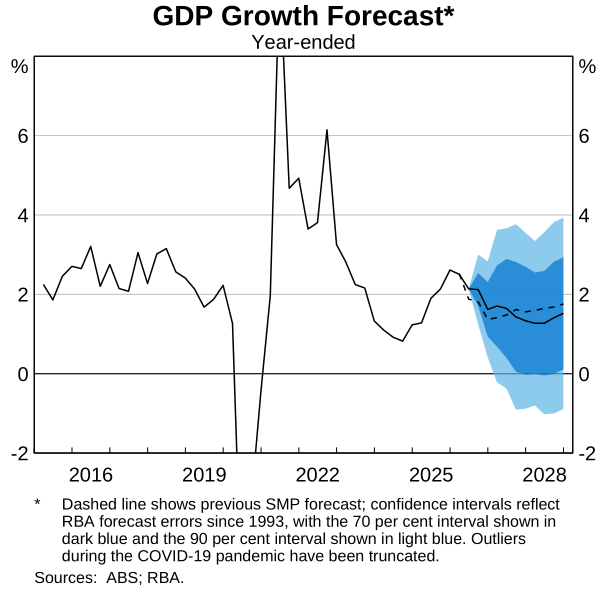
The level of GDP at end-2028 is expected to be broadly unchanged from the August forecasts. Growth is projected to be slightly stronger than expected in the near term, reflecting a much stronger outlook for data centre-related investment compared with the August Statement. Weighing against that is the higher assumed market path for the cash rate, a weaker outlook for the housing market and higher oil prices. These pull growth in the latter part of the forecast period a little below that expected in the August Statement.
Business investment is expected to increase strongly and the outlook has been revised up significantly, largely driven by data centre-related investment. Business investment was stronger than expected in the June quarter and firms’ surveyed expectations of future investment were again revised higher. External projections for the expected increase in Australia’s data centre capacity through to 2030 have also continued to be revised up as the size of the development pipeline has increased. Our forecast for data centre investment is in line with recent baseline external projections, but below projections that assume Australia becomes a significant regional hub for data centres. There is considerable uncertainty around the extent of data centre investment over coming years. This will depend on a range of factors such as government policy, community expectations, future demand for AI services and grid capacity. We continue to expect that much of this additional investment will be imported (around 70 per cent), limiting the boost to GDP growth. However, data centre construction, as well as any potential spillovers to higher investment in energy and utilities infrastructure, will require domestically sourced labour and materials. At this stage, most of this investment pipeline is in New South Wales and Victoria where liaison information suggests capacity constraints in the construction sector are somewhat less binding.
At the same time, a higher assumed cash rate path, a more significant easing in the established housing market and higher global oil prices are expected to weigh more on activity than in the August forecasts. The forecasts are conditioned on a higher market path for interest rates relative to August. In addition, established housing prices have continued to fall more quickly than expected, with external forecasters now expecting a deeper downturn than assumed a few months ago. The outlook for oil prices is also much higher than assumed in August, which will weigh on real household incomes. Reflecting these factors, the outlook for household consumption and dwelling investment has been revised lower, as has the outlook for business investment unrelated to data centres.
The labour market is expected to continue easing over the forecast period, consistent with below-potential GDP growth.
The unemployment rate is forecast to increase to 5.1 per cent by the end of 2028, which is around ¼ percentage point higher than previously expected (Graph 3.4). The unemployment rate has risen by more than expected over recent months, and the upward revision to forecast relative to the August Statement largely reflects this higher starting point. Elevated cost-of-living pressures appear to have encouraged workers to enter or remain in the labour force to a greater extent in recent months than was expected at the time of the August Statement. These pressures are expected to continue to support participation for some time. The participation rate is expected to decline very modestly by the end of 2028 as easing cyclical pressures are expected to more than offset the longer-run upward trend in female participation. A slightly weaker outlook for demand later in the forecast period is also contributing a little to the upward revision to the unemployment rate profile by late 2028.
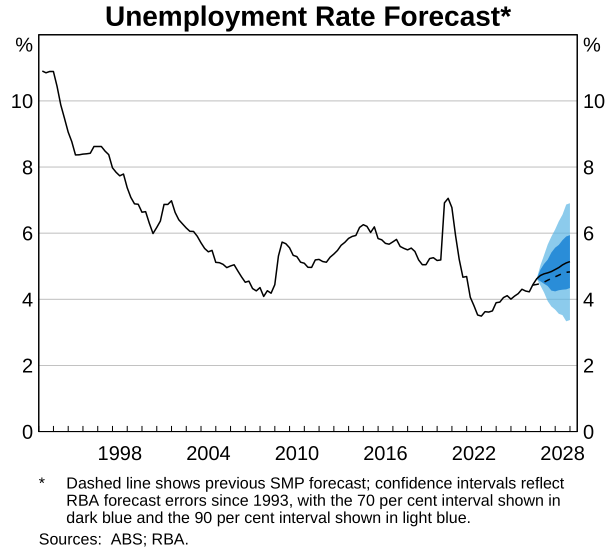
As in previous forecasts, the employment-to-population ratio is expected to decline through to late 2028. Employment growth is expected to remain broadly stable over the next year, in line with the leading indicators of labour demand. From mid-2027, employment growth is expected to be a little weaker than in the August Statement, reflecting the weaker outlook for GDP growth later in the forecast period. The forecast employment-to-population ratio is similar to the August Statement in the near term, before declining more quickly to reach a lower level by the end of the forecast period.
The economy is expected to move into balance in 2027, with spare capacity then emerging in the economy over the rest of the forecast period.
Below-potential output growth and an easing in labour market conditions are expected to see the economy move from a position of excess demand to around balance in 2027, before some spare capacity emerges. The timing of the return to balance is slightly later than in the August Statement, as a result of the upgrade to near-term GDP growth.
However, there is considerable uncertainty around the assessment of when the economy will return to balance and the extent of spare capacity that emerges. The impact of conflict-related costs on inflation over the period ahead will also make it more difficult to assess the degree of underlying capacity pressures in the domestic economy. Our assumption for potential output growth over the next couple of years assumes productivity growth will pick up gradually (see Key risk #4). However, with the level of labour productivity remaining around the same rate as prior to the pandemic – implying near-zero productivity growth on average over that period – continued weak productivity outcomes may be constraining the ability of firms to grow their supply capacity without generating inflationary pressure.
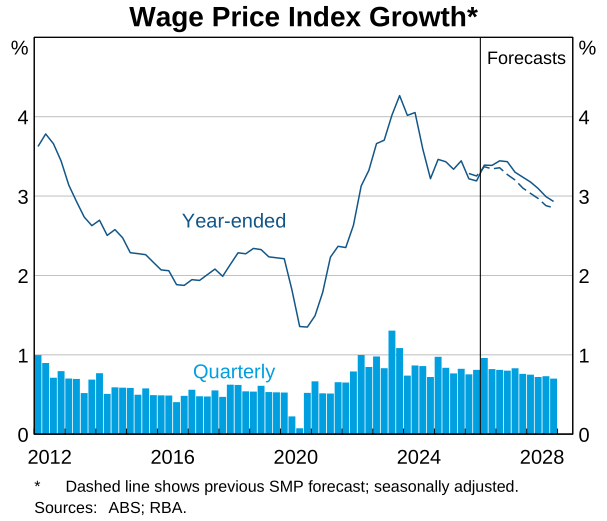
Wages growth is expected to pick up a little in the near term, then moderate gradually from 2027 as labour market conditions ease.
The forecast for year-ended wages growth has been revised a little higher across the forecast period. In the near term, nominal wages growth is expected to be supported by the effect of higher-than-expected capacity pressures in the first half of the year as well as the Fair Work Commission’s award wage decision (which had already been incorporated in the August forecasts). The influence of both higher-than-expected inflation outcomes and inflation expectations on wage negotiations is expected to add further upward pressure on wages growth relative to the August forecast. Some large wage increases in enterprise bargaining agreements are expected to support wages growth in the near term, although the timing of pay increases for these agreements may contribute to volatility in quarterly outcomes, particularly for the public sector.
Wages growth expectations from firms in the RBA’s liaison program are elevated and suggest little easing over the year ahead (see Box C: Insights from Liaison). This is consistent with the central forecast for wages growth. Growth is expected to moderate from mid-2027 onwards, reflecting easing labour market conditions and lower inflation outcomes. Wages growth is expected to have eased to 2.9 per cent in year-ended terms by end-2028 (Graph 3.5).
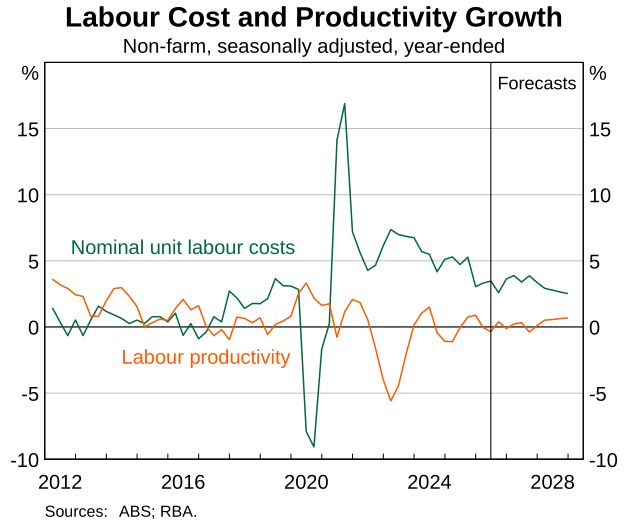
Unit labour cost growth is forecast to be elevated in the near term, before easing over the second half of the forecast period.
Year-ended growth in unit labour costs (ULCs) is expected to increase in coming quarters, reflecting weak productivity growth and higher wages growth. Year-ended growth in ULCs is then expected to moderate from late 2027 onwards, alongside slowing nominal wages growth and the pick-up in productivity growth to its assumed medium-term trend growth rate of 0.7 per cent per year (Graph 3.6). Nominal ULCs are the measure of labour costs most relevant for firms’ cost of production and so for inflation outcomes. Year-ended ULCs growth is expected to remain above 2.5 per cent – the rate that is consistent with inflation being sustainably at target – until late in the forecast period.
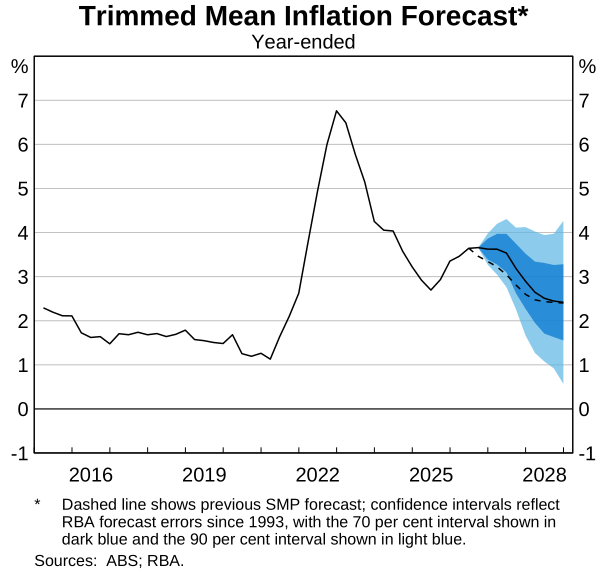
The forecast for underlying inflation has been revised higher over the next year, mainly owing to higher conflict-related cost pressures and higher-than-expected domestic capacity pressures.
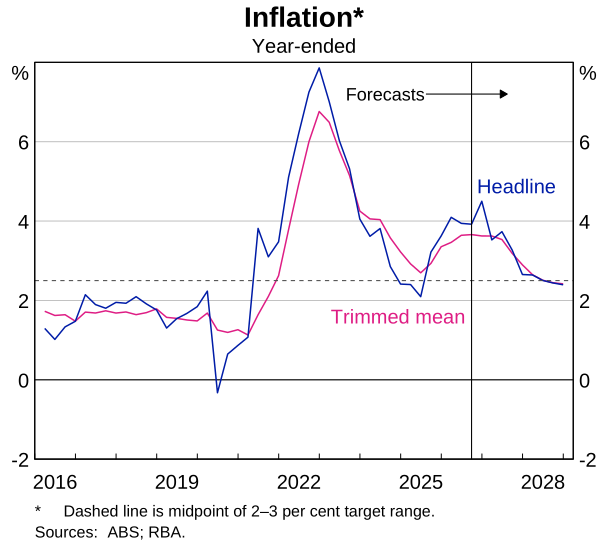
Trimmed mean inflation is expected to remain above 3 per cent until the end of 2027, easing gradually to reach 2½ per cent around mid-2028 (Graph 3.7). Year-ended underlying inflation is expected to remain elevated at a little above 3½ per cent until mid-2027, reflecting existing capacity pressures in the economy and the pass-through of higher conflict-related costs to consumer prices. Elevated inflation expectations are also contributing to underlying inflation over the coming year or so. From mid-2027 onwards, inflation is expected to ease due to the emergence of spare capacity in the economy and labour market and as conflict-related cost effects begin to unwind.
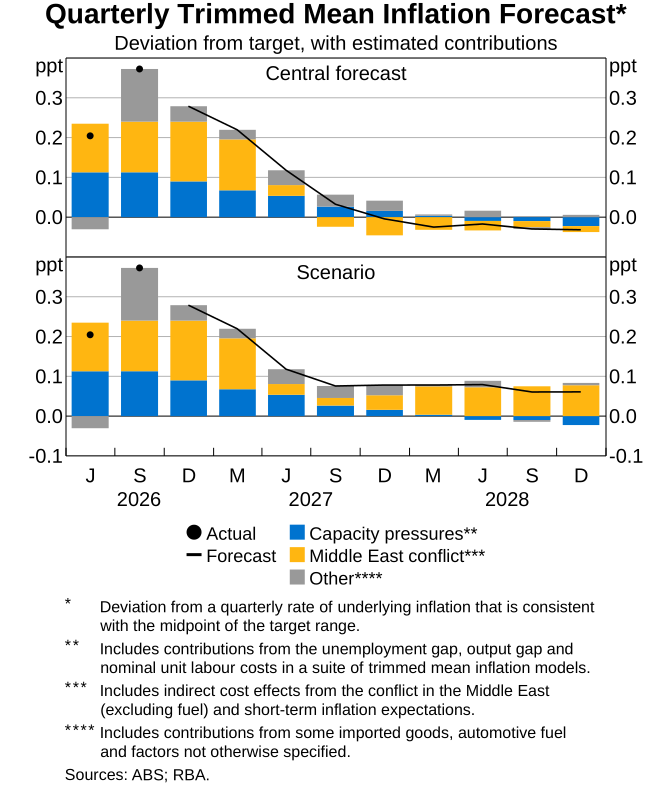
Cost pressures related to the Middle East conflict are expected to place more upward pressure on underlying inflation over the year ahead than previously assumed. A possible re-escalation in the conflict had been flagged as an upside risk to inflation in the August Statement. Since then, oil and fuel prices have increased by much more than had been assumed and are now assumed to remain at a higher level over the forecast period. We expect higher global energy prices will contribute to higher domestic inflationary pressures in late 2026 and early 2027, even as domestic activity slows and the labour market eases (Graph 3.8). The judgement around the degree of pass-through from global energy prices to domestic prices is broadly similar to what had been assumed in August. It is consistent with information from liaison and the Business Outlook Scenario Survey (BOSS) in September, where firms reported plans to continue raising prices in response to past cost increases arising partially from the conflict. From mid-2027 onwards, we expect cost effects to unwind in net terms, albeit to a lesser extent than assumed in the August Statement as oil prices are now assumed to remain at a higher level than previously expected and refined margins are assumed to remain elevated for longer (see Key judgement #1). The balance of risks to conflict-related inflationary pressures remains skewed to the upside, particularly as crude oil and refined fuel prices could remain elevated or rise further (see Key risk #1).
Relative to the August forecasts, domestic capacity pressures are also expected to exert a bit more upward pressure on inflation over the year ahead. We now judge that stronger-than-expected domestic capacity pressures explain more of the recent unexpected strength in underlying inflation (see Chapter 2: Economic Conditions). Those higher capacity pressures are also expected to contribute a little more to inflation over the year ahead. This upward pressure is expected to ease gradually over the forecast period, as spare capacity emerges in the economy and the labour market.
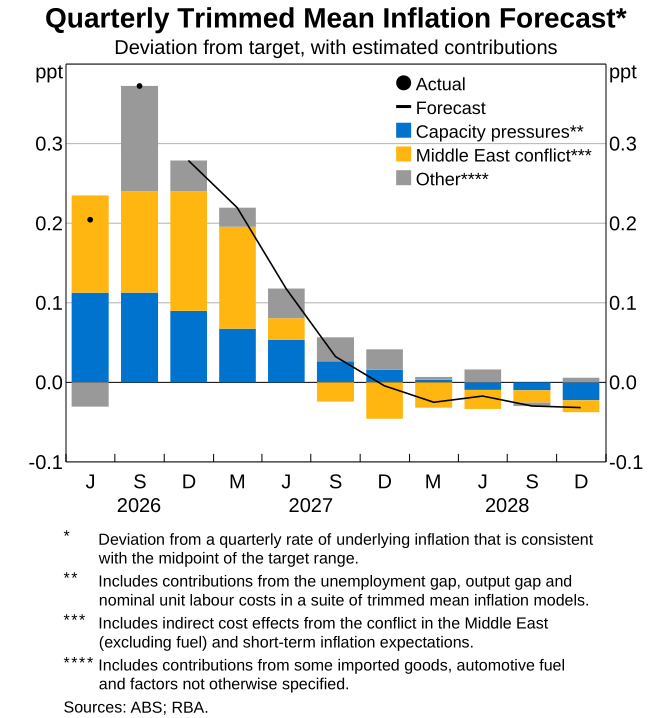
Elevated inflation expectations are expected to contribute to inflationary pressure over the forecast period, supporting the pass-through of firms’ costs to consumer prices. Several measures of short- and medium-term inflation expectations have increased alongside the recent increases in fuel prices, and some measures of longer-term expectations have also drifted higher (see Chapter 2: Economic Conditions). We judge that elevated expectations will contribute to higher realised inflation by supporting expected cost growth, making firms more willing to pass these higher costs through to prices, and placing upward pressure on wages growth. If the conflict in the Middle East is more protracted than assumed in our baseline forecasts, there is a risk that inflation expectations may increase further (see Key risk #1).
Headline inflation has been revised higher in the near term due to stronger growth in fuel prices and higher underlying inflation.
Headline inflation is expected to remain above 3 per cent until late 2027, which is around three quarters longer than in the August forecast, and reach the midpoint of the 2–3 per cent inflation target range a bit later than expected in August (Graph 3.9). Headline inflation is expected to peak at 4.5 per cent in the December quarter this year due to higher-than-expected fuel prices. The assumed decline in global oil prices is expected to put downward pressure on headline inflation from early 2027. Over the remainder of the forecast period, headline inflation has been revised higher relative to our August forecasts, reflecting higher underlying inflation (Graph 3.10). Headline inflation is expected to reach the midpoint of the target in mid-2028 as capacity pressures and conflict-related costs ease.
3.4 Key risks to the outlook
The staff assess that the risks to the domestic inflation outlook are skewed to the upside, despite becoming more balanced since the August Statement as some of the risks identified then have been incorporated into the central forecast. In August, we identified three main sources of upside risk to the global and domestic inflation outlook: a re-escalation of the Middle East conflict; domestic capacity pressures being greater than assumed; and the global AI boom generating more of an inflationary impetus than assumed. Since then, the risk of a re-escalation of the Middle East conflict has crystallised and staff have re-evaluated the extent of domestic capacity constraints; both of which have led to upward revisions to the central inflation forecast over the next year. However, there is still uncertainty around the outlook for global energy prices, the role of inflation expectations in price and wage dynamics as well as the impact on inflation from AI activity.
The staff also identified in August that there were upside risks to global and domestic economic activity from AI-related demand, but that domestic economic activity could be weaker if the Middle East conflict and the decline in housing prices affected the economy by more than assumed in the central forecast. These remain key risks to the outlook.
Key risk #1 – High inflation could be more persistent if energy prices remain elevated, or if inflation expectations increase or start to have a greater bearing on wage- and price-setting.
We have modelled a scenario where crude oil remains around US$100 per barrel and refined product prices remain at elevated levels over the forecast period. Many external forecasters are revising higher their outlook for crude oil and refined product prices, on concerns that some of the key margins of adjustment in global energy markets that have helped to cushion the impact of the disruption to oil supply and global activity are reaching their limits (see Chapter 2: Economic Conditions and Key judgement #1).
Persistently higher global oil prices would leave domestic inflation higher for a longer period than in the central forecast. Higher oil prices would directly increase fuel prices and firms’ input costs, with the latter gradually passed through to consumer prices as firms adjust to persistently higher costs. By contrast, the central forecast assumes a decline in oil prices, which starts to ease cost pressures related to the Middle East conflict from mid-2027, contributing to lower inflation over time (Graph 3.11). Higher inflation also raises inflation expectations in the scenario, reinforcing inflationary pressures over the forecast period. Assuming that the cash rate and exchange rate follow the same path that underpins the central forecasts, underlying inflation would be around 2¾ per cent by end-2028 rather than being around the 2½ per cent.
It is possible that inflation expectations could rise even further or that inflation expectations provide greater impetus to wages growth and inflation through second-round effects. The central forecasts and scenario assume that the increase in households’ and firms’ inflation expectations do exert some upward pressure on inflation and wages growth. However, given households and firms are paying particularly close attention to inflation, it is possible that inflation expectations will influence price- and wage-setting decisions by more than assumed. This heightened attentiveness to inflation could also make expectations more persistent and more responsive to realised inflation. With headline inflation forecast to rise further in the near term, this increases the risk that inflation expectations remain higher for longer than assumed in our central forecast.
Key risk #2 – The global AI demand boom may continue to drive up global growth and inflation.
MTP growth may not moderate as expected over the next few years if AI-demand growth continues at the same pace. It is possible that growth forecasts could continue to be upwardly revised by Consensus forecasters if the current upswing in AI-related investment (and spillovers associated with the boom) is more persistent than currently assumed. The rise in interest rates across the yield curve in many advanced economies may reflect higher neutral rates – that is, expectations that demand will prove more resilient and inflation more persistent than currently assumed. Higher longer-term real rates may partly reflect expectations of stronger future productivity growth, including from the adoption of AI. Further investment in anticipation of higher productivity could also support demand and add to capacity pressures over the next few years, while most of the productivity gains are likely to manifest beyond the next two years (at least in Australia).
The ramp-up of investment in data centres may also contribute to capacity and pricing pressures domestically, particularly by drawing on resources in the construction industry. These price pressures could be stronger than currently expected as the forecast pipeline of investment is worked through, or if investment proves stronger than expected.
Key risk #3 – Domestic economic activity could be weaker than expected.
It is possible that the headwinds affecting households and businesses over the next year could have a larger adverse effect than assumed. The central forecasts assume that higher oil prices, higher interest rates and lower housing prices all weigh on domestic economic activity broadly in line with average historical relationships. Timely indicators of spending remain consistent with this assumption, with no evidence of a material slowing in consumption growth in recent months. However, the very weak levels of consumer and business sentiment could be pointing to a more pronounced slowing in household and business spending growth than assumed.
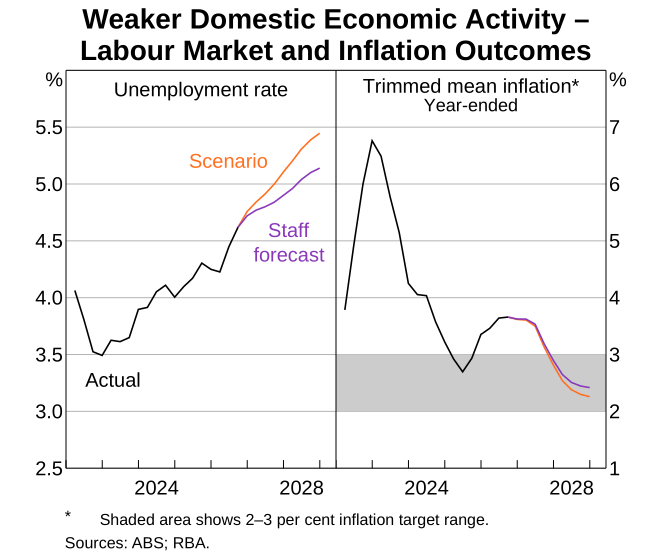
We have calibrated a downside domestic activity scenario where there is a larger response in household and business spending to these headwinds. There is a range of estimates for the effects of these headwinds in the literature, highlighting the uncertainty around their impact on economic activity. Drawing on this evidence, the scenario uses larger responses than assumed in the central forecast, thereby identifying a plausible downside outlook for domestic activity. In the scenario, firms feel forced to pass on the conflict-related costs to prices as in the central forecast; but households respond more cautiously to the resultant pressures on real income and wealth, reducing discretionary consumption by more than assumed in the central forecast. Such an effect on spending might be compounded by a tightening in borrowing constraints and incentives for housing investors. The scenario assumes firms respond to weaker demand and margin pressure with a sharper pullback on (non-data centre) investment and hiring. Overall, the level of GDP is around 1.0 per cent lower than the central forecasts by end-2028.
The larger pullback in household and business spending results in weaker activity and employment growth, but only modestly lower inflation than in the central forecast, assuming interest rates and the exchange rate follow the same path as the central forecast. The greater caution exhibited by households pushes the gross household saving ratio up gradually to a peak of around 17 per cent, where it remains over the remainder of the forecast period. The greater reduction in hiring pushes the unemployment rate 0.3 percentage points higher by end-2028, creating more spare capacity in the domestic economy than in the central forecast (Graph 3.12). The additional spare capacity in the economy and the labour market reduces inflationary pressures somewhat, but the assumption of cost pass-through by firms limits this effect. Overall, trimmed mean inflation reaches 2½ per cent only one quarter earlier than in the central forecast.
Key risk #4 – There remains considerable uncertainty about the degree of capacity pressures in the domestic economy and labour market.
Despite the recent reassessment, it is possible that we are still understating the extent of capacity pressures. While we assess that capacity constraints in the economy and labour market have been tighter than previously judged, model-based estimates of the unemployment rate that is consistent with low and stable inflation continue to point to greater tightness in labour market conditions than our central assessment. In addition, if productivity growth were to remain subdued over the forecast period, rather than pick up modestly as assumed, it may suggest that the economy’s supply capacity would be lower than currently expected. The implications for inflation would depend on how households and businesses adjust their spending and expectations.
Conversely, capacity pressures may be weaker than expected. The broader suite of full employment indicators points to somewhat less labour market tightness than our central assessment. It is also possible that more of the recent strength in wages growth and inflation reflects factors other than excess demand, such as conflict-related cost effects or higher inflation expectations. In these cases, wages growth and inflation may moderate more quickly than in the central forecast. Productivity growth could also recover more quickly than assumed, including if the anticipated benefits of AI adoption and other technological developments are realised sooner.
There is also a risk that the unemployment rate increases by more than expected if labour supply remains stronger than assumed. There is a risk that elevated cost-of-living pressures could support labour force participation for longer, or to a greater extent, than assumed. If so, stronger labour supply could result in a higher unemployment rate than forecast, even if labour demand evolves broadly as expected.
3.5 Detailed forecast information
Table 3.1 provides additional detail on forecasts of key macroeconomic variables. The forecast table from current and previous Statements can be viewed, and data from these tables downloaded, via the Statement on Monetary Policy – Forecast Archive.
| Jun 2026 | Dec 2026 | Jun 2027 | Dec 2027 | Jun 2028 | Dec 2028 | |
|---|---|---|---|---|---|---|
| Activity | ||||||
| Gross domestic product | 2.1 | 1.6 | 1.6 | 1.3 | 1.3 | 1.5 |
| Household consumption | 1.8 | 1.4 | 1.4 | 1.8 | 1.7 | 1.6 |
| Dwelling investment | 5.8 | 5.1 | 1.3 | −2.8 | −3.5 | −1.8 |
| Business investment | 10.5 | 12.0 | 7.8 | 2.2 | 0.2 | −0.3 |
| Public demand | 2.1 | 2.1 | 3.8 | 3.0 | 2.7 | 2.3 |
| Gross national expenditure | 2.9 | 2.6 | 2.7 | 2.0 | 1.6 | 1.6 |
| Major trading partner (export-weighted) GDP | 4.1 | 3.8 | 3.5 | 3.6 | 3.4 | 3.3 |
| Trade | ||||||
| Imports | 6.7 | 4.6 | 4.0 | 3.7 | 2.7 | 2.0 |
| Exports | 2.9 | −0.3 | 0.3 | 0.9 | 1.3 | 1.8 |
| Terms of trade | −0.5 | −2.4 | −4.9 | −2.4 | 0.9 | 0.9 |
| Labour market | ||||||
| Employment | 1.1 | 1.4 | 1.2 | 1.1 | 1.0 | 1.1 |
| Unemployment rate (quarterly, %) | 4.4 | 4.7 | 4.8 | 4.9 | 5.0 | 5.1 |
| Hours-based underutilisation rate (quarterly, %) | 5.5 | 5.8 | 5.9 | 6.0 | 6.2 | 6.4 |
| Income | ||||||
| Wage Price Index | 3.2 | 3.4 | 3.4 | 3.2 | 3.1 | 2.9 |
| Nominal average earnings per hour (non-farm) | 3.2 | 3.5 | 3.7 | 3.5 | 3.4 | 3.2 |
| Real household disposable income | 2.3 | 1.0 | 1.6 | 1.5 | 1.3 | 1.3 |
| Inflation | ||||||
| Consumer Price Index | 3.9 | 4.5 | 3.7 | 2.7 | 2.5 | 2.4 |
| Trimmed mean inflation | 3.6 | 3.6 | 3.5 | 2.9 | 2.5 | 2.4 |
| Assumptions | ||||||
| Cash rate (%)(c) | 4.3 | 4.7 | 4.9 | 4.8 | 4.8 | 4.8 |
| Trade-weighted index (index)(d) | 66.1 | 65.2 | 65.3 | 65.3 | 65.3 | 65.3 |
| Brent crude oil price (US$/bbl)(e) | 94.9 | 109.5 | 95.3 | 86.9 | 82.1 | 79.1 |
| Estimated resident population(f) | 1.5 | 1.5 | 1.3 | 1.2 | 1.2 | 1.2 |
| Memo items | ||||||
| Labour productivity(g) | −0.4 | −0.1 | 0.3 | 0.1 | 0.6 | 0.7 |
| Household savings rate (%)(h) | 6.5 | 6.6 | 6.7 | 6.3 | 6.3 | 6.0 |
| Real Wage Price Index(i) | −0.8 | −1.0 | −0.3 | 0.6 | 0.6 | 0.5 |
| Real average earnings per hour (non-farm)(i) | −0.8 | −0.9 | 0.0 | 0.8 | 0.8 | 0.8 |
|
(a) Forecasts finalised on 28 October. Sources: ABS; Bloomberg; CEIC Data; Consensus Economics; LSEG; Oxford Economics Limited; RBA. |
||||||