
Financial Stability Review – October 20262. Resilience of Australian Households and Businesses
Summary
Household and business borrowers continue to display a high level of resilience overall, and loan arrears remain low, despite financial pressures picking up this year in response to higher inflation and interest rates. Lending competition among bank and non-bank lenders remains strong and it is important that lending standards remain prudent so that household and business resilience is not undermined.
- The strong financial positions of most Australian households and businesses have helped them weather the rise in cost pressures this year. Inflation has been elevated in 2026, reflecting domestic capacity pressures and higher input costs due to the Middle East conflict. As a result, the Monetary Policy Board has increased the cash rate by 100 basis points to help return inflation to target. While some households continue to experience hardship, the estimated share of mortgagors in severe financial stress or in arrears has, so far, remained low, supported by the strong labour market and mortgagors’ savings and equity buffers. Most businesses have also navigated the rise in cost pressures, having entered the year with generally strong balance sheets and contained debt levels. Bank loan arrears rates for businesses remain low. However, the share of companies entering insolvency is still elevated relative to longer-term averages in some sectors, such as hospitality and construction, where the operating environment remains challenging, particularly for smaller firms. Broader spillovers to the financial system from insolvencies have been contained due to these firms’ limited bank debt and small size. Fundamentals continue to improve across most commercial real estate (CRE) markets and there remains little evidence of financial stress among owners of Australian CRE, despite higher interest rates and uncertainty.
- Most borrowers appear well placed to manage ongoing cost pressures amid declining housing prices. While cash flow pressures are expected to persist, the outlook presented in the August Statement on Monetary Policy suggests that the share of mortgagors in severe financial stress – where mortgage payments and spending on essentials exceeds their income – will remain well below its 2024 peak. Recent tax changes affecting housing, as well as the higher level of the cash rate, have contributed to lower demand for housing credit in recent months and a decline in housing prices following a number of years of strong housing price growth. Most household borrowers are expected to remain resilient in this context, including under a range of adverse scenarios. Even in a scenario where housing prices were to decline by a further 20 per cent, most borrowers would still have positive equity buffers given the earlier run-up in housing prices and prudent lending standards. Most businesses are also expected to remain resilient to higher costs. However smaller businesses and those in more energy-intensive or cyclical industries with fewer cash buffers (such as transport, hospitality and construction) are more vulnerable to cost pressures, particularly if a further significant weakening in aggregate demand in the economy were to make it harder for them to raise prices to cover their higher costs.
- It is important that prudent lending standards are maintained to support continued resilience in the Australian financial system. While competition in housing lending remains strong, housing credit growth, particularly for investors, has eased, higher-risk lending continues to be contained and lending standards remain sound. Prudent lending standards are important to preserving the ability of borrowers and lenders to withstand shocks. For businesses, credit growth and lending competition remains strong across banks and non-banks. This has supported businesses’ access to credit, which has helped some firms manage a challenging period. There is little evidence that this lending poses a risk to financial stability, though data gaps remain in some segments of non-bank lending. The RBA, together with the other Council of Financial Regulators (CFR) agencies, will continue to closely monitor potential vulnerabilities in the household and business sectors that could emerge over time.
2.1 Households
Cost pressures have increased since the start of the year, particularly for lower-income households, but the financial position of most households remains strong.
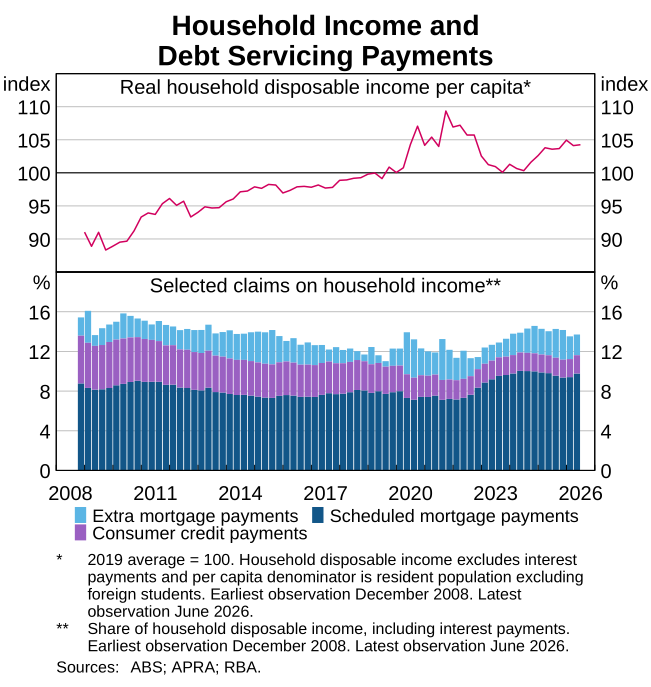
On a per capita basis, real household disposable income declined slightly over the first half of 2026, but remains higher on average than in 2023 and 2024 (Graph 2.1). The recent decline in real disposable income per capita – that is, income per person after tax and interest payments and adjusted for inflation – was mostly driven by higher inflation and increases in interest rates. These factors have different impacts on different types of households. All households’ budgets have been affected by high inflation eroding purchasing power. However, this is more likely to cause stress for lower-income households, many of whom are renters, because their expenses tend to make up a larger share of their disposable income.1 On top of inflationary pressures, mortgage holders are also directly affected by increases in the cash rate. Against this backdrop, enquiries to the National Debt Helpline increased modestly over the first half of 2026.
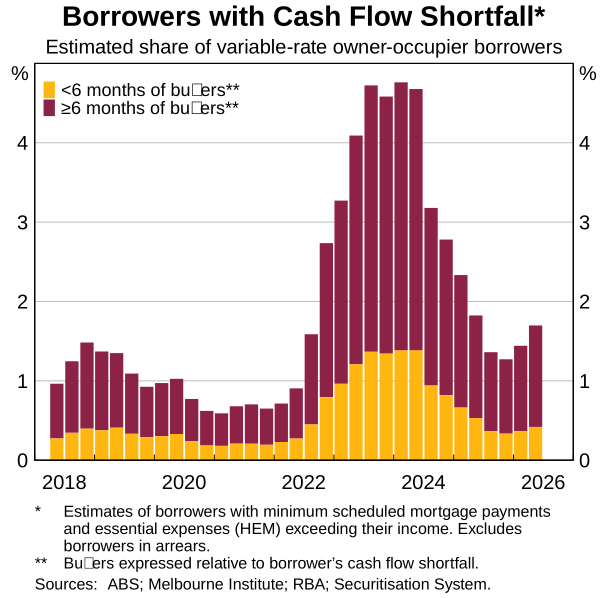
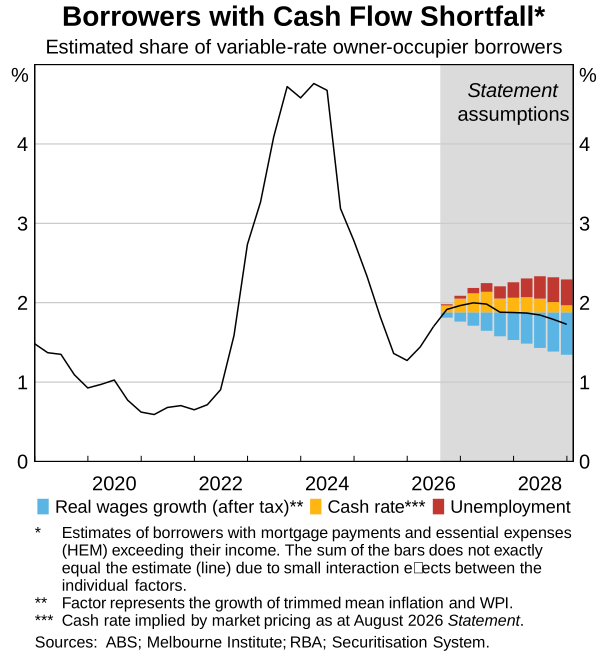
While financial pressures have increased for borrowers, most continue to have sufficient income to meet their scheduled mortgage repayments and essential expenses. The estimated share of variable-rate owner-occupier borrowers experiencing a cash flow shortfall – where income is not sufficient to cover scheduled mortgage repayments and essential expenses – increased a little over the first half of 2026, but remains relatively low at around 2 per cent (Graph 2.2). Lower-income borrowers are more likely to be in this group. In addition to cutting back their spending to mostly essential items and trading down in quality for some goods and services, these households have had to make other difficult adjustments to continue servicing their mortgages, such as selling assets and working additional hours. However, most borrowers in a cash flow shortfall are estimated to have savings that would enable them to cover their cash flow shortfall for at least six months, assuming they adjusted their consumption down to essential levels.2 Consistent with this, the share of loans in formal hardship arrangements increased but remains low.
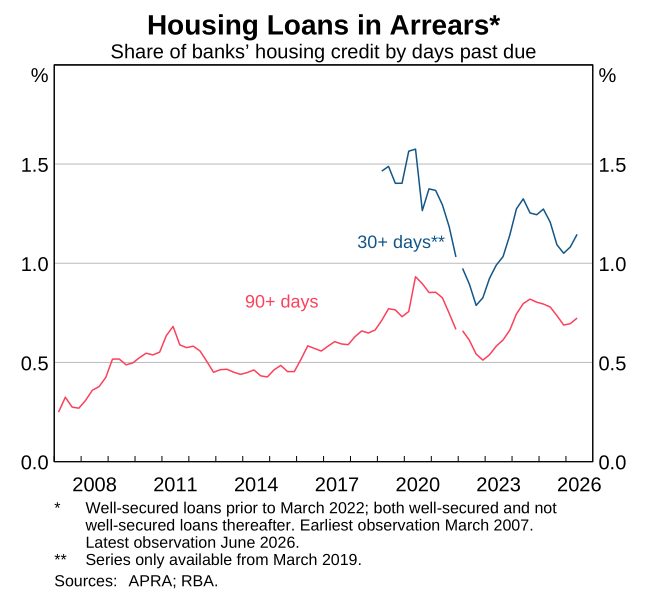
Arrears rates remain low despite a recent pick-up. The share of housing loans more than three months behind on their repayments has increased a little over the year to date but remains around pre-pandemic levels (Graph 2.3). Arrears rates for borrowers with lower incomes, high loan-to-value ratios (LVRs) or high loan-to-income (LTI) ratios – who tend to be more vulnerable to financial stress – remain higher than for other borrowers but have not picked up significantly since the start of the year. These cohorts represent a very small share of overall borrowers. Arrears rates for first home buyers also remain low. Information from liaison with banks suggests hardship or arrears for participants in the Australian Government 5% Deposit Scheme remain contained. This scheme allows first home buyers to take out high LVR loans through a government guarantee, without having to pay lenders mortgage insurance.3 Ongoing strength in the labour market has supported households’ ability to service their debts.
While risks to the economic outlook have risen, most indebted households appear well placed to weather a wide range of adverse outcomes.
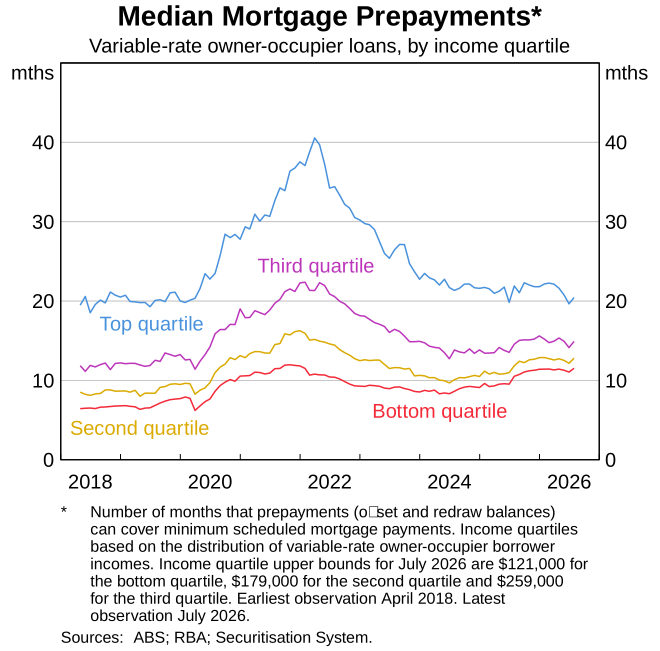
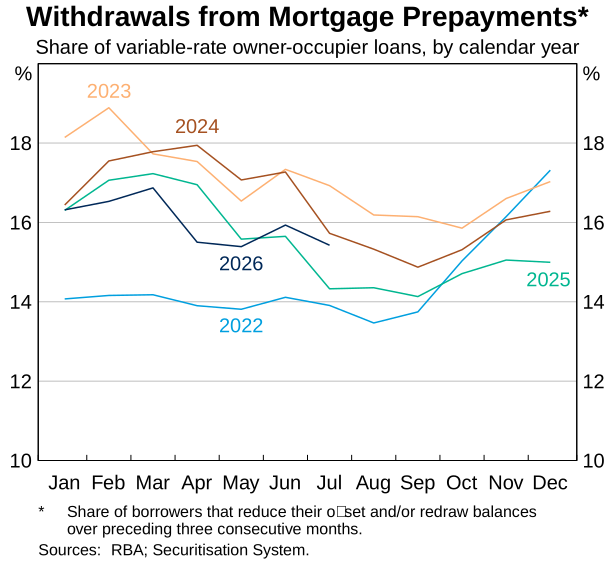
Borrowers’ large liquidity buffers can help them withstand shocks to their incomes or expenses. Most mortgagors hold large savings buffers in offset and redraw accounts, with the median borrower able to cover over a year of scheduled mortgage payments at current interest rates from these buffers, a stronger position than before the pandemic (Graph 2.4). To date, there has not been a meaningful increase in the share of borrowers who are persistently drawing down on these buffers to manage cash flows (Graph 2.5).
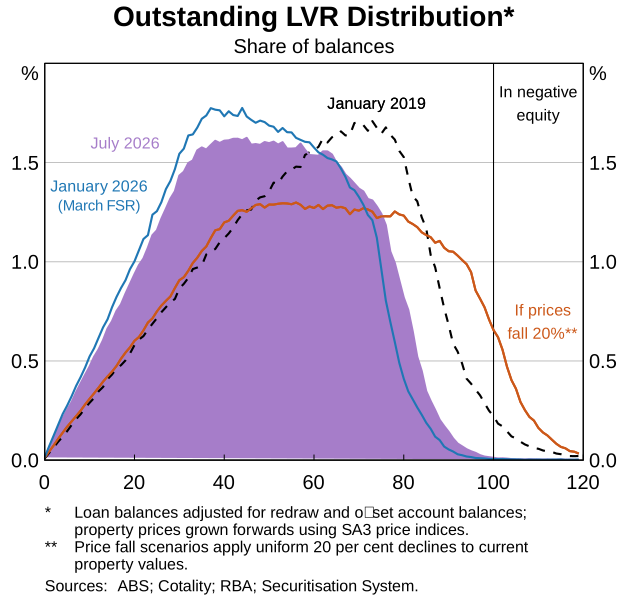
Despite recent declines in housing prices, most borrowers still have large housing equity buffers. This reflects the strong growth in housing prices that had occurred over several years, alongside continued prudent lending standards. Housing prices have declined in recent months as housing market sentiment has weakened, reflecting the somewhat restrictive stance of monetary policy and changes to negative gearing and capital gains tax discount policies. Despite this, most household balance sheets remain strong, with less than 1 per cent of borrowers estimated to owe more on their loan than the value of their property (negative equity).4 Recent buyers and those who took out higher LVR loans are more likely to be in negative equity. This includes first home buyers participating in the Australian Government 5% Deposit Scheme. However, the potential risks to financial stability from these borrowers are mitigated by the structure of the scheme and the typical low-risk characteristics of most first home buyers.5 While downside risks to housing prices remain, the RBA’s Securitisation System data suggest that even in a scenario involving a large uniform fall in housing prices of 20 per cent from current levels, only around 5 per cent of mortgages would fall into negative equity (Graph 2.6).6, 7 Negative equity is insufficient to trigger default if borrowers remain able to service their loans, which remains the case for the vast majority of these households. Borrowers also tend to continue servicing their loan if they can, reflecting in part the full recourse nature of most Australian mortgages. However, if a borrower becomes unable to service their loan and had to make the difficult and disruptive decision to sell their home, the vast majority would have enough equity to repay their loans in full.8
Cash flow pressures on mortgagors are expected to persist, but the share of borrowers with a cash flow shortfall is expected to remain well below the peak in 2024. Based on the economic outlook presented in the August Statement, the estimated share of variable-rate owner-occupier borrowers experiencing a cash flow shortfall is projected to remain around its current level of a little under 2 per cent for some time (Graph 2.7). Even though interest rates are above their previous peak during 2023–2024, instances of stress are expected to peak at a lower level. This is because some of the households estimated to have been in cash flow deficit in 2023–2024 are expected to have experienced significant income growth since then. In addition, borrowers that have taken out loans in recent years have faced loan servicing capacity requirements greater than those faced by pandemic-period borrowers and well above current interest rates. This reflects both the increase in actual interest rates and the increase in the serviceability buffer required by the Australian Prudential Regulation Authority (APRA) from 2.5 to 3 percentage points in late 2021.
Overall, most household borrowers are expected to remain resilient under a range of adverse scenarios. The RBA uses scenario analysis to inform our assessment of how negative shocks could affect the financial position of Australian households (see 4.2 Focus Topic: Informing Our Financial Stability Assessment Using Scenarios). In a very adverse downturn – for example, a shock that may originate from overseas, where the unemployment rate increases to 6.3 per cent, inflation increases to 7 per cent, and the cash rate rises to 5.6 per cent – the share of mortgagors at a higher risk of defaulting on their loans is estimated to increase to around 5 per cent, only a little higher than the peak in 2023.9 In this scenario, around two-thirds of these borrowers are estimated to have insufficient income to cover their expenses but have enough buffers to service their debts and essential expenses for at least six months. Additionally, even if housing prices decline by a further 20 per cent, few households are in negative equity in this scenario. Being in positive equity gives borrowers the option to make a decision – though difficult and disruptive – to sell their property to fully pay off their loan if they experience acute financial stress, rather than falling behind on their payments.10
Although higher-risk lending to households is expected to slow in aggregate over the next year, the RBA and other CFR agencies continue to monitor housing-related vulnerabilities closely.
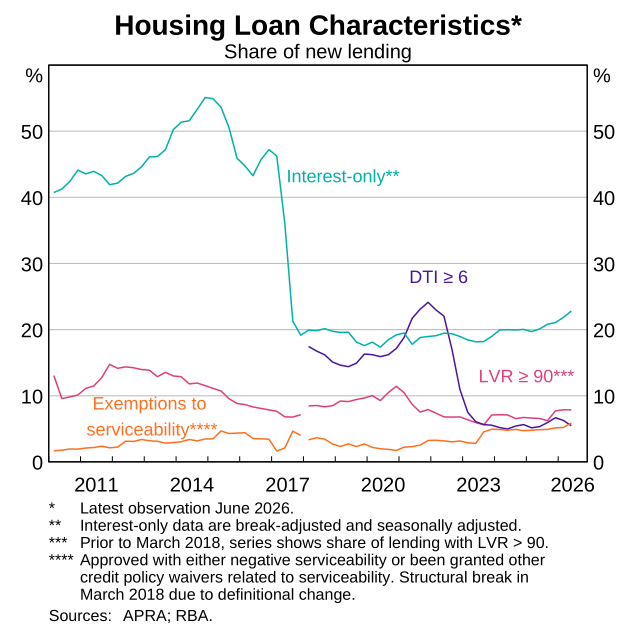
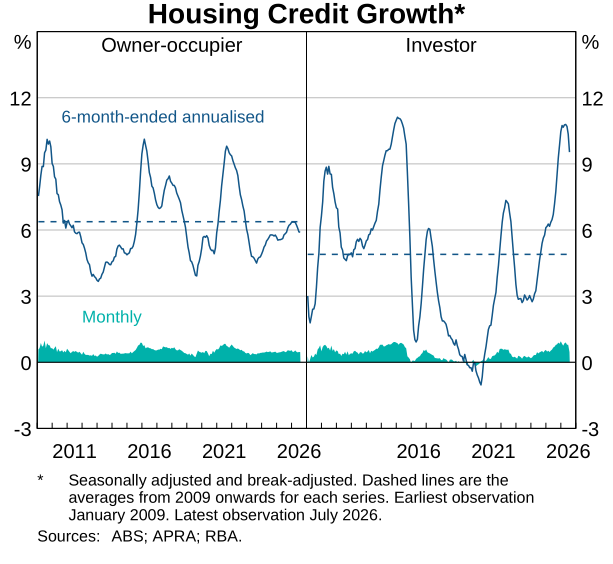
Lending standards have remained sound in recent years, and credit growth has started to moderate over recent months. Riskier forms of lending – such as high DTI and high LVR lending – are currently contained and expected to remain so as tighter financial conditions, elevated uncertainty and tax changes weigh on housing credit growth (Graph 2.8). The aggregate share of new high DTI lending remains well below APRA’s recently implemented limits of 20 per cent. The share of high LVR lending has increased since the expansion of the Australian Government 5% Deposit Scheme in October 2025 but remains low overall as first home buyers only account for a small share of overall housing credit. The share of new lending originated on interest-only terms has increased over the past year, though by itself this increase is not cause for concern.11 The share of new lending issued with exemptions to serviceability requirements increased only slightly over the first half of 2026.12
New lending to investors has moderated from elevated levels, though investors remain an important driver of housing market dynamics. Investor credit growth picked up strongly over 2025 but has slowed recently and is expected to moderate further in the period ahead in response to tax changes, tighter monetary policy settings and softer housing prices (Graph 2.9). Historically, investor activity has tended to have a greater influence on housing price dynamics than owner-occupier activity. In periods of declining housing prices, investors may be less willing to enter the market and more inclined to sell properties to limit losses.13 This can amplify price declines and contribute to a more pronounced downturn than would otherwise occur. That said, like other borrowers, most investors have considerable equity positions in their properties and have historically exhibited lower rates of arrears and default than owner-occupiers. Investor incomes also continue to be supported by growth in rents.
In the context of the current environment and outlook, the RBA supported APRA’s recent position to keep macroprudential policy settings unchanged, given their important role in guarding against a material build-up of vulnerabilities and supporting the ongoing resilience of the Australian financial system. While APRA’s DTI limits are unlikely to be binding at the system level or constrain credit over the period ahead given the outlook for interest rates, these limits still serve as an important guardrail to limit upswings in the credit cycle.14 APRA’s serviceability buffer, which requires lenders to assess a prospective borrower’s ability to service their mortgage at an interest rate 3 percentage points above their current loan rate, also plays an important role in ensuring that new borrowers across the system are well placed to withstand shocks to their incomes, expenses or repayments. In September, the RBA provided financial stability advice to the CFR in line with the approach set out in the CFR Charter and Memorandum of Understanding between APRA and the RBA.15 Against a backdrop of increasing competition among lenders, the CFR will continue to closely monitor financial stability implications arising from lending practices.
2.2 Businesses
Most businesses appear well placed to manage elevated cost pressures, having entered this year with strong balance sheets and a good degree of resilience.
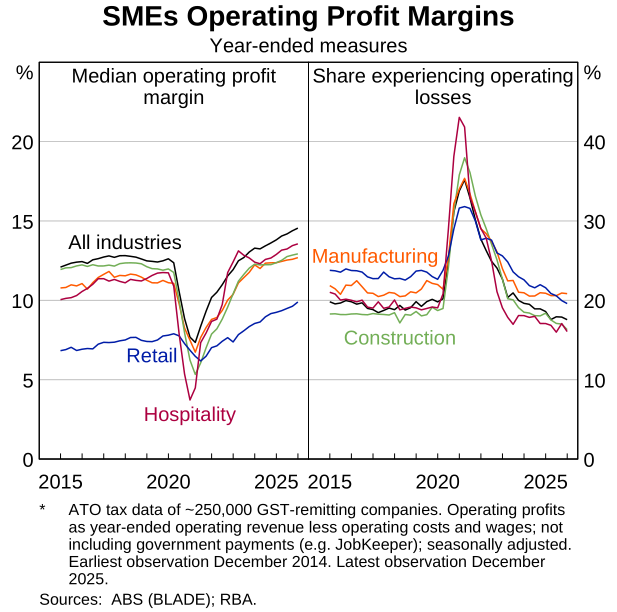
More small and medium sized firms’ (SMEs) operations were profitable in late 2025 than before the pandemic (Graph 2.10, left panel). While these data are only available up to December 2025 and predate the increases in the cash rate, the escalation of conflict in the Middle East and the associated increase in energy and other input prices in 2026, they suggest most firms had been able to slightly improve their operating margins over recent years, despite strong input cost growth. Consequently, the share of SMEs making operating losses had decreased (Graph 2.10, right panel). As operating margins exclude interest costs, this measure does not reflect the effect of changes in interest rates (see below).16
More recent surveys since the escalation of conflict in the Middle East indicate elevated cost pressures and prolonged uncertainty have weighed on some firms’ profitability. This is particularly the case in the retail, construction and discretionary services sectors. Information from the RBA’s liaison program suggests that while businesses are trying to pass on cost increases to their customers (which in some cases include other businesses), this is in some cases limited by consumer price sensitivity. It appears to have been easier for firms in the transportation and construction sectors to pass on cost increases, but more difficult for firms in sectors more reliant on discretionary spending and subject to strong competitive pressures. Some firms, including many smaller businesses, have also had to adjust their operations to reduce costs and support margins.
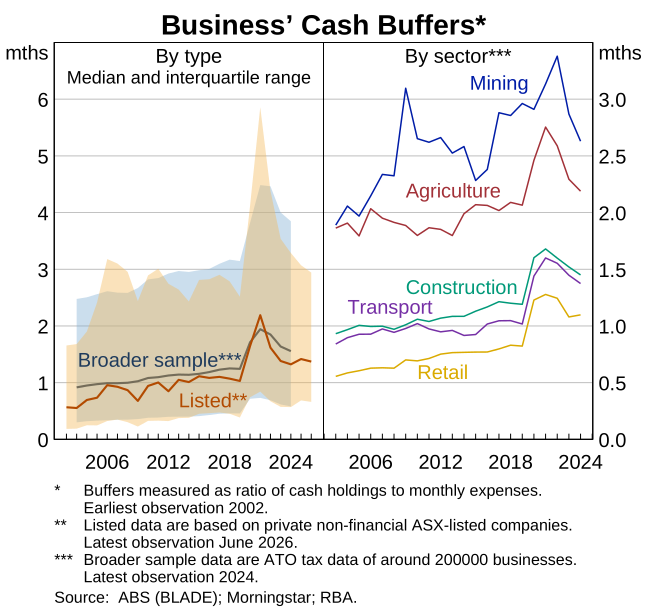
Above-average cash buffers can help firms manage cost pressures and an uncertain trading environment. Cash buffers as a share of expenses increased during the pandemic and, although they have since fallen, they appear to remain above their longer-run average levels for many businesses (Graph 2.11). While data for unlisted companies are lagged, data on businesses’ deposit account balances and information from liaison both suggest that SMEs have not meaningfully drawn down their buffers in recent years. Cash buffers help support resilience, especially for smaller firms that may experience greater difficulty in obtaining short term liquidity, as well as for firms with less flexible cost bases such as those in the transport and construction sectors.
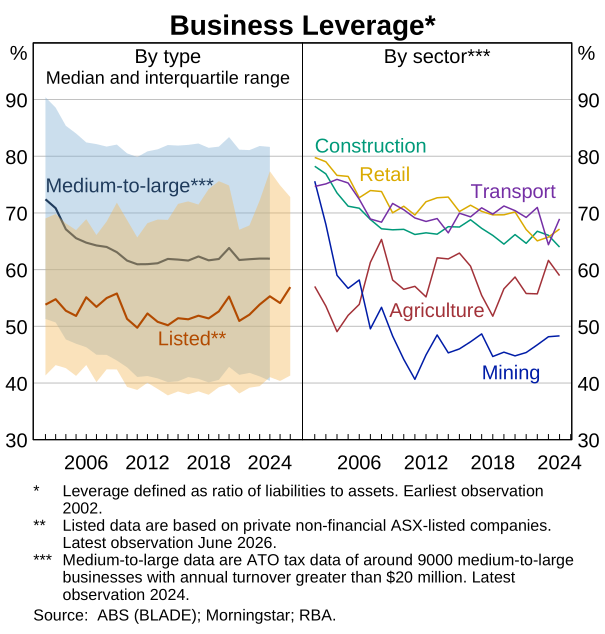
Leverage generally remains contained across the corporate sector, which gives businesses more flexibility to manage shocks. Aggregate corporate leverage has been stable, around longer-run average levels (Graph 2.12), and the level of debt held by relatively more indebted listed companies has decreased since the pandemic. Lower leverage enhances resilience by increasing firms’ capacity to access additional funding during periods of stress, including to manage unexpected cost increases or temporary weakness in demand. Information from liaison suggests that some firms had taken on more debt, pre-emptively increasing their working capital, to bring forward purchases ahead of anticipated future cost increases associated with higher energy prices. In addition, lower leverage reduces the vulnerability of business balance sheets to increased interest rate expenses. Information on small businesses’ leverage is limited, as many obtain loans by borrowing against the business owner’s residential property.17 Liaison suggests previous housing price growth had supported their balance sheet position in these cases.
Most lenders’ ongoing willingness to lend to businesses has supported their ability to manage a challenging period. Information from liaison suggests that most lenders have not materially changed their willingness to supply business credit this year outside of some small reductions in appetite for new lending to the transport industry, given its direct exposure to higher energy prices. Heightened competition for business loans, as well as other factors including automation of loan approval processes, have improved access to credit over the past couple of years, including for smaller businesses.18 This has helped them manage temporary cash flow pressures and refinancing risks. While strong business credit growth and strong competition have not been associated with a broad decline in lending standards to date, the RBA, together with other CFR agencies, is monitoring this closely as it is important that this remains the case (see below). For the segment of business lending provided by private credit funds, recent liaison information suggests there has been some tightening of financial conditions and an increased sensitivity to project risk. This may affect access to funding for some businesses who usually rely on these lenders (including some residential property developers). While visibility over private credit lending is limited, it remains a small share of total business debt and linkages with the banking system have been assessed as limited (see Box: Private credit in Australia).
Prior to the increase in pressures in 2026, stress in the business sector had appeared to be easing.
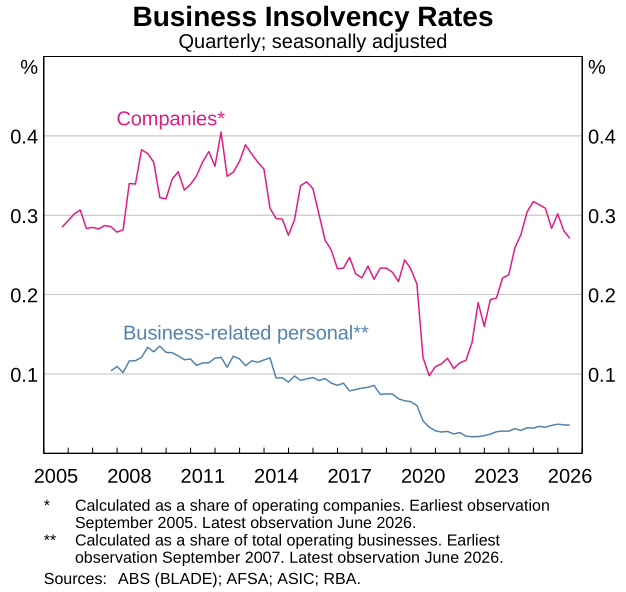
Total company insolvencies as a share of operating companies declined over the past year and are around their longer-run average (Graph 2.13).19 The recent administration of one large builder and developer will result in a temporary spike in the September quarter insolvency figures when they are available, reflecting the large number of subsidiaries involved (Graph 2.13 shows data to June quarter 2026). Firm-specific factors relating to excessive risk-taking over recent years appear to have played a key role in this insolvency. Personal insolvencies of business owners have stabilised at low levels. Firm viability had been supported by easing cash flow pressure and recovering domestic demand through to the beginning of 2026. Since insolvency represents the final stage of severe financial stress for firms, the current insolvency rate does not yet capture the full effect of weaker economic conditions.
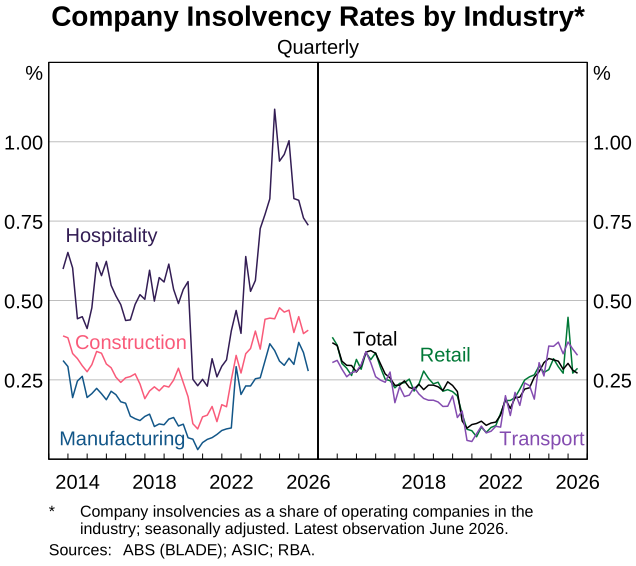
However, company insolvencies remain elevated in some industries, particularly hospitality, construction and transport (Graph 2.14). These industries are more exposed to the recent wage and input cost pressures. In the construction sector, elevated insolvencies also reflect the typically thin margins of some businesses. Consistent with this, information from the RBA’s liaison program indicates that for these industries the number of businesses seeking guidance from community and industry organisations remains elevated; support managing unpaid tax debt remains a common query. The Australian Taxation Office (ATO) had provided some temporary debt restructuring support for businesses affected by higher fuel prices earlier this year, but has more recently returned to resuming its debt collection.20
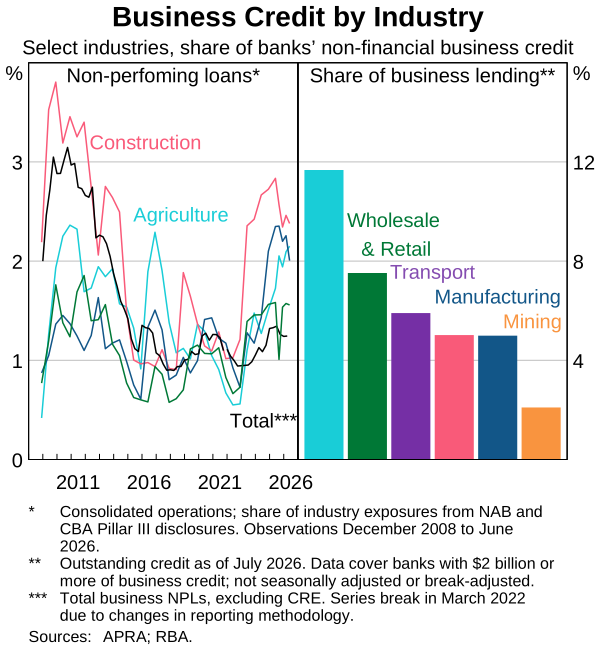
Financial stability risks from insolvencies remain contained. Banks’ exposure to insolvent companies remains limited, as most insolvencies to date have involved small companies or companies with little bank debt.21 Consistent with this, banks are well placed to manage any losses. Business non-performing loans (business NPLs) are mostly well secured and remain below the highs seen during the global financial crisis (see Box: Businesses’ exposure to the energy shock by sector and Chapter 3: Resilience of the Australian Financial System).22
Financial pressures are expected to increase over the period ahead, especially for smaller businesses and those in more energy-intensive or cyclical industries, though many appear well placed to manage these.
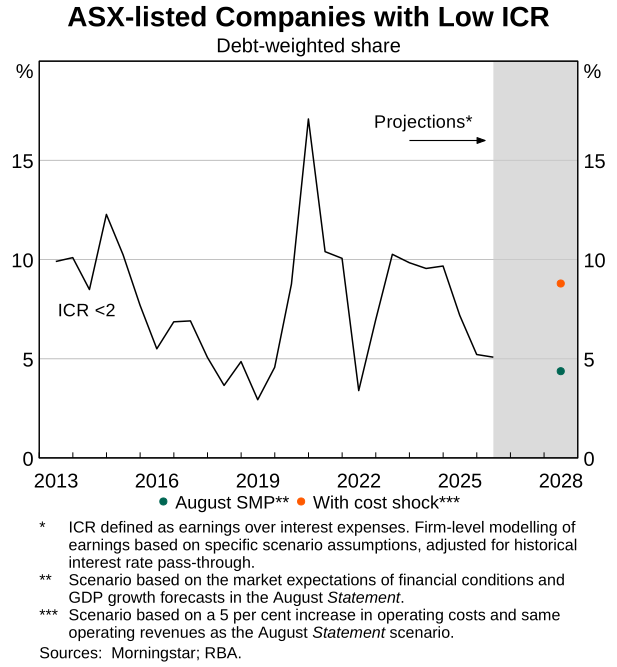
Larger companies are expected to remain resilient to higher interest rates and expenses. Changes in borrowing costs typically take some time to pass through to interest expenses of larger firms because many of them issue fixed-rate debt or hedge their interest rate exposure.23 The debt-weighted share of ASX-listed firms with a low interest coverage ratio (ICR) – a group historically associated with greater risk of insolvency – is projected to be little changed over the period ahead and remain low by historical standards (Graph 2.15).24 This is based on the market expectations of interest rates as of the August Statement and the forecast of GDP growth in the Statement which is for subdued but positive growth, which is likely to support moderate growth in earnings. More broadly, corporate balance sheets generally remain a little stronger than normal, suggesting that most larger companies would be resilient to macroeconomic uncertainty, tighter-than-expected financial conditions (including in the event of a shock originating from overseas) or weaker-than-expected demand (see 4.2 Focus Topic: Informing Our Financial Stability Assessment Using Scenarios).
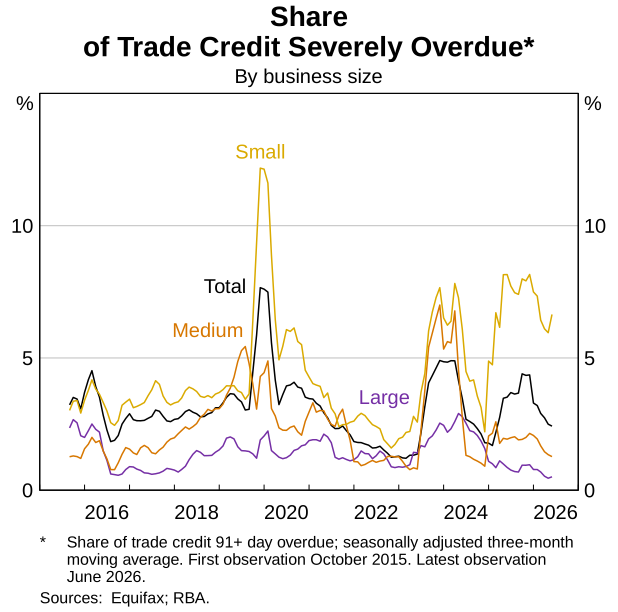
Cash flow pressures are expected to increase for some smaller businesses and those in more cyclical industries. Pass-through of cash rate increases is likely to be faster for smaller businesses than larger corporates. This is in part because many smaller businesses take out variable-rate business loans secured with a residential property mortgage. Indeed, measures of overdue trade credit (considered an early indicator of stress) suggest that smaller businesses are already experiencing higher cash flow pressures than larger businesses (Graph 2.16). The incidence of financial stress is expected to remain higher in the period ahead for smaller businesses, particularly in the construction, hospitality and retail industries, where uncertainty and weaker demand could weigh on discretionary spending amid rising input costs. Stress relating to higher energy input costs is more likely to be concentrated in firms with very high energy intensities and lower buffers, like transport (see Box: Businesses’ exposure to the energy shock by sector). Information from liaison suggests lenders are not expecting increased stress to result in a significant increase in business NPLs, given firms’ relatively strong balance sheets and prudent lending standards (see below).
Box: Businesses’ exposure to the energy shock by sector
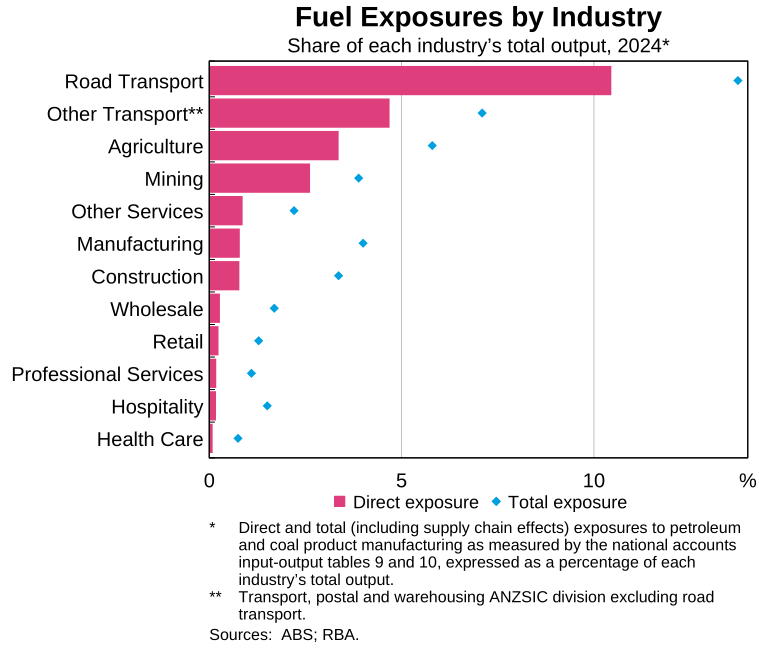
Businesses’ direct exposure to energy expenses varies considerably by sector. The continued conflict in the Middle East has driven significant increases in the cost of energy and other oil-derived products such as plastics and fertilisers.25 For most businesses, energy such as petrol, diesel, natural gas, and electricity accounts for less than 5 per cent of total expenses. However, this share can be much higher for firms in energy-intensive industries including transport (particularly road transport), mining and agriculture, and especially for smaller firms. To demonstrate this, we focus below on firms’ specific exposure to fuel inputs, as defined by input-output tables from the Australian Bureau of Statistics.
Indirect exposure to this price shock is larger when considering the full supply chain. When accounting for the fuel intensity of a sector’s intermediate inputs, including transportation costs, total fuel exposures are much larger than direct exposures (Graph 2.17). Firms that are dependent on fuel-intensive inputs (e.g. in construction) or are otherwise highly exposed indirectly to fuel costs (e.g. manufacturing and hospitality) and are also unable to adjust their supply chain may continue to face challenges as the shock continues to propagate through the economy. Firms also have exposure to fuel shocks through direct and indirect exposures to oil-derived inputs (such as fertiliser and plastics), but this additional channel is not included in this analysis.
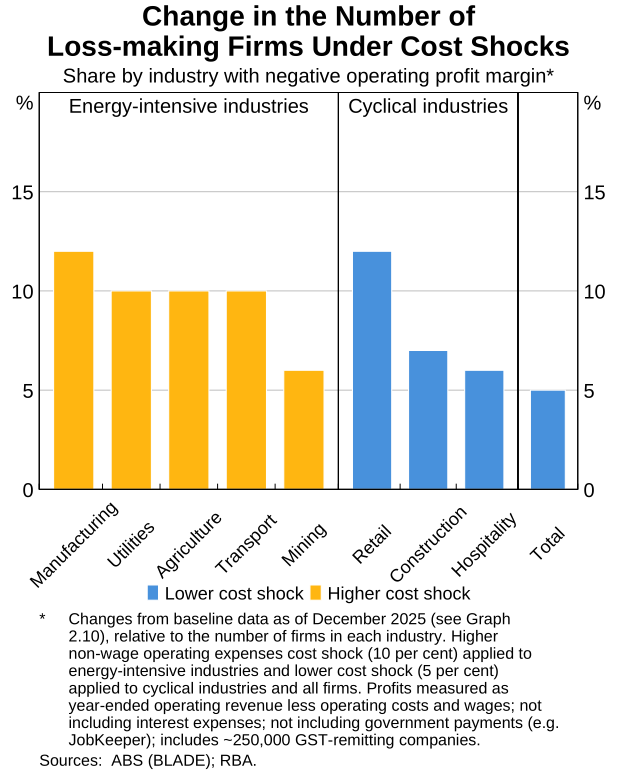
Near-term stress is more likely to be concentrated in energy-intensive firms. To consider the potential impact of recent input cost increases on businesses’ operating margins, we estimate how a shock to firm operating costs (with shock size reflecting industry energy exposure) could increase the share of firms making an operating loss using administrative tax data.26 This share is expected to increase the most in energy-intensive industries, such as manufacturing as well as those in the retail industry (reflecting narrower margins), and particularly for smaller firms (Graph 2.18). This pressure will be felt particularly where firms are less able to pass on higher costs to their customers due to demand conditions or competitive pressures. If there were to be greater pass-through of higher costs, this could be an additional source of financial stress for downstream businesses that are more indirectly exposed. This is particularly relevant for firms in sectors such as retail, hospitality and construction, which tend to operate at lower margins and where the incidence of financial stress is already higher than in other sectors. While there is some evidence of construction companies adjusting their prices, broader pass-through of energy costs to consumer prices is expected to progressively occur until early 2027.27
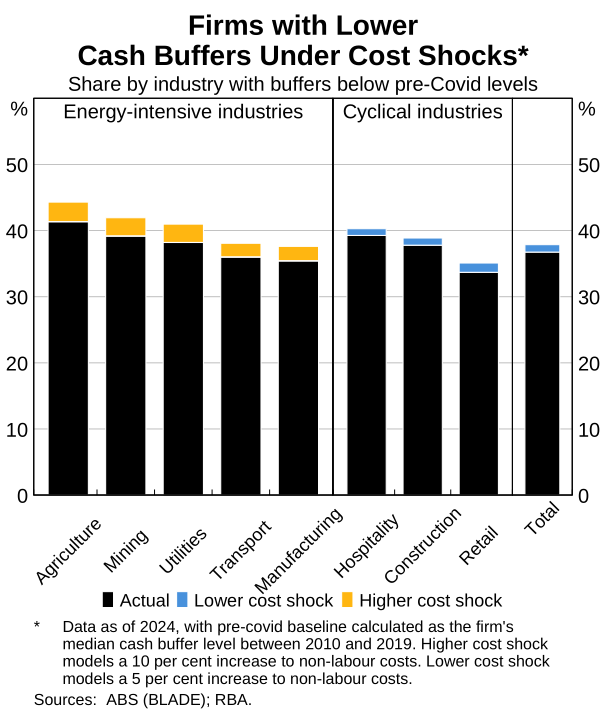
Above-average financial buffers can support resilience for many energy-intensive firms. The cost shocks considered above are estimated to result in only a modest increase in the share of firms with cash buffers below pre-COVID levels in most sectors. In most sectors, a majority of firms would still have cash buffers above their pre-pandemic levels (Graph 2.19).
Financial stability risks from the current energy price shock on businesses are likely to remain contained. While overall outstanding bank credit exposures to high energy-intensity sectors are material, and lenders have increased monitoring since the escalation of conflict in the Middle East, liaison information suggests that lenders do not expect credit quality to decline significantly beyond recent increases in NPLs (Graph 2.20). Further, many loans to smaller businesses tend to be well secured with real estate. Beyond direct implications for lenders, small businesses tend to spend more (relative to turnover) on both energy inputs and wages than other firms, so they may be more likely to adjust employment if they are unable to manage potential shocks through other margins. Nevertheless, survey measures suggest these energy-intensive small businesses tend to have a small number of employees and represent a small share of total employment, limiting potential spillovers to broader labour market conditions. Beyond potential employment effects, these pressures may also continue to affect consumers through higher prices (where stronger demand allows businesses to pass on higher costs). As noted above, the strong financial position of most households is expected to support their resilience to such pressures.
The subdued economic outlook and sound overall lending standards are expected to limit the build-up of vulnerabilities relating to increases in business leverage, but CFR agencies will continue to closely monitor this.
Business leverage remains low overall despite increasing over the past few years and the slowing economic outlook is expected to limit future growth. Business credit growth remains strong and has been above its post-GFC average for a couple of years, though that was a period of relatively subdued business credit growth. Historically, business leverage in Australia has been sensitive to changes in the outlook for demand. Accordingly, the outlook for slowing economic growth presented in the August Statement suggests that any increase in aggregate leverage is likely to be limited. Consistent with this, liaison with lenders suggest credit demand is expected to ease.
Lending standards remain sound overall, and the RBA, together with other CFR agencies, will continue to monitor for any build-up in vulnerabilities. While data limitations make comparison of business lending standards over time challenging, there is little evidence that the recent strength in business credit growth and strong competition between lenders was accompanied by a material overall easing in lending standards. Liaison indicates competition remains strong but has not led to meaningful changes in banks’ lending criteria or risk appetite. Previous process improvements reported over the past couple of years, including automation, had facilitated an increased supply of credit to some smaller businesses and self-employed borrowers.28 CFR agencies’ monitoring of developments extends beyond regulated entities like banks to include business credit supplied by non-bank financial institutions (NBFIs). Information on some non-bank lenders is more limited, in particular for private credit firms. If losses on private credit deals picked up, these would be passed through to their investors and potentially cause stress for those with large exposures. However, systemic impacts would likely be limited by the sector’s small size (see Chapter 3: Resilience of the Australian Financial System).
2.3 Commercial real estate
Fundamentals have continued to improve across most Australian CRE markets and investor demand remains strong, despite higher interest rates and elevated uncertainty.
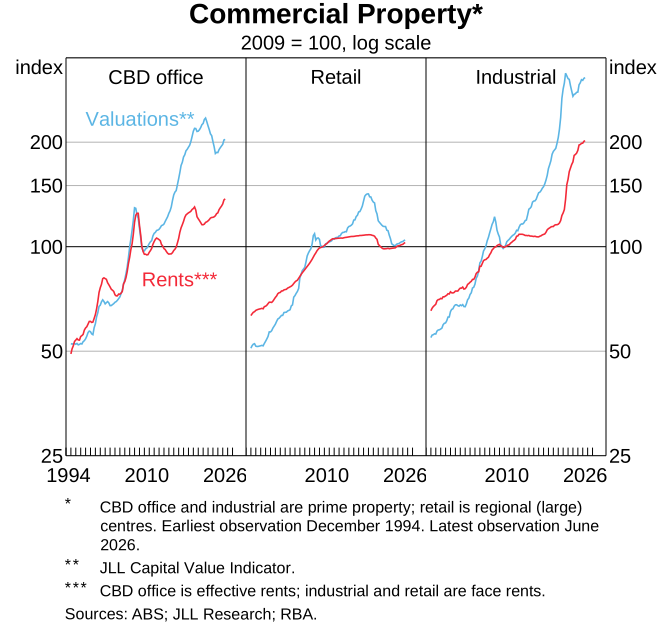
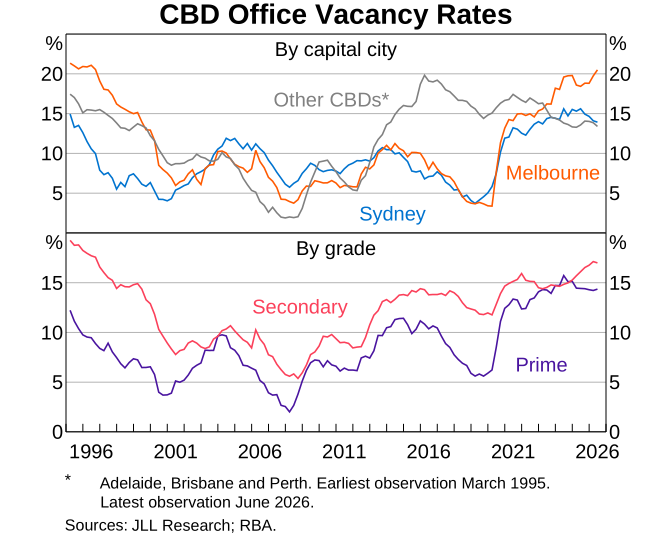
Fundamentals have continued to improve across most CRE markets over the first half of 2026, though some pockets of weakness persist (Graph 2.21). While higher interest rates, inflationary pressures and elevated uncertainty have increased risks to the outlook, the Australian CRE sector is well positioned to face these headwinds and valuations continued to improve across most markets. Ongoing tenant preference towards prime office space is supporting increased valuations and rents in the office sector, though conditions remain weaker in some markets, including lower-grade office properties and those located in areas with high vacancies, such as parts of Melbourne (Graph 2.22). Valuations and rents continue to rise gradually in the retail sector, consistent with declining vacancy rates across most retail asset types and geographies. Looking ahead, higher interest rates and cost pressures on the retail industry (discussed above) may weigh on demand for retail assets. Fundamentals remain strong in the industrial sector, reflecting ongoing demand for warehousing and distribution centres, though new supply has seen growth in valuations and rents ease.
Investment in the construction of data centres in Australia has picked up strongly over recent years, mainly funded by debt.29 The strong growth in investment is supported by growing demand from global hyperscalers, and liaison contacts expect this trend to continue in the years ahead. While visibility is limited, available information suggests that Australian companies that operate data centres have so far mostly relied on both foreign and domestic debt rather than equity funding – in particular, syndicated loans involving private equity firms and domestic and foreign banks – as has been the case in overseas markets including the United States.30 Risks from data centre investments to the domestic financial system are limited to date. Domestically raised debt related to data centres remains relatively small compared with overall business funding, and liaison suggests Australian lenders have generally remained quite attentive to risk in their approach to lending for the construction of data centres. However, the relatively high reliance on debt and rapidly growing size of this sector could introduce some vulnerability to the broader financial system over time (see Box: Funding the AI investment boom).
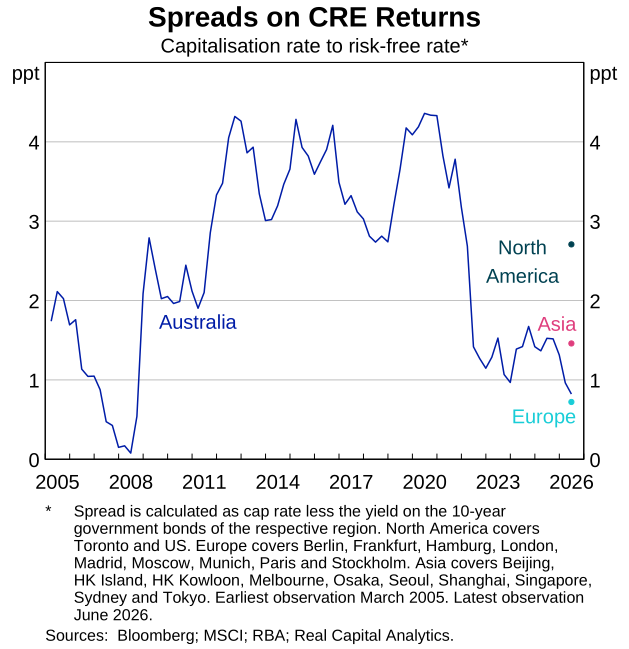
Australian CRE has been a relatively attractive asset class for investors and liaison suggests this is expected to remain the case. Domestic transaction volumes have been strong so far in 2026, in particular in the retail and industrial sectors. Foreign investors have maintained their exposure to Australian CRE, accounting for close to one-quarter of transactions by value over the past year. In liaison, lenders exposed to CRE cite a number of factors for Australian CRE’s attractiveness to overseas investors, including a stable economy and transparent institutions. Liaison contacts also note that some foreign investors are seeking to redirect their capital to Australian CRE, away from other markets (such as the United States) due to geopolitical tensions and weaker confidence. Moreover, Australian CRE yields remain attractive relative to returns in some comparable markets, such as Europe (Graph 2.23). These factors, as well as growing global demand for data centres, have the potential to continue to support Australian CRE markets through inflows of foreign capital.
While banks’ exposures to CRE have continued to increase, risks to the financial system remain contained and there is little evidence of financial stress among owners of CRE.
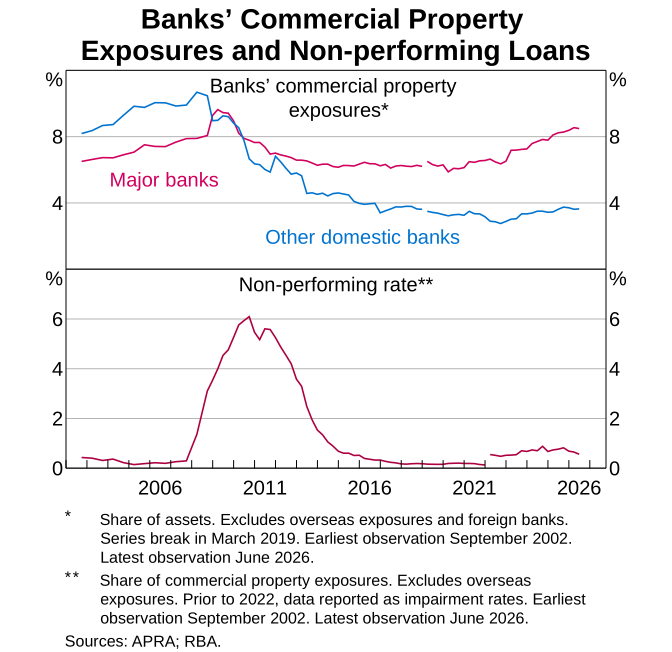
After declining for more than a decade after the GFC, CRE loans have increased as a share of Australian banks’ assets in recent years, driven by growth in lending by the major banks particularly in the industrial sector (Graph 2.24). Liaison suggests a significant share of this has been increased lending to existing customers deemed by the banks to be lower risk, and this has helped contain default rates at low levels (see below).
There has continued to be little evidence of financial stress among owners of Australian CRE. Specifically:
- ASX-listed A-REITs maintain solid financial positions reflecting improving fundamentals. Earnings have improved over the past couple of years and leverage remains stable. ICRs have continued to improve on average, although have declined a little over the first of 2026 for some funds, reflecting the pass-through of higher borrowing costs to interest expenses. Liaison suggests that A-REITs maintain manageable debt levels and many have hedged a large share of their debt for the year ahead. Additionally, strong competition among lenders (see below) have allowed some CRE investors to refinance their loans at favourable rates, partially offsetting the impact of higher interest rates.
- The share of banks’ CRE loans classified as non-performing remains low (Graph 2.24). Liaison with banks suggests that while there are some signs of stress among some CRE owners, CRE loan quality is generally expected to remain strong.
- Liaison with non-bank lenders also suggests that their CRE loan performance generally remains sound. While data on non-bank lender loan quality is limited, particularly among lenders with significant exposures to lower quality assets or riskier borrowers, systemic risks from non-bank lenders appear limited by the sector’s small size (see Chapter 3: Resilience of the Australian Financial System).
Ongoing strong competition in CRE lending could undermine future resilience if it leads to a further and more material deterioration in lending standards.
Competition in CRE lending remains strong from both bank and non-bank lenders, particularly for higher-quality projects. Liaison with lenders suggests that higher construction costs and affordability constraints have reduced the pool of feasible projects, increasing competition for the projects that remain viable. Strong competition had led to some easing in lending terms over recent years, but standards appear to have been largely unchanged more recently. For instance, some lenders had loosened loan covenants, or lowered presale requirements for residential developments, although other terms have generally remained unchanged.31 This easing had been somewhat offset by lenders being more discerning on project fundamentals (including location) and by engaging with established builders and developers. Some non-bank lenders have reported a moderation in lending competition more recently, particularly for higher-risk projects. However, information remains more limited on lending by non-bank lenders, and private credit firms in particular. A further and more material easing in CRE lending standards would increase the risk that credit is extended to riskier borrowers, undermining the resilience of the sector.
Endnotes
1 Renters are much more likely to experience stress than mortgage holders. HILDA data, while available up to 2022 only, suggests that around 15 per cent of renters experienced a cash flow deficit compared with around 4 per cent of mortgage holders. A larger share of households in the first income quartile are renters (40 per cent), while very few are owner-occupier mortgagors (7 per cent).
2 The median estimated shortfall for borrowers in a deficit is estimated to be around 6 per cent of income.
3 The arrears rates of recently originated loans may understate their eventual performance because these loans have had less time to experience adverse income or expenditure shocks and transition into arrears. Loan seasoning effects imply that newer loans typically exhibit lower arrears rates than more seasoned loans, see Morgan R and E Ryan (2024), ‘Recent Drivers of Housing Loan Arrears’, RBA Bulletin, July.
4 The RBA uses the Securitisation System dataset to estimate the share of borrowers in negative equity. This share is adjusted to account for the biases in the Securitisation System dataset identified by Hughes A (2024), ‘How the RBA Uses the Securitisation Dataset to Assess Financial Stability Risks from Mortgage Lending’, RBA Bulletin, July. With or without adjustment, the share of borrowers in negative equity remains below 1 per cent.
5 Like all recent borrowers, scheme participants had their mortgage applications assessed at interest rates 3 percentage points higher than their offered rate due to APRA’s serviceability buffer. This will support participants’ ability to make scheduled mortgage payments. First home buyers have also historically experienced more favourable labour market outcomes and stronger income growth than other borrowers. More generally, scheme participants are unlikely to transmit stress to the broader financial system because their overall share of lending is low, and as the Government guarantees up to 15 per cent of the property value in the case of default.
6 Housing price at risk modelling suggests that the combination of previous strong housing price growth and high housing prices relative to fundamentals, including incomes and high user costs, mean downside risks to prices are currently elevated. For more information on the user cost of housing, see Fox R and P Tulip (2014), ‘Is Housing Overvalued?’, RBA Research Discussion Paper No 2014-06.
7 This scenario uses the Securitisation System dataset and applies a uniform 20 per cent decrease to current housing values, assuming all else remains the same. It does not consider the broader macroeconomic implications of declines in housing prices.
8 Home loan defaults usually occur when negative equity is accompanied by inability of the borrower to service the loan. For evidence of this in Australia, see Bergmann M (2020), ‘The Determinants of Mortgage Defaults in Australia – Evidence for the Double-trigger Hypothesis’, RBA Research Discussion Paper No 2020-03.
9 The scenario uses a labour market deterioration similar in magnitude to the 2008/09 downturn.
10 Having low or negative equity can affect a household’s ability or willingness to make the difficult decision to sell their property to fully pay off their loan when facing financial stress. Low or negative equity increases a mortgagor’s likelihood of both falling into arrears and transitioning from arrears into foreclosure. See Bergmann, n 8.
11 Interest-only loans can enable a borrower to accumulate larger liquidity buffers or manage cash flow for a given loan size during the interest-only period because minimum repayments are smaller, though this comes at the expense of slower equity accumulation and a potentially large increase in minimum repayments at the end of the interest-only period. Interest-only lending can potentially be riskier from a systemic perspective to the extent that it contributes to unsustainable increases in housing prices or leverage, or if it is accompanied by an increase in other riskier types of borrowing including higher LVR or higher DTI lending.
12 In certain circumstances, lenders are permitted to apply an exemption to serviceability requirements, including, for example, in cases of like-for-like refinancing. In late 2023, the share of loans granted exemptions increased sharply to about 5 per cent of new lending. This followed an APRA open letter clarifying how they expect banks to manage exemptions, and coincided with a period of heightened refinancing activity. Information from liaison suggests many exemptions were for borrowers applying to refinance their loans but who no longer passed the new and stricter serviceability assessment after successive interest rate increases.
13 See Lowe P (2019), ‘The Housing Market and the Economy’, Address to the AFR Business Summit, Sydney, 6 March 2019. However, grandfathering of recent negative gearing changes, where existing investors are still able to negatively gear their investment, could motivate some borrowers to hold on to their properties to maintain this ability.
14 In addition to weaker demand at this stage of the cycle, serviceability requirements mean that higher (lower) rates also decrease (increase) the maximum size of a loan a borrower can service on a given income, all things equal.
15 See CFR (2026), ‘Quarterly Statement by the Council of Financial Regulators’, Media Release No 2026-05, 3 September; CFR (2025), ‘Charter’; RBA (2025), ‘Memorandum of Understanding Between the RBA and APRA’.
16 Operating margins exclude interest, tax, depreciation, and amortisation expenses.
17 In Graph 2.12, we focus on businesses with more than $20 million in annual turnover; businesses below this threshold can report zero-interest, at-call, related party loans as debt rather than equity. This distorts the ability to identify the true leverage of a small business. See ATO (2025), ‘Debt and Equity Tests: Guide to “At Call” Loans’, 18 November.
18 See Harvey N, S Lai and J Spiller (2025), ‘Small Business Economic and Financial Conditions’, RBA Bulletin, October.
19 The longer-run average refers to the average total company insolvency rate calculated using data from 2005–2019. In cumulative terms, total company insolvencies have risen back to around their pre-pandemic trend. However, the pre-pandemic trend is a conservative benchmark because it does not account for strong growth in the number of operating companies over the past five years. Higher growth in the number of companies means that for a given insolvency rate, the absolute number of insolvencies will remain elevated above historical averages (even after detrending).
20 From April to 30 June 2026, the Australian Taxation Office (ATO) provided temporary tax relief for businesses impacted by fuel supply issues, including payment plans and remission of interest charges. See ATO (2026), ‘ATO Fuel Response Payment Plan’, 1 July.
21 Around 75 per cent of companies that entered insolvency over the 2024/25 financial year had less than 20 full-time employees, and around 70 per cent had no debt owing to secured creditors (the type of debt most likely to be owed to banks). See RBA (2025), ‘4.3 Focus Topic: The Recent Increase in Company Insolvencies and its Implications for Financial Stability’, Financial Stability Review, April.
22 Loans are typically classified as non-performing if payments are more than 90 days past due or if banks no longer expect to realise the full economic benefit of a loan, which generally includes when a business borrower enters insolvency. For more details, see RBA (2025), ‘Box: The Recent Increase in Banks’ Non-performing Business Loans’, Financial Stability Review, October.
23 Indeed, latest available data to June 2026 show that average interest rates on outstanding listed company debt had remained stable since December 2025. This reflects the remaining effect of the decreases to interest rates in 2025 and early effects from the increases over 2026.
24 An ICR of two is used as a threshold indicative of weaker debt servicing capacity and historically associated with an increased risk of insolvency. We use a slightly more conservative threshold than some other peer central banks (e.g. the Bank of England monitors an ICR threshold of 1.5 in its Financial Stability Review).
25 For details on the channels through which increases in energy prices can affect output and inflation in Australia, see RBA (2026), ‘Chapter 3: In Depth – The Impact of Higher Global Energy Prices on the Australian Economy’, Statement on Monetary Policy, May.
26 We apply the lower cost shock (5 per cent of non-labour operating costs) to firms with lower direct energy exposure and a medium cost shock (10 per cent) to firms in industries more directly exposed to reflect the greater near-term impact on margins.
27 RBA (2026), Statement on Monetary Policy, August.
28 See Jennison S, J Spiller and P Wallis (2026), ‘Recent Changes in Credit Markets and Their Implications for Monetary Policy’, RBA Bulletin, February.
29 Industrial sector data exclude data centres, which are classified as a separate asset class within commercial real estate, though sector-level data are more limited.
30 See Speed B (2026), ‘Data Centre Financing in Australia’, RBA Insight, September.
31 In February 2025, APRA clarified that its 2017 letter on commercial property lending standards did not constitute minimum presale requirements. This guidance had previously been misinterpreted by some lenders as a requirement for qualifying presales equivalent to at least 100 per cent of committed debt. Some lenders interpreted this clarification as guidance supporting an easing in standards, though liaison contacts generally note lower presale requirements in the industry have been mainly driven by heightened competition and an optimistic outlook on the property market. See APRA (2025), ‘APRA Clarifies Its March 2017 Letter Regarding Commercial Property Lending’, February; APRA (2017), ‘Letter to ADIs: Commercial Property Lending’, March.