
Financial Stability Review – October 20264.2 Focus Topic: Informing Our Financial Stability Assessment Using Scenarios
The RBA uses scenario analysis to better understand how a wide range of events could affect the economy and financial system, including how financial, monetary policy and macroeconomic developments could interact. In the context of financial stability, scenario analysis exercises help inform our assessment of the level of resilience in the financial system and identify vulnerabilities that could amplify a negative economic or financial shock. While the use of scenario analysis is not new, in the prevailing shock-prone global environment it has become an increasingly valuable tool for both policymakers and financial institutions. For example, scenario analysis can help us think through the possible consequences of risk events that have not yet happened. Such analyses help inform our assessment of risks and vulnerabilities relating to households, businesses, and banks in Chapters 2 and 3 of the Financial Stability Review. This Focus Topic provides a more conceptual view of the tools available and how we incorporate the results in our financial stability assessment.
Scenario analysis is a flexible tool that can be used to examine how a range of events could impact the stability of the financial system.
Scenario analysis helps inform our assessment of financial stability. The RBA’s financial stability assessment framework examines the level of net vulnerabilities in the financial system – that is, the level of vulnerabilities after taking into account offsetting factors that can mitigate the impact of a shock.1 One way to inform our assessment of net vulnerabilities is to conduct scenario analysis, which takes a possible path, usually adverse, and models the effect on individual households, businesses, banks and other parts of the financial system. Among other things, this allows us to estimate the share and type of households or businesses experiencing financial stress, and any impact on bank capital ratios. The tools we currently use for financial stability scenario analysis focus on modelling the effects of shocks that are macroeconomic and financial in nature. See 4.1 Focus Topic: Operational Risk and Financial Stability for our approach to understanding shocks from operational sources.
In the context of financial stability, understanding the distributional effects of shocks is particularly important, as aggregate outcomes can mask significant vulnerabilities within specific sectors or groups. Scenario analysis for financial stability purposes is often conducted using unit-record data at the household, loan or firm-level. These granular data can help us identify pockets of vulnerability for groups of households and businesses, even when overall or aggregate measures might convey a general picture of soundness.
Scenario analysis is flexible and can be used to explore a range of financial stability questions, including analysing the interaction between monetary policy and financial stability. The RBA publishes a baseline forecast of the expected path for the economy, on the technical assumption that the cash rate follows financial market pricing, in its quarterly Statement on Monetary Policy. Using this central forecast to analyse vulnerability indicators helps to inform assessments of how the expected macroeconomic outlook and monetary policy settings could affect the incidence of stress in the economy and any implications for financial stability. Another application of financial stability scenario analysis is for stress testing, which takes severe-but-plausible scenarios informed by the risk outlook at the time, and examines the effect on overall resilience of the financial system. Analysing these tail events helps the RBA and partner agencies on the Council of Financial Regulators (CFR) to identify, monitor and address vulnerabilities in the financial system and strengthen crisis readiness plans. Sharing these insights more broadly through RBA publications such as the Financial Stability Review supports more informed decision-making by households, businesses and lenders, including in relation to the likelihood or consequences of adverse events.
Our current approach to financial stability scenario analysis does not routinely incorporate behavioural adjustments or feedback loops between the financial system and real economy. This has some advantages, as it makes the models simpler to run and easier to understand, but could also miss important interactions. For example, an increase in the share of households facing financial pressure could lead to lower aggregate consumption as they pull back on spending, which impacts businesses and labour market conditions. Banks may subsequently tighten lending standards, which could lead to lower spending and could then be transmitted back to businesses. To account for this known limitation, we consider very severe scenarios, which can allow for the impact of these second-round effects.2
Scenario analysis can help us think through the potential consequences of risk events that have not happened before.
During a stress event, financial vulnerabilities can amplify the effect of a negative shock, while buffers (such as savings and other liquid assets) can dampen the effect. For example, during the global financial crisis (GFC), many mortgagors were highly leveraged – particularly those in the United States – and banks did not always properly assess borrowers’ ability to continue paying their loans.3 When housing prices fell and unemployment rose, these vulnerabilities amplified the shock across the financial system in the United States and globally. During both the GFC and the COVID-19 pandemic, Australian households and businesses avoided widespread defaults. The maintenance of sound lending standards and associated buffers in Australia, along with policy responses to these events, served us well in these episodes. However, we must remain vigilant for potential vulnerabilities in our system.4
In the Australian context, scenario analysis is especially important since we have not had the same experience with significant stress events as some other countries, such as a very large decline in housing prices. This is where stress testing using a variety of scenarios is helpful, with these scenarios often informed by experiences in other countries and incorporating assumptions about how conditions could evolve. The types of scenarios we have assessed include the effects of a pronounced deterioration in labour market conditions on households, the impact of a ‘higher-for-longer’ cash rate path on both households and businesses, the effect of a trade war, and the effect of a prolonged pandemic causing severe stress.5 While we cannot anticipate every possibility, with a range of scenarios, we can capture the main effects of many different events and look for common areas of vulnerability. Scenario analysis results are not precise, due to data and model limitation, but they provide insights as to where vulnerabilities may be present.
The RBA considers a variety of scenarios and approaches depending on the current risk environment.
In this section, we create a new stress scenario to illustrate how the RBA uses scenario analysis tools to evaluate the resilience of households, businesses and banks. This scenario is deliberately much more pronounced than the adverse scenarios considered in the May 2026 Statement on Monetary Policy, in order to stress test borrowers and lenders from a financial stability perspective.6 In the scenario, households, businesses and the banking sector face a very adverse shock: the unemployment rate increases to 6.3 per cent, GDP falls by 1.4 per cent, housing prices fall by 20 per cent from current levels, inflation increases to 7 per cent and the cash rate increases to 5.6 per cent. This scenario assumes current geopolitical tensions worsen and risks materialise, leading to further negative supply shocks.
For households, a key vulnerability indicator is the share of borrowers in a cash flow shortfall, where income cannot cover debt payments and essential expenses. Households in shortfall are more likely to have difficulties servicing their loans. Our assessment focuses first on those with mortgages, which account for more than 90 per cent of household debt, before turning to renters and outright homeowners.
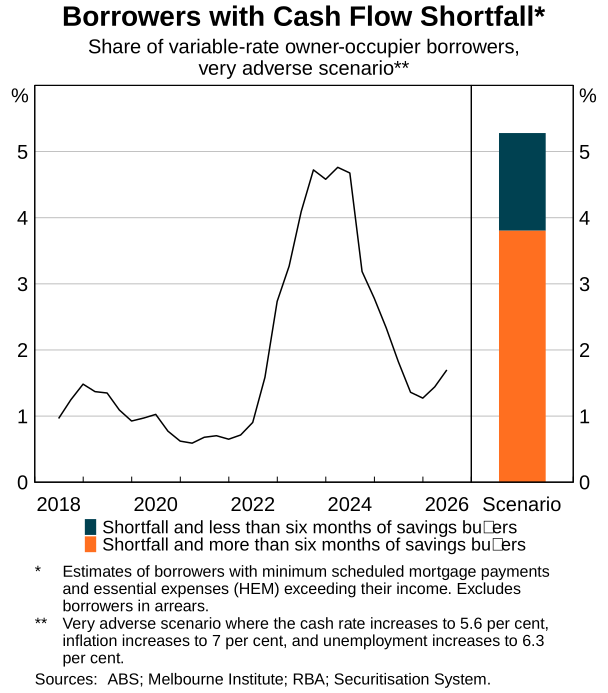
Loan-level data on mortgages from the RBA’s Securitisation System is used to simulate the effect of this very adverse scenario on mortgage holders.7 In this scenario, the share of mortgagors in a cash flow shortfall increases to about 5 per cent, but remains contained, just surpassing the peak observed in 2023 (Graph 4.2.1). This modelling can also incorporate offsetting factors that increase resilience, such as savings or housing equity. Savings buffers can enable a household to temporarily manage a cash flow shortfall until they are able to adjust expenditures or find more work. Households with sufficient housing equity have the option – though difficult and disruptive – to sell their property to repay the loan. About two-thirds of borrowers in cash flow shortfall have sufficient savings buffers to cover at least six months of mortgage payments and essential expenses. The borrowers most likely to enter foreclosure, where the lender takes possession of the property, are those in a cash flow shortfall, with low savings buffers and in negative equity. The share of borrowers with all three of these characteristics is less than 1 per cent of mortgagors, even in this very adverse scenario.
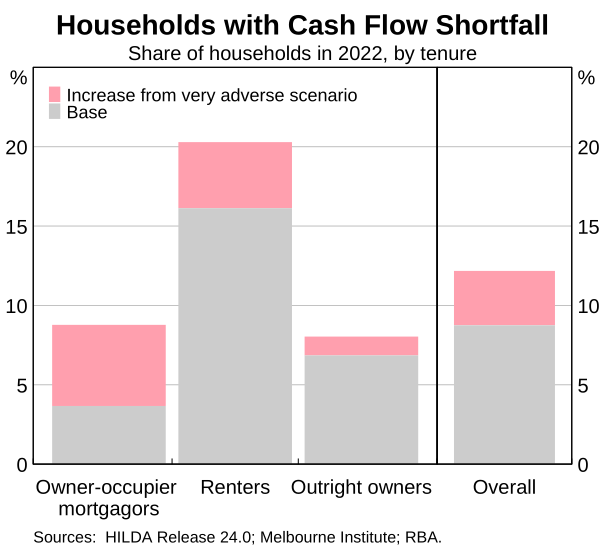
We can also use household-level data from the Melbourne Institute’s HILDA survey to understand how the effects differ for renters and homeowners, providing insights into the broader economic impact.8 HILDA surveys household wealth every four years, providing a rich, though less frequent, picture of household finances. The share of mortgagors in cash flow shortfall in HILDA analysis for 2022 data roughly doubles in the downside scenario. While the level differs somewhat from the Securitisation System data analysis, due to differences in definitions and coverage, the proportional increase is broadly equivalent. Renters, who tend to be younger and have smaller savings buffers, are generally more likely to be in cash flow shortfall than homeowners (Graph 4.2.2). While renters are not heavily affected by interest rate changes, since they hold little debt, increases in unemployment and inflation affect them more than other types of households, leading to an increase in the share in cash flow shortfall. Homeowners who have paid off their mortgage in full (outright owners) show the smallest proportional increase under the very adverse scenario, since most hold little debt and households in this group are more likely to be retired, reducing the impact of the unemployment shock. Given the limited amount of debt held by renters and outright owners, stress in these groups is less likely to affect financial system stability.
For businesses, where data availability is more limited, we consider measures of company debt serviceability and profitability. To evaluate debt serviceability, we use the interest coverage ratio (ICR), defined as a firm’s earnings divided by its interest expenses. An ICR less than two, indicating earnings are less than double the interest payments amount, has been found to be associated with a higher likelihood of company insolvency.9 For the timeliest analysis, we use publicly listed company-level data to generate scenarios based on company ICRs. In addition, we rely on tax data covering a broader (although more lagged) sample of businesses to estimate the effects of a shock on operating profit margins and cash buffers.
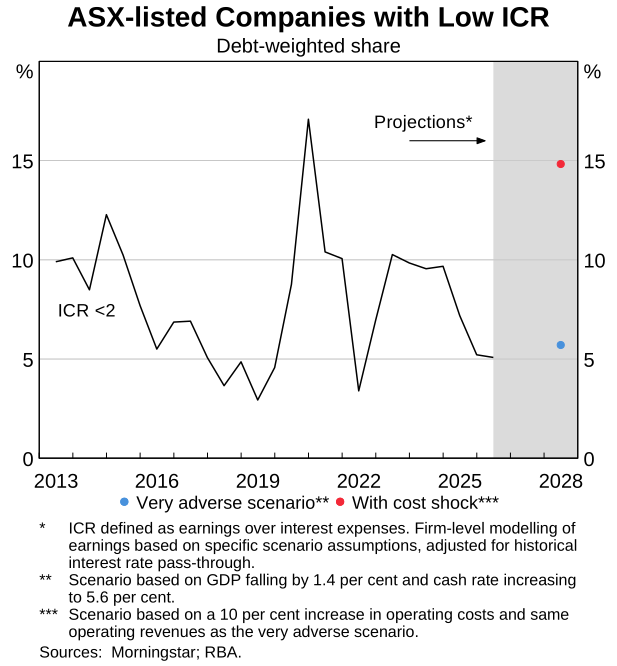
Focusing first on publicly listed companies, the debt-weighted share with a low ICR is based on projecting interest expenses and earnings using financial market and economic forecasts. Graph 4.2.3 shows how the share of listed companies with a low ICR changes when considering the very adverse scenario discussed above, as well as with an additional 10 per cent increase in operating costs to more specifically simulate a Middle East conflict-related scenario that leads to a broad-based increase in input costs. One source of resilience for many large corporates is that they issue fixed-rate debt or hedge their interest rate exposure. This slows the pass-through of higher interest rates in the scenario to interest expenses and limits upward pressure on the share projected with a low ICR. Even in the extreme scenario with broad-based cost increases, the share of firms with a low ICR remains below the levels reached at the peak of the pandemic stress.
Smaller non-listed firms are more vulnerable to these scenarios, as are firms in certain industries. Given the wide variation in the types of firms across the business sector, it is useful to consider the potential effect of a shock on different industries and sizes of firms. Smaller firms are more likely to experience stress than large, publicly listed companies because they have fewer options to access alternative financing or make adjustments in a downturn. However, smaller firms also account for a substantially smaller share of total business debt than larger companies and so are less likely to transmit stress through the financial system. Historically, most business insolvencies have been small firms with little bank debt and few employees, limiting the broader transmission of stress (see Chapter 2: Resilience of Australian Households and Businesses).
Businesses also have different exposures to different shocks, which we can analyse using granular tax data.10 For example, in ‘Box: Businesses’ exposure to the energy shock by sector’ we show how energy-intensive sectors, such as agriculture and mining, are more directly exposed to higher fuel prices associated with the Middle East conflict. Other businesses, such as those in manufacturing and retail, are mainly exposed indirectly through input cost pass-through. Therefore, when constructing the Middle East-related scenario described in the Box, we applied a larger cost shock for businesses in high energy-intensity sectors.
For the banking sector, we use a stress-testing model to examine the impact of a very adverse macroeconomic downturn on the solvency of banks. The approach uses a top-down stress testing model, where a scenario is applied to a set of large banks and changes in capital ratios are estimated based on a combination of regulatory data and data from the RBA’s Securitisation System.11 In the model, decreases in capital ratios are driven by higher credit losses and increases in banks’ risk-weighted assets, though these effects are partly offset by banks retaining more earnings to recapitalise during periods of stress. This approach allows for funding cost and liquidity contagion effects between banks. As shown in Chapter 3: Resilience of the Australian Financial System, the Australian banking system remains resilient to a very adverse macroeconomic shock. The model can also be used for more severe stress scenarios or ‘reverse’ stress tests to understand how large a shock needs to be for the effect on banks’ capital ratios to impair their ability to continue lending.
The RBA’s analysis is complementary to stress testing done by the Australian Prudential Regulation Authority (APRA). As the regulator for financial institutions, APRA uses multiple approaches to stress test banks and some other regulated entities.12 First, APRA-led stress tests take a bottom-up approach – regulated entities use their own internal data and tools to analyse the impact of a scenario provided by APRA. Some of these exercises focus on specific industries, while others look at the system as a whole. APRA also conducts top-down stress testing analysis, to assess resilience, either alongside APRA-led tests or in response to emerging risks. APRA uses the results to assess capital adequacy, support supervisory activities and inform prudential policy, including aspects of the capital framework. Consistent with the RBA, APRA finds that banks could withstand a severe downturn.
Stress testing is a key part of risk management for banks. APRA also reviews entities’ own stress tests and asks them to consider a range of shocks, including downside macroeconomic scenarios, idiosyncratic liquidity events, or systemic events affecting funding markets. These scenarios can be used to aid in capital management, inform recovery planning, and improve banks’ overall understanding of risk. Depending on the objective of conducting the stress test, different scenarios and data are used. In today’s shock-prone global environment, stress testing has become especially useful. As noted in APRA’s advice to banks, insurers and superannuation funds in June 2026, entities are expected to strengthen stress-testing capabilities to prepare for severe geopolitical shocks, and technology-related risks such as cyber-attacks or AI.13
Scenario analysis is only one part of our financial stability assessment toolbox.
Scenario analysis is used together with other tools to inform our financial stability assessment. As discussed in this focus topic, scenario analysis can provide a framework for thinking through a wide range of financial stability risks. However, simple approaches can miss interaction and contagion effects, and some types of scenarios, such as operational disruptions, do not fit well in this framework. As such, we use a variety of tools to assess net financial vulnerabilities. Alongside scenario analysis, this includes continuous monitoring of a wide variety of data and vulnerabilities indicators, structural modelling, discussions with lenders through our liaison program, and regular meetings to share insights with our partners in the CFR.
We are exploring ways to capture the effects of operational shocks in our scenario analysis frameworks, such as cyber-attacks or outages at material service providers. Operational resilience has become increasingly relevant to financial stability, with a growing likelihood of operational disruptions at financial institutions and financial market infrastructures (FMIs) that can create or amplify financial stress (see 4.1 Focus Topic: Operational Risk and Financial Stability). As quantitative data on operational risk is more limited, this necessitates a different approach to scenario analysis.
Endnotes
1 See RBA (2025), ‘4.1 Focus Topic: A Conceptual Framework for Assessing Financial Stability’, Financial Stability Review, April.
2 Further work by RBA staff aims to explicitly incorporate feedback loops in our scenario analysis.
3 For more information on the GFC and the experience in Australia, see RBA (2026), ‘The Global Financial Crisis’, RBA Explainer.
4 Compared with other countries, Australia fared relatively well during the GFC, largely due to limited banking system exposure to the United States and a proactive policy response. Similarly, the impact of the COVID-19 pandemic on the Australian financial system was limited in part by large household savings buffers, generally prudent lending standards, and government support. Historically, the Australian economy has experienced many ups and downs, but data are limited and the economy is very different today. See, for example, Bullock M (2026), ‘Monetary Policy in an Era of Shocks’, Speech at the Anika Foundation Fundraising Lunch, Sydney, 28 July. For a discussion of household stress in mining-exposed regions, see RBA (2019), ‘Box B: Housing Price Falls and Negative Equity’, Financial Stability Review, April.
5 See RBA (2024), ‘4.1 Focus Topic: Scenario Analysis of the Resilience of Mortgagors and Businesses to Higher Inflation and Interest Rates’, Financial Stability Review, March; RBA (2023), ‘Box B: Scenario Analysis on Indebted Households’ Spare Cash Flows and Prepayment Buffers’, Financial Stability Review, April; Graph 2.8 in RBA (2025), ‘Chapter 2: Resilience of Households and Businesses’, Financial Stability Review, October; and RBA (2022), ‘Box D: Stress Testing and Australian Bank Resilience’, Financial Stability Review, October.
6 See section 3.5 in RBA (2026), ‘Chapter 3: Outlook’, Statement on Monetary Policy, May.
7 For more information on the Securitisation System, see RBA, ‘About the Securitisation System’. This is loan-level data that covers about one-quarter of the total mortgage market. There are known biases in the Securitisation System data, which are accounted for in the RBA’s overall assessment of resilience. For more information, see Hughes A (2024), ‘How the RBA Uses the Securitisation Dataset to Assess Financial Stability Risks from Mortgage Lending’, RBA Bulletin, July.
8 For more information on the HILDA survey, see the Melbourne Institute of Applied Economic and Social Research website. The HILDA Survey Disclaimer Notice applies to RBA content using HILDA data. The RBA’s approach to stress testing Australian households using HILDA is described in Bilston T, R Johnson and M Read (2015), ‘Stress Testing the Australian Household Sector Using the HILDA Survey’, RBA Research Discussion Paper No 2015-01.
9 An ICR of two is used as a threshold indicative of weaker debt servicing capacity and historically associated with an increased risk of insolvency. We use a slightly more conservative threshold than some other peer central banks (e.g. the Bank of England monitors an ICR threshold of 1.5 in its Financial Stability Review).
10 Generally, we consider static shocks (i.e. changes in one variable only with no effects over time) because of the lag and the noise in the broader firms’ tax data. These methods allow us to flexibly target any scenario based on businesses’ exposures.
11 The process is described further in Garvin N, S Kurian, M Major and D Norman (2022), ‘Macrofinancial Stress Testing on Australian Banks’, RBA Research Discussion Paper No 2022-03; and RBA (2022), n 5.
12 For more detail, see APRA (2026), ‘Box B: How APRA Uses Stress Testing to Reinforce Financial Resilience’, APRA System Risk Outlook, May.
13 See APRA (2026), ‘APRA Sets Out Minimum Expectations to Strengthen Industry Readiness for Geopolitical Shocks’, Media Release, 17 June; APRA (2026), ‘System Risk Stress Test’, Information Paper, June; and APRA (2020), ‘Stress Testing Assessment: Findings and Feedback’, Letter to Authorised Deposit-taking Institutions, February.