
Speech Monetary Policy in an Era of Shocks
I’d like to begin by acknowledging the Traditional Custodians of the land on which we meet and pay my respects to Elders past and present. I extend that respect to all Aboriginal and Torres Strait Islander people joining us today.
It’s a privilege to be with you again for the Anika Foundation fundraising lunch, my third year joining as Governor. The Foundation’s commitment to advancing youth mental health is making a lasting difference in the lives of young Australians and their families.
A defining and recurring feature of the global economy in recent years has been the increasing frequency and impact of supply shocks.
First, there was the shock associated with the COVID-19 pandemic. Then the Russian invasion of Ukraine led to an energy price spike.
As some of the disruptions associated with these earlier adverse shocks began to recede, new risks have emerged. The conflict in the Middle East is disrupting energy markets, severe weather events have affected production and trade around the world, and continuing trade tensions add further ambiguity.
The outlook can change quickly, and uncertainty can re-emerge even as earlier risks begin to ease.
Today, I will discuss how recent global developments are affecting Australia and place them in historical context by looking back to the oil shocks of the 1970s.
The world has been more shock-prone in recent years, but the economy is more resilient than it was in the past. The adoption of credible inflation targets by central banks – to keep inflation low and stable – has played a key role in our improved resilience.
This doesn’t mean we’re immune from adverse supply shocks. They can constrain growth, reduce real incomes and add to inflationary pressures. In this environment, our job is to keep inflation expectations anchored and make sure that shocks don’t lead to lasting increases in inflation.
With inflation and capacity pressures already elevated, recent shocks have added further to the inflation impulse.
That is why we tightened monetary policy earlier this year and why we remain focused on returning inflation sustainably to target.
How is the Australian economy faring?
Before turning to current conditions, I want to reflect on the inflation challenge we have faced in recent years.
Following a once-in-a-century pandemic, economies around the world experienced inflation outcomes that few current central bankers had encountered in their professional lives. Australia was no different. Demand and employment outcomes remained strong. Our challenge was to bring inflation down while preserving as many of the gains in the labour market as possible.
In Australia, inflation declined significantly from its peak and underlying inflation also moderated in 2024 and 2025. Our forecasts at the time suggested inflation would return sustainably to target over time. This marked important progress in restoring price stability after a period of global disruption.
Inflation has since increased and is now above target. Indeed, it was rising and above target even before the recent oil price rises. This means that we haven’t yet achieved our objective of returning inflation sustainably to target.
Higher inflation isn’t just a statistic. It strains household budgets, complicates business planning, and weighs on confidence. Many Australians are again feeling this pressure; indeed, we recently published survey evidence showing that inflation is the single most pressing economic concern for Australians.1 The Monetary Policy Board is acutely aware of the impact of this high inflation.
Let me now turn to how we’re assessing the impact of this year’s conflict in the Middle East, and the evidence so far on how the Australian economy is responding to recent increases in the cash rate.2
Five months have passed since the conflict began. While there are now some signs of the impact of the conflict on inflation and activity, recent developments in commodity markets are a reminder that conditions can change quickly and that it remains too early to assess the full economic effects.
In this environment, the outlook remains uncertain. Ongoing commodity price volatility seems likely, which makes it even more difficult to assess the ultimate effect on inflation and activity.
Likewise, because monetary policy operates with a lag, the full effects of this year’s cash rate increases are yet to be felt.
Since the outbreak of the conflict, oil prices have been highly volatile and, as recent days and weeks have demonstrated, conditions can change quickly. While the effect on fuel prices and headline inflation has so far been smaller than initially feared, headline inflation remained well above target at 4 per cent in May (Graph 1).
More importantly, underlying inflation – a better guide to the inflation impulse that abstracts from more volatile prices – has evolved broadly as we expected back in May. But it is still too high.
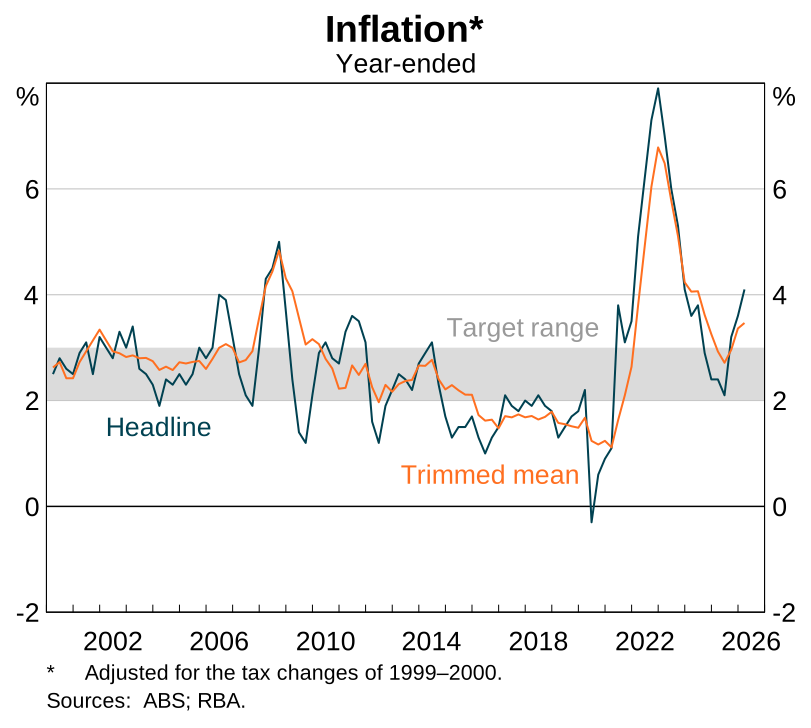
Elevated underlying inflation is consistent with ongoing capacity pressures in the domestic economy, which had re-emerged before the conflict in the Middle East. It also reflects some pass-through of earlier higher fuel costs to other prices. For instance, new dwelling inflation picked up noticeably in the May CPI data, partly reflecting higher fuel and construction costs.
We’re also hearing from our business and community liaison program that non-labour cost pressures have continued to pick up, and more firms are looking to pass these costs on.3
Demand growth appears to be moderating broadly as expected in the May baseline forecasts, helping bring aggregate demand closer into line with the economy’s supply potential. So far, there’s limited evidence of a large effect of the spike in oil prices on household spending, in part reflecting temporary policy measures such as the reduction in fuel excise.
Consumer sentiment remains very weak, though it has recovered somewhat from its trough in April. While households remain cautious, spending has been more resilient than sentiment alone might suggest.
Timely indicators, including liaison, point to moderate growth in consumption over the June quarter, broadly as expected. Household saving rates also appear to have been relatively stable.
Business confidence fell sharply at the start of the conflict but has rebounded somewhat over recent months. The decline in business conditions and capacity utilisation has been less pronounced. Business investment has been stronger than expected, largely driven by investment in data centres.
One sector of the economy that has been weaker than expected is the housing market. We had expected conditions to ease in response to the changed outlook for monetary policy and the rise in the cash rate earlier this year.
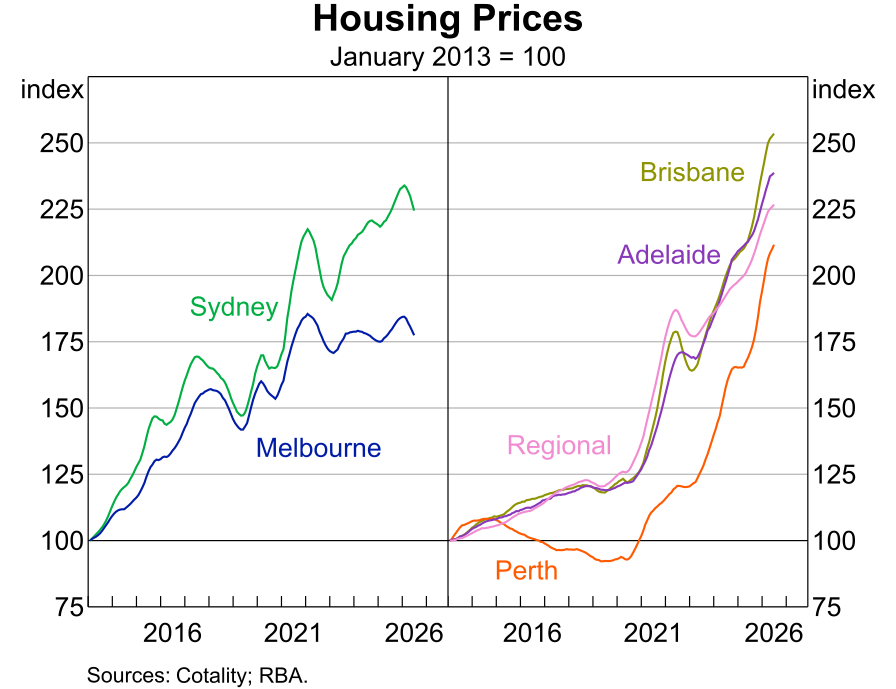
But the housing market has eased by more than we had anticipated in May. This appears to reflect a range of factors, including recent policy developments affecting the housing market, and a general softening in housing market sentiment.
Even so, the easing in established housing prices has so far been modest, following a period of strong growth. Price declines have been concentrated in the Sydney and Melbourne markets, but prices in these markets remain around where they were before interest rates started to rise in February this year (Graph 2).
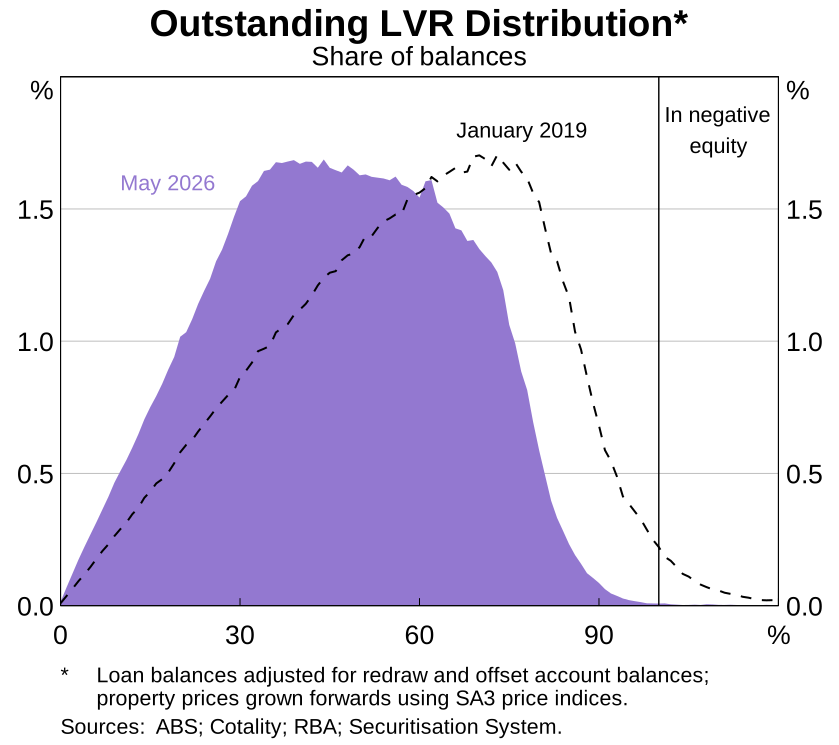
Furthermore, the most recent data suggest that, notwithstanding the price falls, negative equity remains very limited, affecting less than 1 per cent of borrowers (Graph 3).
Of that small group, our estimates suggest that only a small share of borrowers are facing severe difficulty4 with their loan repayments. This is not to downplay that this would be stressful for those affected. But it does indicate that financial stability risks are contained, and borrowers, in aggregate, have built up considerable savings buffers over recent years.
While we expect housing prices to be affected when interest rates rise, monetary policy doesn’t target housing prices. Rather, what matters for monetary policy is how changes in housing prices affect household spending, investment decisions, and, ultimately, inflation.
The labour market has also eased a bit more than expected over recent months, moving it a little closer to balance relative to its tight starting point. The unemployment rate has risen by somewhat more than expected, but other indicators, such as job advertisements, have remained more resilient. Recent intelligence from our liaison program suggests that some firms paused hiring in the early stages of the conflict, but some hiring activity seems to have resumed more recently.
Overall, we continue to assess that some further easing in labour market conditions will likely be required to bring inflation back to target.
As we prepare our updated forecasts for August, we’re considering how the key judgements and assumptions underpinning the May forecasts have evolved.5
We’re assessing how recent developments, including higher input costs and geopolitical tensions, will affect inflation. Domestic demand has eased broadly as expected and labour market conditions have softened somewhat. But with continued weak productivity growth, the economy can’t grow strongly without putting pressure on inflation. This is a fundamental challenge for the Australian economy over the next few years.
The supply side matters
To understand current circumstances better, it is useful to step back and consider how the supply side of the global economy has evolved over time.
This year’s oil supply shock has been challenging for households, businesses and the economy. But, as I noted in my opening remarks, it’s best understood as the latest in a series of adverse supply shocks affecting the global economy, beginning with the pandemic. These shocks have taken a wide range of forms and, at times, have interacted in compounding ways, amplifying their effects on inflation and economic activity.
Global supply chains – particularly during the pandemic – underscored just how interconnected and finely balanced the global economy has become. But despite the scale of the disruption, supply chains in many cases adapted more quickly than initially expected.
In earlier decades, the macroeconomic environment was shaped by a more benign supply side. During the period often referred to as the ‘Great Moderation’ from the late 1980s through to the global financial crisis, fluctuations in output and inflation were much less pronounced relative to today and to the more turbulent period that preceded it in the 1970s and early 1980s (Graph 4).6 There were still shocks in that period, but they were predominantly cyclical demand shocks that monetary policy was better equipped to deal with.
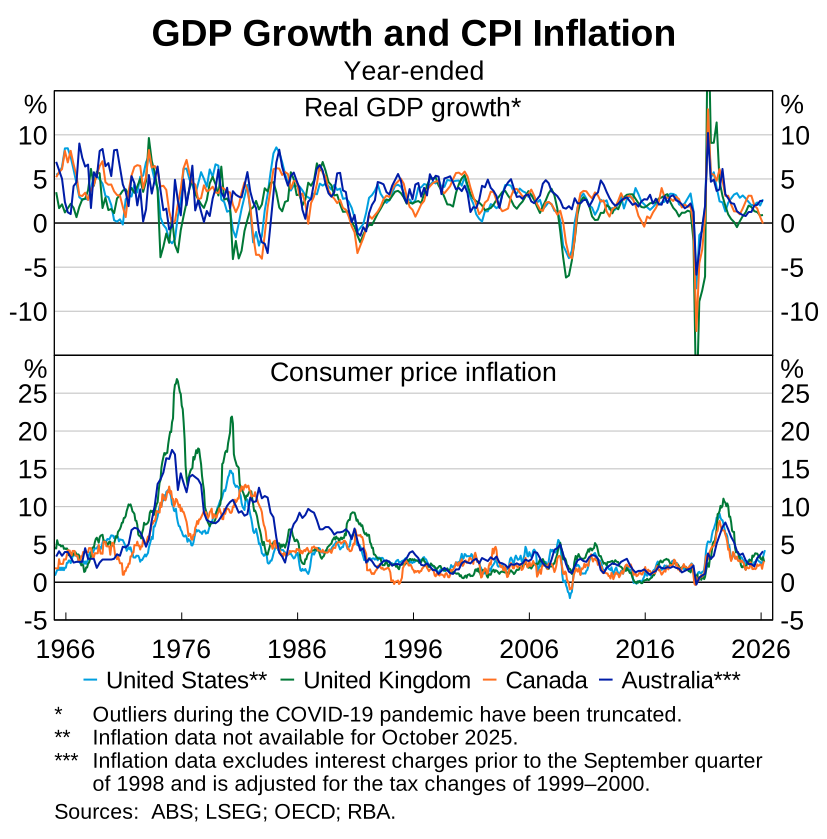
In part, this stability – compared with the 1970s and 1980s – reflected stronger policy frameworks and structural reforms that were put in place in response to earlier economic volatility. Examples include the adoption of more flexible exchange rates, labour market reforms and the introduction of inflation targets for central banks.
But there was also an element of good fortune. There were fewer severe adverse commodity price and productivity shocks during this period.7 And the emergence of the Chinese economy represented a large favourable supply shock for the rest of the world.
In that environment, monetary policy could focus primarily on managing demand, which, in turn, meant the RBA’s objectives of price stability and full employment were often complementary, rather than in tension.8
That has changed.
The pandemic, and a series of major global developments since then, have delivered a succession of adverse supply shocks.9 Collectively, these adverse shocks have constrained global growth and contributed to higher inflation at the same time.
For Australian households and most businesses, adverse supply shocks that originate overseas represent a real income loss. Prices increase, but incomes don’t adjust proportionately, which means people can’t buy as much as they could before and many households are worse off.
In Australia, these shocks have occurred against a backdrop of persistently weak productivity growth, which has weighed on real incomes and wages for many years. Reversing that is central to improving Australians’ living standards over the longer term.
Business investment is critical for boosting productivity growth and the economy’s supply capacity over time. One element of this that we’re watching closely is investment in new technologies, including artificial intelligence. Considerable uncertainty remains about the size and timing of these effects.
For monetary policymakers, the implications are significant.
When the growth of potential supply is constrained, inflation is higher for any given level of demand, sharpening the trade-off between our dual objectives of price stability and full employment.10
In a more uncertain and shock-prone world, navigating those trade-offs has become more challenging for central banks.
Then and now: Responding to supply shocks
Structural changes in the global economy, alongside stronger institutional frameworks, have made the economy much more resilient to supply shocks than in the 1970s.
Being more resilient doesn’t mean supply shocks are costless. It means the economy is better able to absorb and adjust to them.
The oil price shocks of 1973 and 1979 provide a clear point of comparison. They were highly disruptive for the global economy, including Australia, with oil prices rising two- to three-fold in each episode (Graph 5).
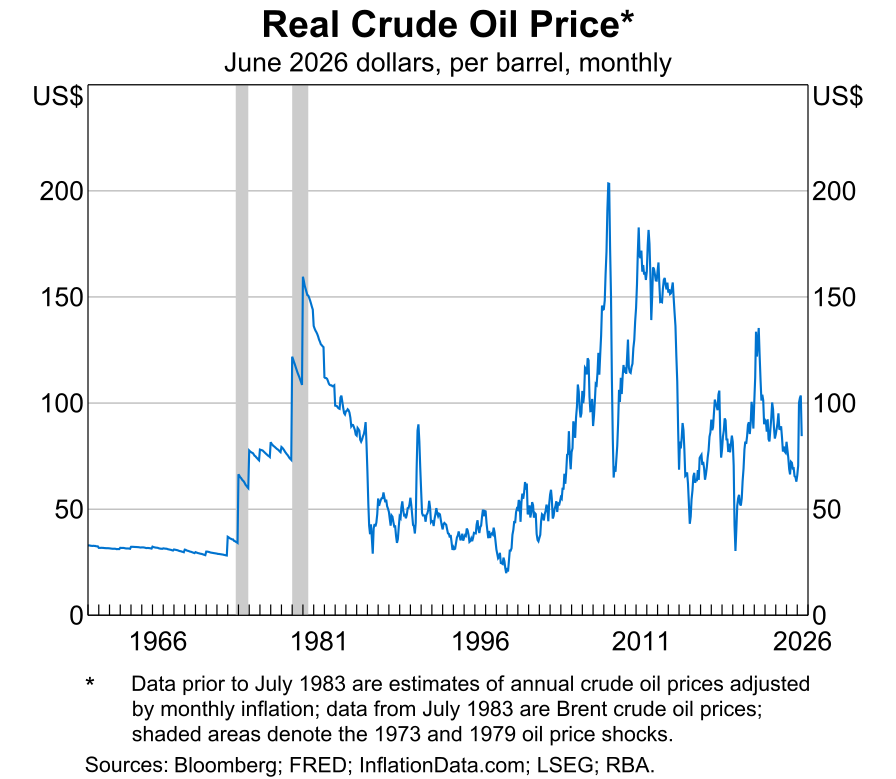
It wasn’t just the initial price spikes that made this period so difficult. It was also what followed.
In Australia – and many other advanced economies – higher costs spread through the economy. Businesses passed rising input costs into prices, while workers sought to protect their purchasing power by demanding higher wages, increasing costs for firms.11 Over time, inflation became more broadly based and persistent (Graph 6).
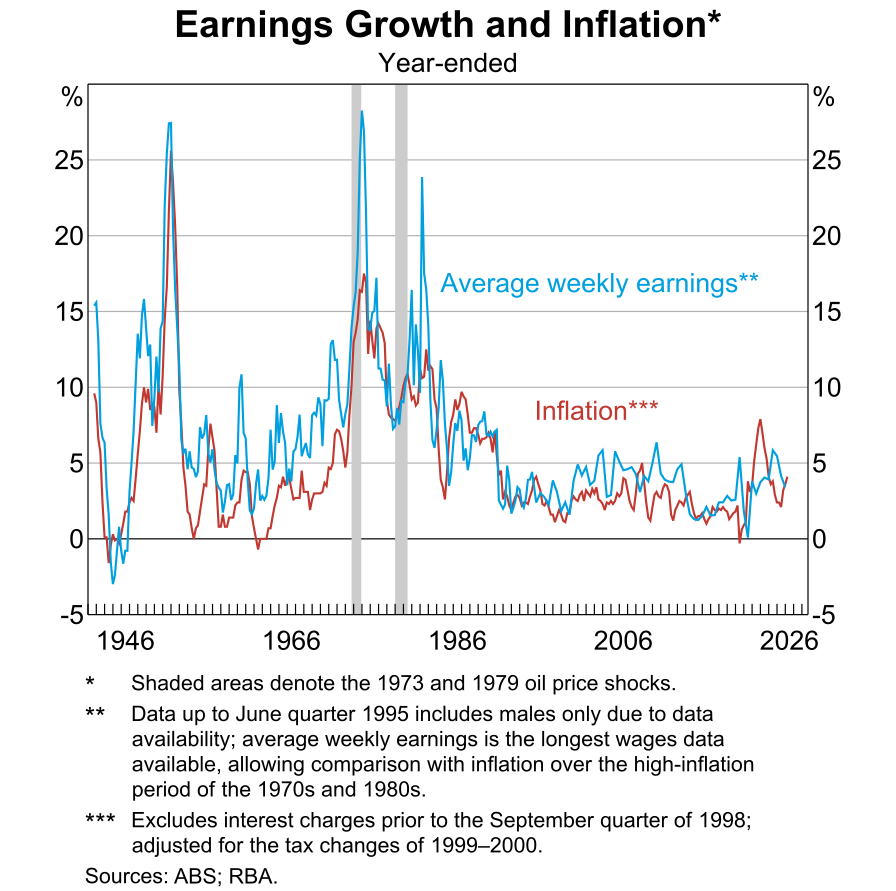
Policy responses initially sought to support activity in the face of the shock. But over time, higher inflation expectations became embedded in the decision-making of households and firms, making the problem self-perpetuating and much harder to resolve. Putting off a period of tight monetary policy today can mean higher rates and higher unemployment down the track.12
Bringing inflation and inflation expectations down ultimately required a significant tightening in monetary policy. That came at the cost of severe recessions and high unemployment in many advanced economies.
The further inflation moves from target, and the more embedded it becomes, the harder it is to reverse. Credibility is hard won and easily lost.
In Australia, inflation peaked at 12½ per cent in 1982. While it had declined to around 2½ per cent by the end of 1984, this came at the cost of a sharp rise in the unemployment rate from around 6 per cent at the turn of the decade to a peak of 10½ per cent in 1983 (Graph 7).
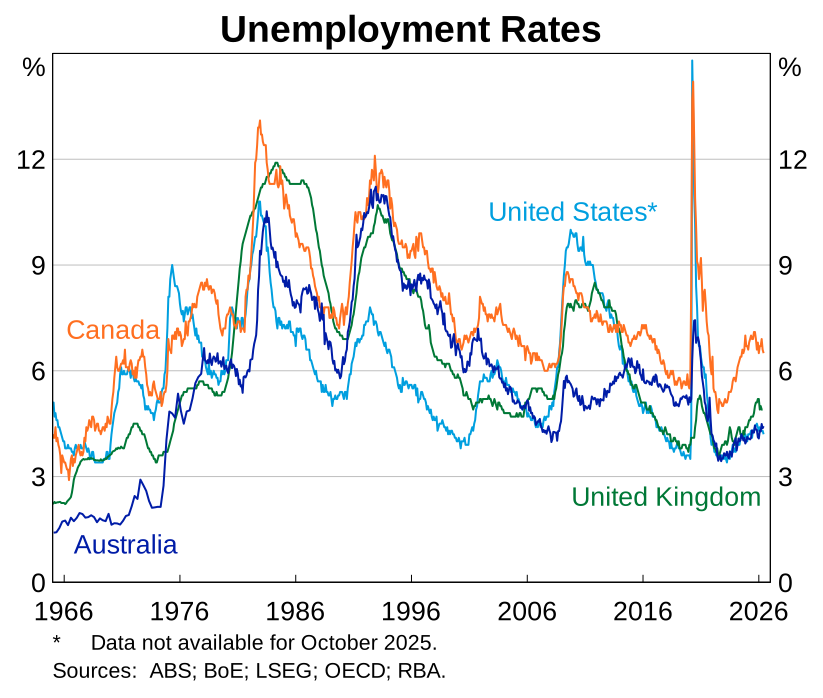
The Australian and global economies today are very different from those of the 1970s.13 This helps explain why the recent oil price shock has had a more limited impact on activity.
First, the economy is less dependent on oil.14 This means a given increase in oil prices has a less direct and less pervasive effect on inflation today than it would have in the 1970s (Graph 8).
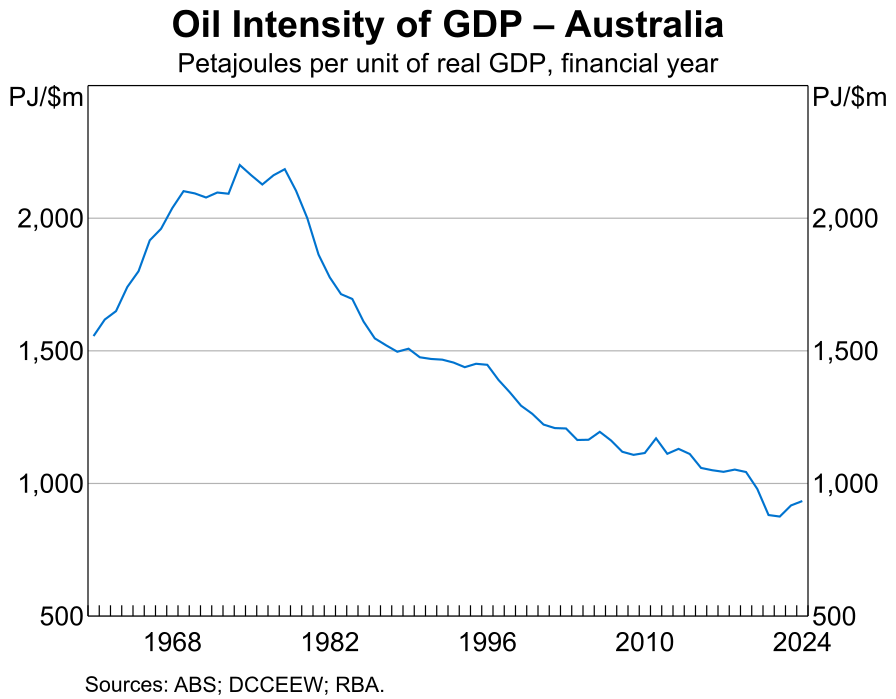
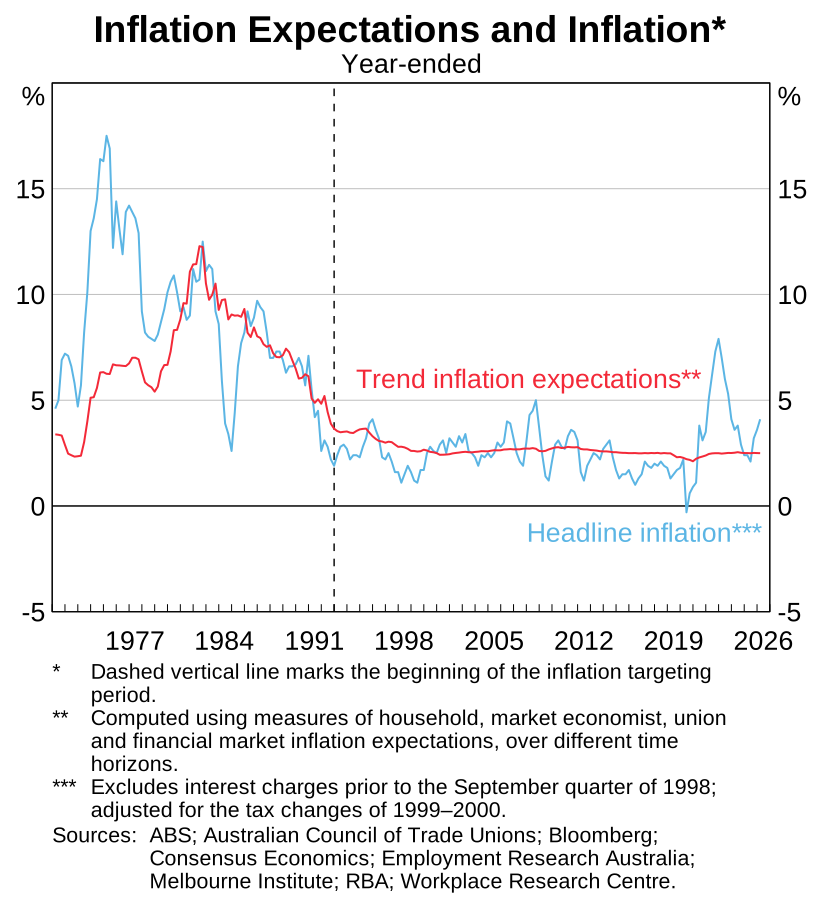
Second, monetary policy frameworks have evolved considerably – partly reflecting the lessons of the 1970s and 1980s. The widespread adoption of clear and credible central bank inflation targets has helped anchor the expectations of households and businesses, reducing the risk that temporary supply shocks translate into more persistent inflation.
And third, economies are more dynamic and interconnected. While this can transmit shocks more quickly, it also increases the ability of firms and supply chains to adapt.
While higher energy prices still place real strain on households and businesses, recent experience since the pandemic suggests that individual supply shocks are less likely, on their own, to trigger the kind of prolonged high inflation and high unemployment seen in the past.
However, the outlook becomes more complex when multiple shocks occur in quick succession and interact.
The greater frequency and diversity of supply shocks in recent years have demonstrated the value of these shock absorbers – including flexible exchange rates and more credible monetary policy frameworks, deeper financial markets, more competitive product markets, and more adaptable labour markets.
For central banks, this reinforces the importance of conducting policy in a way that maintains public confidence that inflation will remain under control (Graph 9).
Implications for monetary policy
Let me conclude with some reflections on the implications for monetary policy.
The global environment has changed and the outlook is uncertain. While this makes the task of monetary policy more complex, our objectives haven’t changed. The Board remains focused on delivering price stability and full employment.
The full effects of increases in the cash rate from earlier in the year will take time to materialise. And even if the renewed disruption to oil supply abates quickly, underlying inflation is still expected to be higher as fuel price rises flow through to other prices.
It’s also important to remember that inflation and capacity pressures in the domestic economy were already too high prior to the recent shock. There’s evidence that domestic demand and labour market conditions have been easing as required to bring the economy back towards balance.
Against a backdrop of ongoing capacity pressures, the Board remains focused on preventing elevated cost pressures from entrenching inflation.
This does mean that some further easing in the growth of demand is likely to be required if we’re to bring inflation back down sustainably to target. A key question in the period ahead is whether the tightening in monetary policy earlier in the year is sufficient to achieve this.
While conditions vary across sectors, the economy overall has adjusted gradually and broadly as expected.15
One thing monetary policy can’t do, however, is address the economy’s slow productivity growth. While this persists, the ability of the economy to grow without generating inflation is constrained, and Australians will continue to experience limited growth in real wages.
In these circumstances, the best contribution monetary policy can make is to maintain low and stable inflation and support sustainable full employment.
The Board is prepared to act as required to achieve its mandate, including by increasing the cash rate further if needed.
Endnotes
* I would like to thank Samuel Evangelinos and Michelle Wright for their excellent assistance in preparing this speech, and Sue Black, Anthony Brassil, Adam Cagliarini, Jonathan Hambur, Shan Jayawardhana, Mike Major and Faye Wang for their valuable input and comments. I would also like to thank the numerous other RBA staff for their helpful comments and suggestions.
1 Harden J, P Rickards and M Wright (2026), ‘Listening to Australians: A New RBA Survey of the Community’, Bulletin, July.
2 As usual, we’ll provide a more fulsome update of how things are playing out across the economy, and what that means for the outlook, in the August Statement on Monetary Policy, to be released on 11 August 2026.
3 We will learn more about how higher fuel prices are filtering through to other prices from the June Consumer Price Index (CPI) data released the day after this speech is delivered (29 July).
4 ‘Severe difficulty’ refers to borrowers with an estimated cash flow shortfall. This, in turn, is defined as a situation in which borrowers’ incomes are insufficient to cover both their minimum loan repayments and other essential living expenses. Estimated cash flow shortfall is based on estimates for income and essential expenses. The RBA’s Securitisation System records income when the loan is originated. To estimate current income, origination income is grown forward using the Wage Price Index. To estimate essential expenses, we use the Melbourne Institute’s Household Expenditure Measure according to Greater Capital City Statistical Areas (GCCSAs), which allows essential expenses to vary across different geographic areas.
5 RBA (2026), Statement on Monetary Policy, May.
6 Hunter S (2026), ‘Understanding Supply Shocks and Their Implications for Monetary Policy’, Address to the Australian Conference of Economists, 8 July.
7 Bernanke BS (2004), ‘The Great Moderation’, Remarks at the Meetings of the Eastern Economic Association, Washington, DC, 20 February; Stock JH and MW Watson (2002), ‘Has the Business Cycle Changed and Why?’, NBER Macroeconomics Annual, 17, pp 159–218.
8 With supply conditions broadly supportive, characterised by steady growth in productive capacity and fewer disruptions, central banks were less often confronted with situations where inflation was rising while economic activity was weakening.
9 These include the war in Ukraine, evolving trade restrictions, and conflict in the Middle East.
10 Bullock M (2025), ‘The RBA’s Dual Mandate – Inflation and Employment’, Address to the Anika Foundation Fundraising Lunch, 24 July.
11 In Australia, this period also coincided with institutional arrangements influencing wage and price outcomes, most notably the Prices and Incomes Accord, which contributed to wage setting outcomes during the disinflation process.
12 For an assessment of policy actions at that time, see Orphanides A (2003), ‘The Quest for Prosperity Without Inflation’, Journal of Monetary Economics, 50(3) pp 633–663.
13 Hewson C (2026), ‘Economics and the Public Good’, Adelaide University Joseph Fisher Public Lecture, Adelaide, 27 May; Harper I (2026), ‘Economic Conditions and the Outlook’, Speech at the Committee for Economic Development of Australia (CEDA), Melbourne, 2 June.
14 It now takes far less energy to produce a given level of output, and oil plays a smaller role in production and transport.
15 At its most recent meeting in June, the Monetary Policy Board judged that it could take time to assess the effects of earlier increases in interest rates and recent supply shocks on both inflation and demand. See RBA (2026), ‘Statement by the Monetary Policy Board: Monetary Policy Decision’, Media Release No 2026-15, 16 June.
Underlying data
You can download the underlying data file for all data that are available for public release.
Some graphs in this article were generated using Mathematica.