RBA Annual Conference – 2009 What Drives Inflation in the World? César Calderón and Klaus Schmidt-Hebbel[1]
Abstract
This paper evaluates the empirical role of non-monetary determinants of inflation in a world panel sample. We extend the previous literature by: (i) specifying a broad inflation model that encompasses existing partial models; (ii) assembling a dataset for 97 countries spanning 1975–2005; (iii) using a broad set of alternative estimation techniques; and (iv) testing the sensitivity of results to a non-linear inflation specification that allows for heterogeneity across different country groups and time periods. The findings show that, controlling for high-inflation and hyperinflation episodes, inflation-targeting (IT) regimes and fixed exchange rate regimes contribute to lower inflation. More financial openness, smaller fiscal deficits and more financial development also reduce inflation. The domestic output gap raises short-run inflation. Several of the latter effects are found to be larger in low- and middle-income economies than in high-income economies.
1. Introduction
The notion that inflation is ultimately a monetary phenomenon and that central banks are responsible for price stability is at the core of monetary economics. There is similar wide agreement about the output and welfare costs of high inflation (for example, Fischer, Sahay and Végh 2002). Why then do central banks inflate and why do many countries experience bouts of sustained high inflation? Among the answers to the latter questions found in the literature are exploitation of the short-term trade-off between unemployment and inflation, myopic bias toward short-term gains of inflation, fiscal deficit financing and alleviation of the burden of government debt. Such time-inconsistent policies are more likely to arise in countries where institutions are weak and governments prevent monetary authorities from focusing on longer-run price and output stability.[2] Here we use a broad meaning of the term ‘institutions’, encompassing the macroeconomic policy framework (regimes and policy rules), the quality of government bureaucracy and the sustainability of monetary and fiscal arrangements.
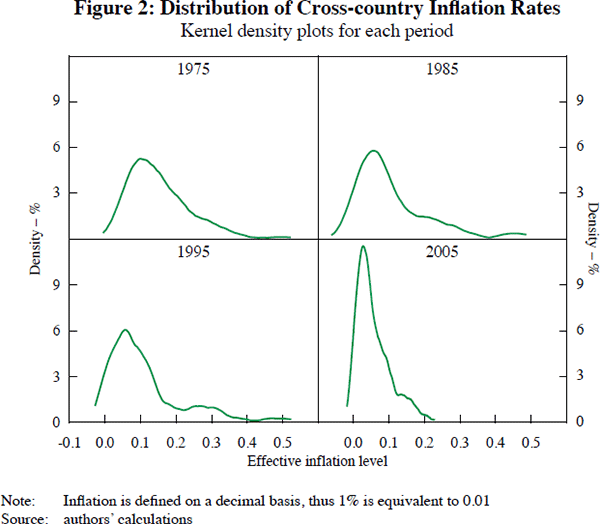
Inflation rates vary greatly across countries (and world regions) and over time, as depicted in Figure 1.[3] Yet a broad world trend is observed during the three decades spanning 1975–2005, as shown in Figures 1 and 2. Two periods are clearly apparent in the data. One is the Great Inflation period of the seventies and eighties, when industrial countries experienced abnormally persistent two-digit inflation rates and many developing countries lived through high-inflation and hyperinflation episodes. A second period of persistent disinflation – the Great Moderation[4] – started in the eighties to early nineties and led most countries to converge to one-digit inflation rates at the start of the third millennium (Summers 2005; IMF 2007).[5]
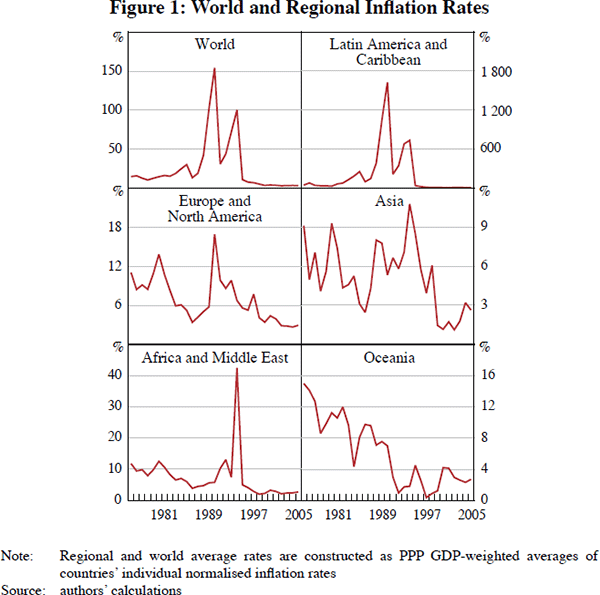
The weak institutions and loose fiscal and monetary policy regimes that were behind the Great Inflation in industrial countries (and high inflation/hyperinflation in developing countries) led to worldwide reforms of macroeconomic institutions, regimes and policy rules. Inflation stabilisation began in industrial countries, including Switzerland, Germany, Japan and the United States, in the late seventies and early eighties. Developing economies followed by adopting successful stabilisation programs in the late eighties and early nineties. As a result of the latter changes, average world inflation fell below 3.5 per cent at the end of our sample period, in 2005 (Figure 2).
The existing empirical literature that focuses on non-monetary determinants of inflation across countries is broad and diverse in its conclusions. Most studies address only a few determinants of inflation at a time and do so for a limited number of countries and/or time periods. Moreover, they rarely check for the robustness of results using alternative estimation techniques.
This paper extends the preceding literature in several dimensions. First, we consider a broad and comprehensive specification that encompasses previous partial specifications. In particular, we consider five types of explanatory variables: inflation-related variables; monetary and exchange rate regimes; measures of international openness; structural and institutional variables; and business-cycle variables. Second, we assemble a large dataset for 97 countries and 31 years (1975–2005), including both the Great Inflation and Great Moderation years. Third, we use a broad set of alternative estimation techniques, contrasting their results. Finally, we test for the robustness of our results to alternative specifications that allow for slope heterogeneity across country groups and over time.
The paper is divided into five sections. Section 2 discusses our set of potential inflation determinants classified according to the five categories of variables mentioned above, in the context of relevant literature. Section 3 introduces our inflation specification and the different econometric estimation models that we will apply for its estimation. Section 4 reports the statistical properties of the data sample and discusses our empirical results. Section 5 concludes.
2. Previous Literature and Inflation Specification
There is a large empirical literature on inflation determinants for individual countries. However, cross-country (panel data or cross-section) studies are scarce. Table 1 summarises the cross-country literature, highlighting its main findings and the fact that individual studies focus only exceptionally on more than two (out of our five) groups of potential inflation determinants.
| Variable | Author | Effect on inflation | Panel data/cross-section | Observations |
|---|---|---|---|---|
| Openness | Alfaro (2005) | (+/−) | Panel data | Imports and exports |
| Campillo and Miron (1996) | (−) | Cross-section | Trade openness | |
| Catão and Terrones (2005) | nss | Panel data | ||
| Gruben and McLeod (2004) | (−) | Panel data | Trade openness | |
| Kamin, Marazzi and Schindler (2004) | (−) | Panel data | Trade openness | |
| Romer (1993) | (−) | Panel data | Trade openness (OECD) | |
| Temple (2002) | (−) | Panel data | Trade openness | |
| Terra (1998) | (+/−) | Panel data | Trade openness (OECD) | |
| Tytell and Wei (2004) | (−) | Panel data | Financial openness | |
| Institutions | Aisen and Veiga (2006) | (−) | Panel data | Political instability |
| Cottarelli, Griffiths and Moghadam (1998) | (−) | Panel data | Transition economies | |
| Oil price inflation | Catão and Terrones (2005) | (+) | Panel data | |
| Exchange rate regime | Alfaro (2005) | (−) | Panel data | Unflexibility of exchange rate regime |
| Catão and Terrones (2005) | nss | Panel data | ||
| Cottarelli et al (1998) | (−) | Panel data | Transition economies | |
| Fiscal | Alfaro (2005) | (−) | Panel data | |
| variables | Catão and Terrones (2005) | (−) | Panel data | |
| Cottarelli et al (1998) | (−) | Cross-section | Transition economies | |
| Fischer et al (2002) | (−) | Both | Focus on hyperinflation episodes | |
|
Notes: Restricted to panel data or cross-section estimations; nss = no statistically significant effect found Source: authors' elaboration |
||||
Next, we introduce the arguments of the literature in support of our inclusion of inflation determinants in the subsequent empirical work. Our dependent variable – as opposed to most of the previous literature, which uses the simple inflation measure – is the rate of inflation for a country in its normalised form, defined as π = (ΔCPI/CPI)/(1+ ΔCPI/CPI), where ΔCPI is the change in the consumer price index. We use the normalised form for two reasons. First, it is the correct way to represent the alternative cost of holding money when using discrete-time data. Second, this measure avoids attaching excessive weight to observations of high inflation. Our set of explanatory variables is divided into five categories: inflation-related variables; monetary and exchange rate regimes; international openness measures; structural and institutional variables; and business-cycle variables.
2.1 Inflation-related variables
We include three variables in this category. We control for episodes of high inflation and hyperinflation using binary variables. Following Dornbusch and Fischer (1993), hyperinflation episodes are defined when non-normalised annual inflation exceeds 1000 per cent and high-inflation episodes are those when non-normalised annual inflation exceeds 50 per cent.[6] Fischer et al (2002) point out that there are several reasons to isolate these extreme but infrequent episodes. Hyperinflations are very costly and countries are not willing to tolerate them for more than a few years or even some months. Hence, some hyperinflation episodes may not be accounted for by annual datasets. Also, linear estimation models tend to severely overestimate the impact of inflation on macroeconomic performance when based on samples that include hyperinflations in comparison to estimations based on samples without hyperinflations.[7]
We also account for inflation inertia by including the lagged dependent variable. There are several reasons why inflation is time-dependent. First, if prices are set in a forward-looking manner under conditions of nominal rigidity, it is optimal for firms to set higher prices in advance when they rationally expect the aggregate price level to rise. Second, inflation inertia arises under conditions of indexation. This is observed when wages and prices of goods and services (most frequently, but not exclusively, prices of non-tradables like public utilities, home rents and other services) are indexed to past inflation.
2.2 Monetary and exchange rate regimes
We control for two types of monetary and exchange rate arrangements that have been the focus of previous literature. First, we construct a binary variable that takes the value of 1 for countries with an inflation-targeting (IT) regime, and 0 otherwise. IT is an operational framework for monetary policy aimed at achieving an explicit numerical target value or range for the rate of inflation. Hence, having IT in place could contribute to stabilising inflation expectations and reducing average inflation rates, compared to alternative monetary regimes. Empirical evidence on the effect of adopting an IT regime tends to show that it lowers inflation and inflation expectations and reduces its volatility (Truman 2003; Hyvonen 2004; and Vega and Winkelried 2005, among others). Ball and Sheridan (2004) present contradictory evidence, showing that IT does not make any difference for the latter variables in industrial countries. In contrast, Mishkin and Schmidt-Hebbel (2007) find that the largest benefits of inflation reduction among inflation targeters is experienced in emerging market economies and converging-to-stationary-target inflation targeters, showing that the choice of control group is the key for documenting any effect of IT on inflation. In our large dataset the control group will be comprised of the large majority of countries that have not adopted IT.
Second, we account for the effects of different exchange rate (ER) regimes on inflation performance. Evidence on the negative association between inflation and fixed ER regime pegs can be found in Cottarelli et al (1998), Husain, Mody and Rogoff (2005) and Levy-Yeyati and Sturzenegger (2005). Following the latter, we expect inflation to be lower in countries with fixed ER regimes – with the impact larger in countries with hard pegs (Levy-Yeyati and Sturzenegger 2001) – for several reasons. First, countries that adopt a pegged ER are often those which have suffered previously from high inflation and use the nominal ER as an anchor to lower inflation. Second, ER pegs operate as a disciplinary tool for monetary authorities, limiting their ability to raise the money supply at the risk of causing a balance of payments crisis. Third, fixed ER regimes also signal a commitment to lower future inflation, which may help anchor inflation expectations and thus lower actual inflation. While the latter factors may explain why many countries adopted ER pegs in the past, they are also behind the more widespread adoption of IT today, a regime that nowadays dominates the choice of ER pegs.
2.3 International openness
Borio and Filardo (2007) argue that global factors are becoming predominant in the inflation dynamics of globally integrated economies. We account for the impact of openness on domestic inflation across three different dimensions: trade openness; financial openness; and global inflation. Regarding trade openness, increased competition and integration to world markets fosters productivity growth, therefore reducing costs and domestic prices (Grossman and Helpman 1991). Romer (1993) documents that OECD countries with a more open trade regime have lower inflation. Lane (1997) argues that the mechanism that links openness to incentives to inflate does not rely on a large country terms-of-trade effect, as Romer (1993) suggested, but instead is based on imperfect competition and nominal price rigidity in the non-traded goods sector. Terra (1998) finds that the negative association between trade openness and inflation is stronger among severely indebted countries since they exhibit weak pre-commitment in their conduct of monetary policy. Another possibility is that openness induces higher competition and market flexibility, forcing local firms to reduce domestic prices (Rogoff 2003; Sbordone 2007). Several recent papers have documented a negative relation between trade openness and inflation (Temple 2002; Gruben and McLeod 2004; Borio and Filardo 2007).
Capital account openness affects inflation through different channels. First, financial integration lowers the cost of foreign financing of temporary fiscal deficits, making it less likely that governments resort to using seigniorage and creating inflation (Phelps 1973; Aizenman 1992). Second, capital account opening (and hence openness) is one component of the package of reforms that aim at macroeconomic stability, reinforcing fiscal discipline, central bank independence and sound monetary policy. Finally, capital account openness by itself exerts disciplinary effects against monetary expansion by neutralising it under fixed ER regimes or inducing currency substitution and currency depreciation under floating ER regimes. Hence financial openness, by raising the costs of inflation and enhancing monetary policy credibility, lowers inflation (Tytell and Wei 2004).
The third dimension of openness is the impact of external inflation on domestic inflation. Recent developments in the world economy have brought to the fore the likely influence of globalisation on domestic inflation (Helbling, Jaumotte and Sommer 2006). In particular, it has been argued that China and India have exported deflation by swamping world markets with low-cost manufactured goods.[8] Therefore we test for the influence of country-specific external inflation for domestic inflation.
2.4 Structural and institutional variables
Low and stable inflation can be a difficult objective for central banks because it may entail sacrificing alternative short-run objectives. Many central banks have sacrificed the goal of low and stable inflation by using expansionary monetary policies to achieve lower short-term unemployment (exploiting the short-term Phillips curve), financing public deficits (through the inflation tax) or lowering the real value of public debt. High-quality institutional arrangements would prevent such time-inconsistent policies and thus contribute to lower inflation (Cukierman 1992; Aisen and Veiga 2006). Due to the dearth of sufficient panel data on central bank independence (for example, see Cukierman, Webb and Neyapti 1992), we are not able to include this direct measure of central bank institutional strength in our specification. Instead, we include four more widely available measures of institutional and structural strength. The first is a measure of democratic accountability, which reflects the strength of governments and central banks to resist short-run populist demands, strengthening their pursuit of long-run stabilisation objectives. The second measure is a proxy for overall institutional development: per capita income.[9] The fiscal theory of inflation predicts that the weaker is the revenue system or the more excessive is public spending, the more likely is the use of seigniorage to finance public spending beyond tax revenue (Phelps 1973; Sargent and Wallace 1981; Végh 1989; Cukierman, Edwards and Tabellini 1992). To test directly for the fiscal theory of inflation, we include the ratio of the fiscal surplus to GDP in our specification. Although theoretically appealing, there has not been much empirical success supporting this theory. Most of the literature attempting to study this relation finds no significance of fiscal indicators on inflation. An exception is Catão and Terrones (2005), who report a positive association between fiscal deficits and inflation.
Our final institutional variable is financial depth, for which we use a standard measure, the ratio of domestic private sector credit to GDP. To our knowledge there is no cross-country study that tests for the possible influence of financial depth on inflation. However, financial development is likely to reduce inflation for three reasons. First, like democratic accountability and income per capita, it is a proxy for overall institutional development. Second, the more developed financial markets are, the easier it is for governments to finance temporary (and sustainable) deficits by borrowing from national residents, reducing the likelihood of inflation-tax financing. Finally, Posen (1993, 1995) has argued that opposition to inflation from the financial sector is a significant factor in reducing inflation.
2.5 Cyclical variables
When using annual data, it is important to account for cyclical variables that reflect short-term aggregate demand and supply pressures on inflation. We account for aggregate demand pressures by including measures for both the domestic and foreign output gap. In this, we follow the New Keynesian literature on the short-run Phillips curve to account for the influence of a measure of domestic economic activity (relative to productive capacity) on inflation (for example, Clark and McCracken 2006; Galí, Gertler and López-Salido 2007; Galí 2008). We add a country-specific measure of the foreign output gap to account for the possible additional effect of the world business cycle on domestic inflation. Regarding supply shocks, we include the most standard measure for the latter in the form of the cyclical component of the international oil price.
3. Specification and Econometric Approach
In this section of the paper we describe our general specification and the econometric techniques applied for estimation and robustness testing. Our general linear specification for inflation is:

where variables are defined as above: π is normalised inflation; the bold-letter matrices correspond to the five groups of inflation determinants discussed in Section 2; μ is a country-specific fixed effect; ε is a stochastic error term; and i and t are country and time sub-indices, respectively. α0 is a fixed scalar and the Bj (for j = 1, …, 5) are coefficient vectors in this linear specification.
We estimate Equation (1) using different econometric techniques. We first assume slope homogeneity across countries and estimate fixed-effects (FE) and random-effects (RE) panel data models using instrumental variables (IV) to account for likely endogeneity of explanatory variables. We instrument the lagged dependent variable, the IT regime, the fiscal surplus[10], per capita income, and the domestic output gap, using the first lag of the corresponding variable as instruments. We perform IV estimations using fixed and random effects and test the validity of the latter vis-à-vis the former.
Second, we distinguish between long- and short-term determinants of inflation dynamics. We impose slope homogeneity across countries on long-term coefficients and allow full slope heterogeneity across countries for short-term coefficients. For this purpose we use the pooled mean group (PMG) estimator proposed by Pesaran, Shin and Smith (1999).[11] We run our Equation (1) as an auto-regressive distributed lag (ARDL) model where dependent and independent variables enter the right-hand-side with lags of order p and q respectively:[12]

where X is the matrix comprised by all five matrices of inflation determinants that were introduced above and all other variables are defined as in Equation (1). The λj (j = 1, …, p) are the coefficients for the lagged dependent variable terms and the Γl (l = 0, …, q) are the coefficient vectors for contemporaneous and lagged independent variables.
As discussed by Calderón, Loayza and Servén (2003), in order to derive a long-run relationship between πi,t and Xi,t, the corresponding dynamic regression should satisfy two conditions. First, the regression residuals should be serially uncorrelated and, second, Xi,t should be strictly exogenous, that is, it should be independent of the residuals at all leads and lags. One strength of the ARDL representation is that all right-hand-side variables enter the equation with sufficiently long lags to ensure the second exogeneity condition. Another advantage of the method is that standard estimation and inference can be performed regardless of the order of integration of the variables in Xi,t and πi,t. We just need to assume that there exists a single long-run relationship and that the error vector behaves properly. Then Equation (2) can be re-parameterised using simple algebra (as shown by Pesaran et al 1999), yielding the following specification[13]:
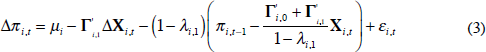
Equation (3) is the final form we use in our estimations. We will focus on the long-run relationship for which we impose coefficient homogeneity. All other coefficients on the right-hand-side of Equation (3) are allowed to vary freely across countries.
PMG estimation of long-term coefficients is performed jointly across all countries by a (concentrated) maximum likelihood procedure. Then the estimation of short-run coefficients (including the speed of adjustment, 1 – λi,1), country-specific intercepts, and country-specific error variances is performed on a country-by-country basis, also by maximum likelihood and using the estimates of the long-run coefficients obtained before.[14] We also report estimation results based on the mean group (MG) estimator, which is the average of country estimates. MG is also consistent but less efficient than the PMG estimator under the null hypothesis of long-run slope homogeneity. Finally, we engage in dynamic fixed-effects (DFE) estimation, which assumes perfect homogeneity in long-run and short-run coefficients. We discriminate between the PMG and MG models by applying a Hausman test to assess the null of long-run slope homogeneity.
At the final stage we extend our general linear specification in Equation (1) to allow for possible slope heterogeneity for different country groups and time clusters. By introducing interactions between structural inflation determinants and different country groups and time periods, we test for heterogeneity across countries and over time. Equation (1) is widened to encompass interaction matrices, as reflected in the following equation:
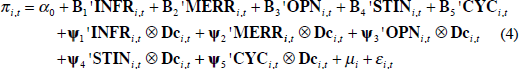
where Dc are matrices of group dummy variables that interact potentially with each of the five groups of inflation determinants, and ⊗ is the corresponding Kronecker product. The Ψ j (for j = 1, …, 5) are coefficient vectors for the non-linear interaction terms.
We use alternative measures of interactive Dc matrices that cluster observations in three different ways: two for introducing country heterogeneity and one for time-period heterogeneity. Country heterogeneity by income levels is tested, first, by separating low- and middle-income economies from high-income economies, and, alternatively, by separating low-income economies from middle- and high-income economies. Finally, we separate observations according to two different time periods to test for structural change after 1995.
4. Empirical Assessment
The data definitions, sources and transformations are described in Table A1. Descriptive statistics of our world sample are summarised in Table A2. Figure 2 depicts the cross-country kernel density plot of the distribution of actual (non-normalised) inflation rates in the world for four select years across the 1975 to 2005 sample. The value of the density function is measured on the vertical axis and actual (non-normalised) inflation is measured on the horizontal axis. The first, second and third moments of the distribution of inflation in the world were larger in the 1980s and early 1990s than after 1995. As noted above, this is consistent with the Great Moderation observed worldwide.
We report our results clustered by models and estimation techniques. Our linear model in Equation (1) is estimated for annual data by FE and RE instrumental variables (IV) estimation (results in Table 2) and by PMG, MG and DFE estimation (Table 3). Subsequently, we report results for our non-linear interaction model in Equation (4), restricting our estimation technique to FE IV[15], applied to alternative country and time dummy interactions (Tables 4–6).
| (1) | (2) | (3) | (4) | ||
|---|---|---|---|---|---|
| FE IV | RE IV | FE IV | FE IV | FE IV | |
| Inflation-related variables | |||||
| Lagged inflation | 0.160*** | −0.033 | 0.196* | 0.141 | 0.139 |
| Normalised and instrumented value | (1.97) | (0.22) | (1.87) | (1.42) | (1.39) |
| Hyperinflation | 0.348*** (9.29) |
0.488*** (6.54) |
0.357*** (8.24) |
0.363*** (8.83) |
0.364*** (8.82) |
| High inflation | 0.232*** (14.02) |
0.308*** (8.29) |
0.226*** (11.14) |
0.230*** (11.85) |
0.232*** (11.72) |
| Monetary and exchange rate regime | |||||
| Inflation targeting | −0.051*** | −0.045*** | −0.051***(a) | −0.054***(a) | −0.055***(a) |
| Lagged | (5.41) | (4.25) | (3.80) | (4.16) | (4.27) |
| Exchange rate regime | −0.029*** | −0.037*** | −0.031*** | −0.033*** | −0.033*** |
| Lagged | (7.70) | (5.97) | (6.77) | (7.70) | (7.82) |
| Openness | |||||
| Trade openness | −0.009 | −0.012** | −0.019 | −0.010 | |
| Lagged | (0.81) | (2.15) | (1.43) | (0.73) | |
| Capital openness | −0.013*** | −0.011*** | −0.013*** | −0.013*** | −0.013*** |
| Lagged | (5.94) | (4.90) | (4.79) | (5.09) | (5.06) |
| Relevant external inflation | 0.210*** | 0.412*** | 0.169** | 0.080 | 0.127 |
| Normalised | (3.11) | (4.77) | (2.10) | (0.96) | (1.57) |
| Structural and institutional variables | |||||
| Fiscal surplus | −0.204*** | −0.179*** | −0.251*** | −0.459***(a) | −0.427***(a) |
| Lagged | (5.30) | (4.46) | (5.17) | (5.15) | (5.00) |
| Income per capita | −0.040*** | 0.012*** | −0.045*** | −0.051***(a) | −0.047***(a) |
| Lagged | (3.67) | (3.09) | (3.46) | (4.06) | (4.20) |
| Domestic private credit | 0.018* | 0.059*** | 0.028** | 0.025** | 0.024** |
| Lagged | (1.87) | (4.65) | (2.37) | (2.26) | (2.29) |
| Democratic accountability | −0.002 (1.22) |
−0.003 (1.65) |
−0.002 (1.05) |
−0.002 (0.74) |
|
| Cyclical domestic and foreign variables | |||||
| Cyclical component of oil prices | 0.019** (2.01) |
0.017 (1.48) |
0.013 (1.14) |
0.026** (2.34) |
0.021** (2.05) |
| Domestic output gap | 0.238*** | 0.057 | 1.182***(a) | 0.724**(a) | 0.709**(a) |
| Lagged | (3.60) | (0.55) | (3.06) | (2.07) | (2.02) |
| Foreign output gap (weighted by GDP) |
−0.204 (0.93) |
−0.406 (1.40) |
−0.565** (2.11) |
−0.366 (1.45) |
|
| Constant | 0.467*** (4.80) |
0.086*** (3.68) |
0.504*** (4.47) |
0.557** (5.09) |
0.512*** (5.22) |
| Hausman test (RE vs FE) p-value |
0.00 | 0.00 | 0.00 | 0.00 | |
| Observations | 1,574 | 1,574 | 1,574 | 1,570 | 1,619 |
| Number of countries | 65 | 65 | 65 | 65 | 65 |
| R2 overall | 0.75 | 0.79 | 0.71 | 0.68 | 0.69 |
|
Notes: Dependent variable: normalised inflation Source: authors' calculations |
|||||
In Tables 2 and 3 we report different estimations, starting with general specifications and ending up with more parsimonious results. In Tables 4–6 we report results for only one parsimonious specification.
| FE and RE IV estimates | |||||||
|---|---|---|---|---|---|---|---|
| (1) | (2) | ||||||
| Baseline | Differential | Baseline | Differential | ||||
| Inflation-related variables | |||||||
| Lagged inflation | 0.512*** | −0.413** | 0.496*** | −0.402** | |||
| Normalised and instrumented value | (4.16) | (2.50) | (4.32) | (2.55) | |||
| Hyperinflation | 0.372*** (8.32) |
0.371*** (8.47) |
|||||
| High inflation | 0.150*** (4.15) |
−0.086** (2.06) |
0.176*** (5.27) |
0.061 (1.56) |
|||
| Monetary and exchange rate regime | |||||||
| Inflation targeting | 0.003(a) | −0.080***(a) | −0.009(a) | −0.070***(a) | |||
| Lagged | (0.17) | (3.02) | (0.54) | (2.86) | |||
| Exchange rate regime | −0.014 | −0.020 | −0.006 | −0.028** | |||
| Lagged | (1.11) | (1.45) | (0.57) | (2.33) | |||
| Openness | |||||||
| Trade openness | −0.069 | 0.068 | |||||
| Lagged | (1.27) | (1.21) | |||||
| Capital openness | −0.003 | −0.011* | −0.004 | −0.010* | |||
| Lagged | (0.51) | (1.81) | (0.71) | (1.72) | |||
| Relevant external inflation | 0.154 | −0.103 | 0.078 | 0.032 | |||
| Normalised | (0.67) | (0.42) | (0.37) | (0.14) | |||
| Structural and institutional variables | |||||||
| Fiscal surplus | −0.701***(a) | 0.207(a) | −0.435**(a) | −0.048(a) | |||
| Lagged | (3.19) | (0.85) | (2.56) | (0.24) | |||
| Income per capita | −0.002(a) | −0.050 | −0.015 | −0.033 | |||
| Lagged | (0.04) | (1.30) | (0.65) | (1.23) | |||
| Domestic private credit | 0.020 | −0.010 | 0.012 | 0.001 | |||
| Lagged | (0.98) | (0.36) | (0.68) | (0.03) | |||
| Democratic accountability | −0.011 (1.31) |
0.009 (1.01) |
|||||
| Cyclical domestic and foreign variables | |||||||
| Cyclical component of oil prices | −0.009 (0.36) |
0.042 (1.48) |
−0.010 (0.39) |
0.037 (1.28) |
|||
| Domestic output gap | 3.041***(a) | −2.586**(a) | 2.148**(a) | −1.706*(a) | |||
| Lagged | (2.74) | (2.20) | (2.54) | (1.83) | |||
| Foreign output gap (weighted by GDP) |
−0.472 (0.62) |
−0.055 (0.07) |
|||||
| Constant | 0.473*** (4.07) |
0.444*** (4.57) |
|||||
| Observations | 1,570 | 1,619 | |||||
| Number of countries | 65 | 65 | |||||
| R2 overall | 0.17 | 0.24 | |||||
|
Notes: Dependent variable: normalised inflation Source: authors' calculations |
|||||||
| FE and RE IV estimates | ||||||
|---|---|---|---|---|---|---|
| (1) | (2) | |||||
| Baseline | Differential | Baseline | Differential | |||
| Inflation-related variables | ||||||
| Lagged inflation | 0.251*** | −0.148 | 0.262*** | −0.158 | ||
| Normalised and instrumented value | (4.48) | (1.07) | (4.80) | (1.16) | ||
| Hyperinflation | 0.422*** (7.30) |
−0.071 (0.91) |
0.415*** (7.42) |
−0.063 (0.81) |
||
| High inflation | 0.194*** (12.29) |
0.049* (1.76) |
0.194*** (12.53) |
0.050* (1.79) |
||
| Monetary and exchange rate regime | ||||||
| Inflation targeting | −0.035***(a) | −0.050*(a) | −0.038***(a) | 0.048*(a) | ||
| Lagged | (2.95) | (1.70) | (3.37) | (1.73) | ||
| Exchange rate regime | −0.032*** | 0.001 | −0.031*** | −0.000 | ||
| Lagged | (6.33) | (0.07) | (6.33) | (0.07) | ||
| Openness | ||||||
| Trade openness | −0.017 | 0.014 | ||||
| Lagged | (0.87) | (0.48) | ||||
| Capital openness | −0.011*** | −0.002 | −0.011*** | −0.002 | ||
| Lagged | (3.58) | (0.48) | (3.62) | (0.45) | ||
| Relevant external inflation | 0.172 | −0.244 | 0.169 | −0.151 | ||
| Normalised | (1.34) | (1.41) | (1.37) | (0.93) | ||
| Structural and institutional variables | ||||||
| Fiscal surplus | −0.435***(a) | −0.175(a) | −0.398***(a) | −0.166(a) | ||
| Lagged | (3.70) | (0.94) | (3.71) | (0.94) | ||
| Income per capita | −0.054***(a) | 0.015(a) | −0.051***(a) | 0.016(a) | ||
| Lagged | (2.67) | (0.57) | (3.06) | (0.68) | ||
| Domestic private credit | 0.037*** | −0.043* | 0.034*** | −0.038 | ||
| Lagged | (2.68) | (1.65) | (2.67) | (1.50) | ||
| Democratic accountability | −0.003 (0.83) |
0.002 (0.42) |
||||
| Cyclical domestic and foreign variables | ||||||
| Cyclical component of oil prices | 0.013 (0.74) |
0.027 (1.17) |
0.008 (0.49) |
0.023 (1.09) |
||
| Domestic output gap | 1.275***(a) | −0.912(a) | 1.260***(a) | −0.892(a) | ||
| Lagged | (3.64) | (1.48) | (3.64) | (1.45) | ||
| Foreign output gap (weighted by GDP) |
−0.383 (0.90) |
−0.107 (0.20) |
||||
| Constant | 0.511*** (4.57) |
0.467*** (4.76) |
||||
| Observations | 1,570 | 1,619 | ||||
| Number of countries | 65 | 65 | ||||
| R2 overall | 0.51 | 0.54 | ||||
|
Notes: Dependent variable: normalised inflation Source: authors' calculations |
||||||
| FE and RE IV estimates | ||||||
|---|---|---|---|---|---|---|
| (1) | (2) | |||||
| Baseline | Differential | Baseline | Differential | |||
| Inflation-related variables | ||||||
| Lagged inflation | 0.219** | −0.305*** | 0.193** | −0.212*** | ||
| Normalised and instrumented value | (2.44) | (3.43) | (2.25) | (3.47) | ||
| Hyperinflation | 0.327*** (8.28) |
0.337*** (8.91) |
||||
| High inflation | 0.222*** (12.42) |
0.002 (0.10) |
0.229*** (12.84) |
−0.009 (0.39) |
||
| Monetary and exchange rate regime | ||||||
| Inflation targeting | −0.063(a) | −0.004(a) | −0.063*(a) | −0.004(a) | ||
| Lagged | (1.53) | (0.14) | (1.83) | (0.16) | ||
| Exchange rate regime | −0.029*** | −0.006 | −0.032*** | 0.002 | ||
| Lagged | (6.12) | (1.23) | (5.53) | (0.18) | ||
| Openness | ||||||
| Trade openness | −0.008 | 0.036 | ||||
| Lagged | (0.40) | (1.31) | ||||
| Capital openness | −0.012*** | −0.002 | −0.011*** | −0.004 | ||
| Lagged | (3.79) | (0.41) | (3.66) | (0.58) | ||
| Relevant external inflation | 0.093 | 0.190 | 0.025 | 0.344 | ||
| Normalised | (0.40) | (0.55) | (0.23) | (0.93) | ||
| Structural and institutional variables | ||||||
| Fiscal surplus | −0.316(a) | −0.509(a) | −0.326**(a) | −0.448(a) | ||
| Lagged | (1.35) | (0.78) | (2.14) | (0.96) | ||
| Income per capita | −0.073*(a) | 0.060(a) | −0.060*(a) | 0.042(a) | ||
| Lagged | (1.75) | (0.74) | (1.91) | (0.86) | ||
| Domestic private credit | 0.038 | −0.063 | 0.030 | −0.046 | ||
| Lagged | (1.47) | (0.91) | (1.72) | (0.95) | ||
| Democratic accountability | 0.009 (0.60) |
−0.017 (0.68) |
||||
| Cyclical domestic and foreign variables | ||||||
| Cyclical component of oil prices | 0.033** (2.01) |
−0.030 (1.10) |
0.035** (2.49) |
−0.019 (0.76) |
||
| Domestic output gap | 0.791**(a) | −0.208(a) | 0.728*(a) | −0.002(a) | ||
| Lagged | (2.08) | (0.29) | (1.95) | (0.00) | ||
| Foreign output gap (weighted by GDP) |
−0.179 (0.59) |
1.104 (1.25) |
||||
| Constant | 0.692*** (2.29) |
−0.418 (0.73) |
0.620*** (2.34) |
−0.348 (0.85) |
||
| Observations | 1,570 | 1,619 | ||||
| Number of countries | 65 | 65 | ||||
| R2 overall | 0.67 | 0.69 | ||||
|
Notes: Dependent variable: normalised inflation Source: authors' calculations |
||||||
4.1 FE and RE instrumental variables (IV) estimations
Table 2 reports our main results for Equation (1). Columns (1a) and (1b) report IV results for the same specification using FE IV and RE IV estimators, respectively. We perform a standard Hausman test to verify the validity of such assumptions; the results at the bottom of the table favour the FE estimator. The same tests yielding the same results are performed for the subsequent regressions reported in columns (2)–(4), where we limit reporting of results to our FE IV estimations.
To control for possible endogeneity of inflation regressors we use IV estimation, using the first lag of each instrumented variable as instruments. As an alternative to instrumenting some variables, we use directly the lagged variable instead of the instrumented contemporaneous variable.[16] Columns (2)–(4) report regression results where we gradually replace the direct use of lagged variables (instead of their contemporaneous values) by formally instrumenting contemporaneous values (using their first lags as instruments). In addition, we drop many regressors that are not significant in columns (1)–(3) from the more parsimonious specification in column (4).
Next we discuss the results presented in columns (3) and (4). We focus on the individual variables that comprise each group of inflation determinants, starting with inflation-related variables. There is weak evidence of inflation persistence, reflected by the non-significant lagged inflation term. Controlling for high-inflation and hyperinflation episodes is very important to avoid exclusion bias of coefficient estimates for all other inflation determinants. This is reflected in the large and significant coefficient values on high-inflation and hyperinflation variables. Conditional to other variables, normalised inflation is on average 23 per cent higher in periods of high inflation and 59 per cent (the sum of both high-inflation and hyperinflation coefficients) higher during hyperinflations.
Turning to monetary and ER regimes, the results show that IT is associated with significantly lower inflation rates: inflation targeters exhibit inflation that is 5–6 per cent lower than for all other country-years, including their own pre-IT past. Similarly, countries with de facto fixed ER regimes show significantly lower inflation rates, by 3 per cent. These results suggest that either IT (normally associated with a flexible ER) or de facto pegs (normally associated with the lack of a national currency or, at least, lack of an independent monetary policy) foster monetary discipline, enhance monetary policy credibility and lower inflation.[17]
Now we turn to international openness measures. Trade openness does not seem to affect inflation at standard significance levels, in contrast to the negative association found in some previous studies. However, capital account openness is significant and robust in lowering inflation, although its economic effect is very small. Relevant international inflation – that of the monetary policy reference country – exerts a positive influence on domestic inflation, although the significance of this is not robust.
Democratic accountability is one of our four structural and institutional variables that may affect inflation; but it does not. However, income per capita, our general proxy for overall economic development – which, as noted above, is highly correlated with institutional variables like democratic accountability – is associated robustly and significantly, both in statistical and economic terms, with lower inflation. A 10 per cent increase in per capita GDP reduces inflation by 0.5 per cent.
As expected, fiscal surpluses are significantly and robustly associated with lower inflation. We note that the coefficient estimated when instrumenting the fiscal surplus by its own lag (in columns (3) and (4)) is close to −0.44, roughly twice its size when replacing the contemporaneous fiscal surplus directly by its own lag (in columns (1) and (2)). Hence stronger (that is, larger) support for the fiscal theory of inflation is found by using the contemporaneous instrumented measure of the fiscal balance instead of using its lagged measure directly. Considering the latter coefficient estimate, a rise in the fiscal balance from the panel sample mean of −3.5 per cent to 0 would reduce inflation by 1.5 per cent. In contrast to our prior, our measure of financial depth – the ratio of domestic private credit to GDP – contributes positively and significantly to inflation, even though its economic significance is small.
Lastly, there is the influence of cyclical factors on inflation to consider. The domestic output gap has a significant positive influence on inflation. As in the case of the fiscal surplus, the magnitude of its coefficient estimate rises significantly when going from a regression based on its own lag (column (1)) to instrumenting it by its own lag (columns (2)–(4)). A 1 per cent rise in the domestic output gap increases domestic inflation by 0.7 per cent. In contrast, our measure of the country-specific relevant foreign output gap does not affect inflation significantly. Finally, the cyclical component of the international oil price has a positive and statistically significant effect on domestic inflation, but its economic significance is negligible.
4.2 PMG, MG and DFE estimations
Table 3 reports the results for Equation (1) using the PMG estimator (first four columns), the MG estimator (second set of four columns) and the DFE estimator (third set of four columns). The last four columns in Table 3 report the Hausman test results that assess the null hypothesis of long-run slope homogeneity. A large enough p-value would imply a failure to reject the null, in which case the PMG results would dominate the MG results.
We report four specifications – from general to particular models – for each estimation technique. Specifications under the same column are identical and hence comparable across different estimators. The regressions in columns (1) and (2) reflect our general specifications. The regression reported in column (3) shows a particular estimation dropping most non-significant variables. Column (4) differs from (3) by allowing for slope heterogeneity under PMG estimation. The Hausman test rejects slope homogeneity for the domestic output gap, implying that countries differ in the slope coefficient of their Phillips Curve. Thus the specification underlying the results reported in column (4) imposes long-run homogeneity of coefficients for all parameters in the long-run vector but not for the domestic output gap. After allowing for such heterogeneity, we can be certain that the PMG estimator is consistent.
Across our sets of regression results obtained by using the three different econometric techniques, most coefficient estimates of key inflation determinants are similar and therefore robustly estimated. Given the statistical dominance of the PMG results over those obtained by MG and DFE estimations, we focus the subsequent discussion on the former, and, in particular, on the PMG results in column (4).
The short-run behaviour of the change in inflation is significantly influenced by changes in the fiscal surplus and the domestic output gap. No other changes in variables affect short-term changes in inflation. Turning to long-run determinants of inflation, the aggregate error correction coefficient is very significant and large – close to half – justifying our focus on the long-term inflation process.
Many individual variable results are similar to those found with the FE IV estimator. In high-inflation episodes, normalised inflation is on average 30 per cent higher.[18] IT lowers inflation by 6 per cent and fixed ER regimes reduce inflation by about 4 per cent. Capital account openness reduces inflation. Yet, in contrast to our prior, trade openness has a positive and statistically significant effect on inflation, although the economic significance of this is small. The fiscal surplus lowers inflation significantly and the domestic output gap raises inflation significantly, although the size of both coefficient estimates falls well below those found under FE IV. But per capita income, private credit and the cyclical component of oil prices are not significant now.
4.3 Sensitivity analysis: FE IV estimations for non-linear interactions
We test the robustness of our linear model (Equation (1)) by introducing, in a nested way, heterogeneous country groups and time periods. We use Equation (4) that adds interactions between structural inflation determinants and different country groups and time periods. In the context of our nested regressions – see Equation (4) – point estimates for the parameters in the Ψ j' coefficient matrix that are statistically different from zero imply heterogeneity across different country groups and time periods. We test for heterogeneity, restricting our focus to the more parsimonious regression results obtained above in order to facilitate comparison across different non-linear results below as well as those of the linear models reported above. We restrict our use of estimation techniques to FE IV.
4.3.1 Heterogeneity across country groups
We test if the parameters of our inflation equation are equal between high-income economies (hereafter developed countries) and non-high income economies (hereafter developing countries), with the latter group including middle- and low-income economies. Hence the group dummy variable Dc in Equation (4) takes a value of 1 for developing countries and 0 for developed countries. These results are shown in Table 4.
We also test for heterogeneity in an alternative binary country grouping, separating between low-income economies (hereafter poor countries) and middle- and high-income economies (hereafter non-poor countries). Now Dc takes a value of 1 for poor countries and 0 otherwise. These results are shown in Table 5.
We estimate and report the nested regression of our non-linear model using the specification of our preferred results obtained in our linear model: (i) columns (3) and (4) of Table 2. In Tables 4 to 6, we present two columns for each equation: the first column – labelled as baseline – shows the parameter estimates for the Bj ' matrix, while the second column – labelled as differential – shows the estimates for the Ψ j' matrix associated with the variable in the same row. In other words, this differential column shows the incremental effect of belonging to the group for which the dummy variable is set to 1.
While the results for the non-linear model reported in Table 4 (developed versus developing countries) are not too different from those for the linear model in Table 2, some relevant differences across country groups are apparent. The results for which there are significant differences across both country groups are as follows. Inflation is significantly less persistent in developing countries, compared to developed economies. Adopting IT reduces inflation by 6–8 per cent in developing countries, while it does not lower inflation in developed countries. This is very much in line with previous findings by Mishkin and Schmidt-Hebbel (2007) for a world panel sample. The same differential effect is found for adopting a fixed ER, which lowers inflation by 2–3 per cent in developing countries and by nil in developed countries.
There is evidence that capital account openness reduces inflation in developing countries but not in developed countries. Finally, the coefficient of the output gap for developing countries is positive but significantly smaller than that of developed countries. This may suggest that the inflation effect of the output gap in developed countries is primarily determined by aggregate demand, while that of developing countries is significantly offset by more intense and/or more frequent supply shocks.
Now let's turn to the results for low-income economies and middle- and high-income economies, reported in Table 5. In contrast to the latter results for developed versus developing country groups in Table 4, we find larger heterogeneity of inflation behaviour between poor and non-poor countries (Table 5). While inflation persistence is similar in poor and non-poor countries, it has a much larger role in driving inflation in poor countries. IT contributes significantly to reduced inflation in both country groups but the contribution is much larger in poor countries (−8.5 per cent) than in non-poor countries (−4 per cent). Overall, these results suggest that IT has a large (moderate, nil) role in reducing inflation in low- (middle-, high-) income economies. Regarding the influence of a fixed ER regime, the results point toward no country heterogeneity. Finally, capital account openness has no additional effect for the poor relative to the non-poor, and the same holds true for the domestic output gap.
4.3.2 Heterogeneity over time
The final test is whether regression coefficients of the inflation equation remain constant over time. For this test the group dummy variable Dc in Equation (4) takes a value of 1 for annual observations after 1995 and 0 otherwise. Table 6 shows the results of the inflation equation that includes interaction terms between the time dummy and all explanatory variables. The surprising findings point toward uniform homogeneity across both periods, implying zero evidence of structural break in the behaviour of inflation after 1995.
5. Conclusions
In this paper we have assessed the empirical contribution of non-monetary determinants of inflation in a world panel sample. We have extended the preceding literature in four ways. First, we consider a broad and comprehensive specification of inflation that encompasses partial models found in the previous theoretical and empirical literature on inflation. Second, we assemble and use a large dataset for 97 countries spanning 31 years (1975–2005), including both the Great Inflation and the Great Moderation periods. Third, we have examined the robustness of our results to the use of a broad set of alternative estimation techniques. Finally, we have tested for the sensitivity of our findings to a non-linear inflation specification that allows for slope heterogeneity across different country groups and time periods.
Our broad inflation specification encompasses five groups of potential inflation determinants suggested by different strands of the theoretical and empirical inflation literature: inflation persistence and high-inflation as well as hyperinflation episodes; monetary and exchange rate regimes; external openness measures; structural variables and institutions; and business-cycle-related variables.
We start by summarising our main findings for variables that are robustly significant in driving inflation in the world sample. Our results show that it is essential to control for high-inflation and hyperinflation experiences in the world sample in order to avoid specification bias in identifying the role of fundamental inflation determinants. Two monetary and exchange rate regimes are shown to contribute to lower inflation: countries that adopt IT attain lower inflation rates that range from 3 to 6 per cent, in comparison to other countries in the world sample; while economies with pegged exchange rate (ER) regimes achieve 3 to 4 per cent lower inflation rates compared with economies with intermediate or flexible ER regimes. This suggests that either IT (normally associated with a flexible ER) or ER pegs are more effective than their alternatives in strengthening monetary discipline and policy credibility, a result that is consistent with the two-corner hypothesis on the choice of ER regimes.
Capital account or financial openness is found to contribute robustly to lower inflation. The fiscal theory of inflation is confirmed by our estimates, which show that raising the fiscal surplus ratio to GDP by 3.5 per cent contributes to lower inflation in the range of 0.7 to 1.5 per cent. Among cyclical variables affecting inflation in the short run, the domestic output gap contributes robustly and positively to inflation. This is consistent with the view that aggregate demand shocks drive inflation to a larger extent than supply shocks, as reflected by a conventional short-term Phillips curve. Our quantitative finding is that a 1 per cent increase in the domestic output gap raises short-term inflation by between 0.4 to 0.7 per cent.
We do not obtain robust results for other variables across different specifications, samples or econometric techniques. For economic development (proxied by per capita income) and domestic financial development (proxied by the ratio of domestic private credit to GDP), we find evidence that both reduce inflation only in some cases. We also find only weak evidence that international oil prices contribute to short-term inflation. To our surprise, we have not found support for the hypothesis that trade openness helps to reduce inflation, contradicting some of the previous literature. Democratic accountability and the relevant foreign output gap do not influence domestic inflation either.
The results for our non-linear specification – which allows for nested testing of slope heterogeneity across different country groups and time periods – are broadly in line with those from our linear model. We find that IT adoption lowers inflation in low- and middle-income economies – by between 7 to 8.5 per cent – while their contribution to inflation in high-income economies is not statistically different from zero. This finding largely confirms previous results of Mishkin and Schmidt-Hebbel (2007). Similarly, we also find that ER pegs lower inflation in low-income and middle-income economies – by between 2 to 3 per cent – while their contribution to inflation in high-income countries is nil, like that of IT. We also find some evidence that capital account openness reduces inflation in low- and middle-income economies, but not in high-income economies. Contrary to existing results in the literature, the slope of the Phillips curve (that is, the size of the domestic output coefficient) is larger in high-income than in low- and middle-income economies. Finally, our results for slope heterogeneity over time – that is, structural breaks after 1995 – show no evidence of structural change in the behaviour of inflation after 1995.
Appendix A
| Variable | Description | Source |
|---|---|---|
| Inflation rate (normalised) | CPI inflation rate/(1 + CPI inflation) | WDI |
| Inflation targeting | Dummy variable | Corbo, Landerretche and Schmidt-Hebbel (2002); Truman (2003); Mishkin and Schmidt-Hebbel (2007) |
| Exchange rate regime | Discrete variable | AREAER; Reinhart and Rogoff (2004) |
| Trade openness | (Exports + imports)/GDP | WDI |
| Capital openness | Four dummy variables reported in IMF's AREAER | Chinn and Ito (2002, 2005) |
| Relevant external inflation | Own elaboration based on Di Giovanni and Shambaugh (2007) | See Table A2 |
| Fiscal surplus | Overall government budget balance (surplus)/GDP | EIU; GFS |
| Income per capita | GDP per capita (2000 US$) | WDI |
| Domestic private credit | Domestic credit to private sector/GDP | WDI |
| Democratic accountability | International Country Risk Guide | The PRS Group |
| Oil price | Simple average of international current nominal oil prices (in US$ per barrel): UK Brent, West Texas Intermediate, Dubai | IFS |
| Domestic output gap | Cyclical component (HP-filtered) of real GDP as per cent deviation from trend | WDI |
| Foreign output gap | GDP-weighted average of foreign output gaps (excludes national output gap) | WDI |
| Notes: AREAER = Annual Report on Exchange Arrangements and Exchange
Restrictions, IMF, various issues EIU = Economist Intelligence Unit GFS = Government Finance Statistics, IMF, various issues IFS = International Financial Statistics, IMF, various issues WDI = World Development Indicators, World Bank, 2007 |
||
| Variable | Observations | Mean | Standard deviation |
Min | Max |
|---|---|---|---|---|---|
| Inflation rate (normalised) | 3,044 | 0.119 | 0.153 | −0.150 | 0.996 |
| Trade openness | 3,175 | 0.685 | 0.418 | 0.063 | 4.561 |
| Capital openness | 3,114 | 0.146 | 1.557 | −1.767 | 2.603 |
| Relevant external inflation | 3,379 | 0.041 | 0.029 | −0.001 | 0.143 |
| Fiscal surplus (% GDP) | 2,420 | −0.035 | 0.049 | −0.451 | 0.206 |
| Income per capita (in logs) | 3,243 | 8.510 | 1.157 | 6.130 | 10.889 |
| Domestic private credit | 3,152 | 0.630 | 5.242 | 0.000 | 152.318 |
| Democratic accountability | 3,119 | 3.708 | 1.647 | 0.000 | 6.000 |
| Cyclical component of oil prices | 3,379 | −0.004 | 0.166 | −0.384 | 0.296 |
| Domestic output gap | 3,243 | 0.000 | 0.028 | −0.368 | 0.270 |
| Foreign output gap (GDP-weighted average) |
3,379 | −0.001 | 0.008 | −0.021 | 0.017 |
|
Source: authors' calculations |
|||||
Footnotes
César Calderón: The World Bank, 1818 H St. NW, Washington, DC 20433;
Klaus Schmidt-Hebbel: Catholic University of Chile, Santiago, Chile.
We thank Mauricio Calani for outstanding research assistance.
Klaus Schmidt-Hebbel gratefully acknowledges financial support provided by
Fondecyt research project No 1060175. We thank Simon Price for excellent
comments, as well as participants for their useful comments provided at a
seminar at Oxford University, a workshop at the University of Münster,
and the 2009 Conference of the Reserve Bank of Australia and the Centre for
Applied Macroeconomic Analysis, Australian National University,
in Sydney.
[1]
The question about the welfare preference between long- and short-term objectives of monetary policy and time inconsistency has been widely debated in the literature, starting with Kydland and Prescott (1977) and Barro and Gordon (1983). [2]
As discussed in Section 2, inflation is measured and represented here and throughout the paper in its normalised form. [3]
Strictly speaking, the term Great Moderation refers to the decline in the volatility of inflation and output. Coined by James Stock, it was first documented by Blanchard and Simon (2001) and subsequently analysed by many authors, including Bernanke (2004), Summers (2005) and IMF (2007). In this paper we use it in the more narrow sense of a period of significant decline in inflation levels, which is highly correlated to the reduction in inflation volatility. [4]
Our sample covers only through to 2005, therefore excluding the large swings in world inflation observed in the recent past, from higher inflation during the 2006–2008 commodity price boom to very low inflation during the 2008–2009 global financial crisis and recession. [5]
Cagan (1956) defined hyperinflation episodes as beginning in the month when monthly inflation first exceeds 50 per cent and ending in the month before monthly inflation declines below 50 per cent for at least one year. Note that a (non-normalised) monthly inflation rate of 50 per cent is equivalent to a (non-normalised) annual inflation rate of 12,875 per cent. [6]
In our sample, hyperinflation episodes have occurred in Argentina, Bolivia, Brazil, Bulgaria, Croatia, the Democratic Republic of Congo, Nicaragua and Peru. [7]
Ball (2006) has counter-argued that China and India's increased exports change relative prices but not long-run world inflation. Furthermore, at least part of the latter effect would be offset by higher imports of China and India due to their income gains, again causing changes in world relative prices. [8]
Dollar and Kraay (2003) report that cross-country differences in institutions are highly correlated to differences in per capita GDP levels. [9]
If nominal interest rate payments of public debt are contingent on inflation, the fiscal surplus is correlated with the residual term εi,t. [10]
As discussed in Section 3, one must choose between different assumptions when deciding which econometric technique to use. On the one hand one can fully neglect slope heterogeneity by using FE panel models or one can accept complete heterogeneity by estimating any model on a country-by-country basis. The latter approach, however, takes no advantage of the richness of a panel dataset. Thus the choice among these estimators faces a general trade-off between consistency and efficiency. Estimators that impose homogeneity dominate heterogeneous estimators in terms of efficiency but are inconsistent if the null hypothesis of slope homogeneity is not true (Pesaran et al 1999). In between such extreme choices is the PMG estimator which assumes that there exists heterogeneity in short-run dynamics but homogeneity in long-run dynamics. [11]
For a detailed discussion of this estimator and its asymptotic properties see Pesaran et al (1999). Here we provide only a summary discussion of its application to our model. [12]
Assuming a general ARDL p = q = 1. [13]
We also allow for time-specific effects in the estimated regression in order to obtain independence of residuals across countries and, therefore, to ensure consistency of our PMG estimates. This is attained by defining each variable as a deviation with respect to the cross-section mean. [14]
We choose not to apply the PMG estimator to the non-linear model due to the small (yet largest available) size of our sample. This estimator requires large N and large T, as well as a semi-balanced panel, to be asymptotically consistent (see Pesaran et al 1999 for a detailed discussion). These two requirements, combined with the large specification of the non-linear model and the constraints imposed by the grouping dummies, result in the dropping of several countries and the consequent possibility of bias. [15]
For example, lagged inflation is instrumented across all five columns by using its own lag (the second lag of inflation) as its instrument. In contrast, for the IT variable we replace it by its lagged value in columns (1a) and (1b), while instrumenting it by using its lagged value as a formal instrument in columns (2)–(4). [16]
Note that the simple correlation between IT and a pegged ER is −0.15 and significant at the 1 per cent level in our panel sample (Table 2). Notwithstanding the expected negative correlation, its size is low – it differs significantly from −1.0. This reflects the fact that most countries in our sample with non-pegged (that is, intermediate and floating) ER regimes have in place monetary regimes other than IT. [17]
Note that our specification does not match exactly the one used in the FE and RE IV models. Here we were forced to drop the hyperinflation dummy variable due to our sample properties. The ARDL estimator requires a panel that features a large T and a large N, in contrast to FE or RE that require a moderate T. For the ARDL estimator T should be large enough for every variable, which is not the case for our few hyperinflation episodes. [18]
References
Aisen A and FJ Veiga (2006), ‘Does Political Instability Lead to Higher Inflation? A Panel Data Analysis’, Journal of Money, Credit and Banking, 38(5), pp 1379–1389.
Aizenman J (1992), ‘Competitive Externalities and the Optimal Seigniorage’, Journal of Money, Credit and Banking, 24(1), pp 61–71.
Alfaro L (2005), ‘Inflation, Openness, and Exchange-Rate Regimes: The Quest for Short-Term Commitment’, Journal of Development Economics, 77(1), pp 229–249.
Ball LM (2006), ‘Has Globalization Changed Inflation?’, NBER Working Paper No 12687.
Ball LM and N Sheridan (2004), ‘Does Inflation Targeting Matter?’, in BS Bernanke and M Woodford (eds), The Inflation-Targeting Debate, University of Chicago Press, Chicago, pp 249–282.
Barro RJ and DB Gordon (1983), ‘Rules, Discretion and Reputation in a Model of Monetary Policy’, Journal of Monetary Economics, 12(1), pp 101–121.
Bernanke BS (2004), ‘The Great Moderation’, Remarks at the meetings of the Eastern Economic Association, Washington DC, 20 February. Available at <http://www.federalreserve.gov/boarddocs/speeches/2004/20040220/default.htm>.
Blanchard O and J Simon (2001), ‘The Long and Large Decline in U.S. Output Volatility’, Brookings Papers on Economic Activity, 1, pp 135–174.
Borio C and A Filardo (2007), ‘Globalisation and Inflation: New Cross-Country Evidence on the Global Determinants of Domestic Inflation’, BIS Working Paper No 227.
Cagan P (1956), ‘The Monetary Dynamics of Hyperinflation’, in M Friedman (ed), Studies in The Quantity Theory of Money, Chicago University Press, Chicago, pp 25–117.
Calderón CA, N Loayza and L Servén (2003), ‘Do Capital Flows Respond to Risk and Return?’, World Bank Policy Research Working Paper No 3059.
Campillo M and JA Miron (1996), ‘Why Does Inflation Differ across Countries?’, NBER Working Paper No 5540.
Catão LAV and ME Terrones (2005), ‘Fiscal Deficits and Inflation’, Journal of Monetary Economics, 52(3), pp 529–554.
Chinn MD and H Ito (2002), ‘Capital Account Liberalization, Institutions and Financial Development: Cross Country Evidence’, NBER Working Paper No 8967.
Chinn MD and H Ito (2005), ‘What Matters for Financial Development? Capital Controls, Institutions, and Interactions’, La Follette School Working Paper No 2005-007.
Clark TE and MW McCracken (2006), ‘The Predictive Content of the Output Gap for Inflation: Resolving In-Sample and Out-of-Sample Evidence’, Journal of Money, Credit and Banking, 38(5), pp 1127–1148.
Corbo V, O Landerretche and K Schmidt-Hebbel (2002), ‘Does Inflation Targeting Make a Difference?’, in N Loayza and R Soto (eds), Inflation Targeting: Design, Performance, Challenges, Central Bank of Chile, Santiago, pp 221–269.
Cottarelli C, M Griffiths and R Moghadam (1998), ‘The Nonmonetary Determinants of Inflation: A Panel Data Study’, IMF Working Paper No 98/23.
Cukierman A (1992), Central Bank Strategy, Credibility, and Independence: Theory and Evidence, MIT Press, Cambridge.
Cukierman A, S Edwards and G Tabellini (1992), ‘Seigniorage and Political Instability’, American Economic Review, 82(3), pp 537–555.
Cukierman A, SB Webb and B Neyapti (1992), ‘Measuring the Independence of Central Banks and Its Effect on Policy Outcomes’, World Bank Economic Review, 6(3), pp 353–398.
Di Giovanni J and JC Shambaugh (2007), ‘The Impact of Foreign Interest Rates on the Economy: The Role of the Exchange Rate Regime’, NBER Working Paper No 13467.
Dollar D and A Kraay (2003), ‘Institutions, Trade, and Growth: Revisiting the Evidence’, World Bank Policy Research Working Paper No 3004.
Dornbusch R and S Fischer (1993), ‘Moderate Inflation’, World Bank Economic Review, 7(1), pp 1–44.
Fischer S, R Sahay and CA Végh (2002), ‘Modern Hyper- and High Inflations’, Journal of Economic Literature, 40(3), pp 837–880.
Galí J (2008), Monetary Policy, Inflation, and the Business Cycle: An Introduction to the New Keynesian Framework, Princeton University Press, Princeton.
Galí J, M Gertler and JD López-Salido (2007), ‘Markups, Gaps, and the Welfare Costs of Business Fluctuations’, The Review of Economics and Statistics, 89(1), p 44–59.
Grossman GM and E Helpman (1991), ‘Trade, Knowledge Spillovers, and Growth’, NBER Working Paper No 3485.
Gruben WC and D McLeod (2004), ‘The Openness-Inflation Puzzle Revisited’, Applied Economic Letters, 11(8), pp 465–468.
Helbling T, F Jaumotte and M Sommer (2006), ‘How Has Globalization Affected Inflation?’, World Economic Outlook – Globalization and Inflation, World Economic and Financial Surveys, IMF, Washington DC, pp 97–134.
Husain AM, A Mody and KS Rogoff (2005), ‘Exchange Rate Durability and Performance in Developing versus Advanced Economies’, Journal of Monetary Economics, 52(1), pp 35–64.
Hyvonen M (2004), ‘Inflation Convergence across Countries’, RBA Research Discussion Paper No 2004-04.
IMF (International Monetary Fund) (2007), World Economic Outlook – Globalization and Inequality, World Economic and Financial Surveys, IMF, Washington DC.
Kamin S, M Marazzi and JW Schindler (2004), ‘Is China “Exporting Deflation”?’, Board of Governors of the Federal Reserve System International Finance Discussion Paper No 791.
Kydland FE and EC Prescott (1977), ‘Rules rather than Discretion: The Inconsistency of Optimal Plans’, Journal of Political Economy, 85(3), pp 473–491.
Lane PR (1997), ‘Inflation in Open Economies’, Journal of International Economics, 42(3–4), pp 327–347.
Levy-Yeyati E and F Sturzenegger (2005), ‘Classifying Exchange Rate Regimes: Deeds vs. Words’, European Economic Review, 49(6), pp 1603–1635.
Mishkin FS and K Schmidt-Hebbel (2007), ‘Does Inflation Targeting Make a Difference?’, in FS Mishkin and K Schmidt-Hebbel (eds), Monetary Policy under Inflation Targeting, Central Bank of Chile, Santiago, pp 291–372.
Pesaran MH, Y Shin and RP Smith (1999), ‘Pooled Mean Group Estimation of Dynamic Heterogeneous Panels’, Journal of the American Statistical Association, 94(446), pp 621–634.
Phelps E (1973), ‘Inflation in the Theory of Public Finance’, Swedish Journal of Economics, 75(1), pp 67–82.
Posen AS (1993), ‘Why Central Bank Independence Does Not Cause Low Inflation: The Politics behind the Institutional Fix’, manuscript, Harvard University.
Posen AS (1995), ‘Declarations Are Not Enough: Financial Sector Sources of Central Bank Independence’, in BS Bernanke and JJ Rotemberg (eds), NBER Macroeconomics Annual 1995, 10, MIT Press, Cambridge, pp 253–274.
Reinhart CM and KS Rogoff (2004), ‘The Modern History of Exchange Rate Arrangements: A Reinterpretation’, Quarterly Journal of Economics, 119(1), pp 1–48.
Rogoff KS (2003), ‘Disinflation: An Unsung Benefit of Globalization?’, Finance and Development, 40(4), pp 54–55.
Romer D (1993), ‘Openness and Inflation: Theory and Evidence’, The Quarterly Journal of Economics, 108(4), pp 869–903.
Sargent TJ and N Wallace (1981), ‘Some Unpleasant Monetarist Arithmetic’, Federal Reserve Bank of Minneapolis Quarterly Review, 5(3), pp 1–17.
Sbordone AM (2007), ‘Globalization and Inflation Dynamics: The Impact of Increased Competition’, NBER Working Paper No 13556.
Summers PM (2005), ‘What Caused the Great Moderation? Some Cross-Country Evidence’, Federal Reserve Bank of Kansas City Economic Review, 90(3), pp 5–32.
Temple J (2002), ‘Openness, Inflation, and the Phillips Curve: A Puzzle’, Journal of Money, Credit and Banking, 34(2), pp 450–468.
Terra CT (1998), ‘Openness and Inflation: A New Assessment’, The Quarterly Journal of Economics, 113(2), pp 641–648.
Truman EM (2003), Inflation Targeting in the World Economy, Institute for International Economics, Washington DC.
Tytell I and S-J Wei (2004), ‘Does Financial Globalization Induce Better Macroeconomic Policies?’, IMF Working Paper No 04/84.
Vega M and D Winkelried (2005), ‘Inflation Targeting and Inflation Behavior: A Successful Story?’, International Journal of Central Banking, 1(3), pp 153–175.
Végh CA (1989), ‘Government Spending and Inflationary Finance: A Public Finance Approach’, IMF Staff Papers, 36(3), pp 657–677.