RBA Annual Conference – 2009 Discussion
1. Don Harding
These comments are presented in two parts. The first relates to some general issues that arose with the treatment of relative prices in the papers at the conference – the bulk of my discussion at the conference related to this topic. The second part of my comments relates to the revised draft of the paper by Adam Cagliarini and Warwick McKibbin.
Relative prices
My sense is that the conference papers never really came to grips with the issue of how to define relative prices and what are their main features. In these comments I briefly set out the issues that arise in defining relative prices, suggest a useful measure and then summarise some key features of relative commodity prices.
All of the papers at the conference defined relative prices as

where Pit is the price of the ith commodity in period t, with Pit ≥ 0. The alternative is to define relative prices via a price simplex, let pit to be the ith element of the price simplex then
The key feature of the pit is that they are bounded below by 0 and above by 1. Thus we are guaranteed that all moments of (p1t, …, pIt) exist for all data-generating processes for the nominal price vector (P1t, …, PIt), something that is not true of (q1t, …, qIt). This means that one can use moments to summarise the features of (p1t, …, pIt), something that we cannot be assured is valid when summarising the features of (q1t, …, qIt).
A second important difference between Definitions (1) and (2) is that the former depends on the choice of numerator while the latter does not. This means that summary statistics built on Definition (1) will depend on the choice of numerator.
The price simplex for the commodity price data used in the paper by Jeffrey Frankel and Andrew Rose is shown in Figure 1.
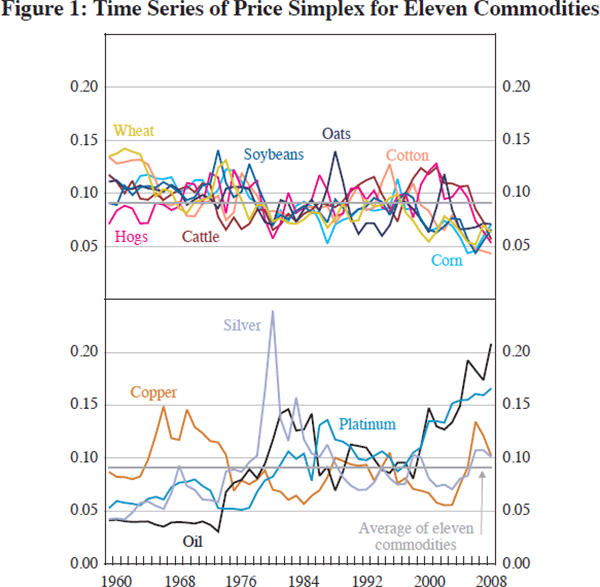
The most dramatic feature evident in Figure 1 is the cornering of the silver market by the Hunt brothers around 1980. The next most dramatic feature is the rise of platinum and oil prices in the past decade. The figure also makes clear the point that not all relative prices can rise – some must fall. Indeed, when correctly defined, the average relative price, by definition, is 1/11. This figure should make it clear that the conference should have focused on the variance of relative prices rather than the relative price changes themselves.
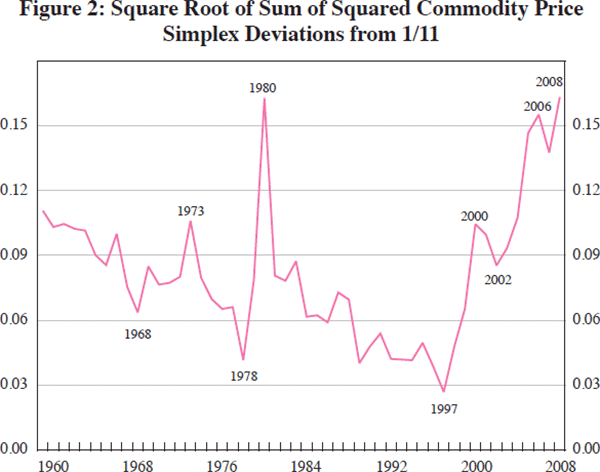
Figure 2 shows the overall variability of relative prices as measured by the sum of the squared deviations for the commodity prices contained in Figure 1. As can be seen from this figure, leaving aside the Hunt episode around 1980, there was a trend decline in volatility of relative prices until 1997. However, since that date there has been a marked increase in the volatility of relative prices. It is these features of the data (and their implications for inflation, if any) that I would argue should have been the centre piece of the conference.
In my discussion at the conference, I presented material showing the correlations between various groups of prices in the simplex, and discussed the usefulness of those statistics in summarising features of the data and in testing how well models capture those features of the data. I also provided a decomposition of the variability of the GDP simplex. These items have been removed from this written discussion for reasons of space.
Specific comments on global relative price shocks: the role of macroeconomic policies
The paper by Adam and Warwick uses G-Cubed, a multi-sector and multi-country general equilibrium model, to study the capacity of shocks to productivity, risk premia and United States monetary policy to explain the large movements of relative prices between 2002 and 2008. They find that productivity shocks provide some of the explanation for the large relative price movements, but the other two shocks only provide limited and temporary explanations.
One of their main findings is that taken together these three shocks cannot provide a complete explanation of the movement in relative prices. They conclude that this suggests that ‘… other driving forces could also be responsible, including those outside of the model’ (p 305). This finding should not be a surprise as there have been large shifts in patterns of world production and expenditure and, if these countries differ in the intensity with which they use various commodities, then one would expect these shifts to have big implications for relative commodity prices.
To provide some evidence on this hypothesis I constructed a simplex of world real GDP and then calculated the variability of that simplex in exactly the same way as I calculated the variability of relative commodity prices. The two series are shown in Figure 3.
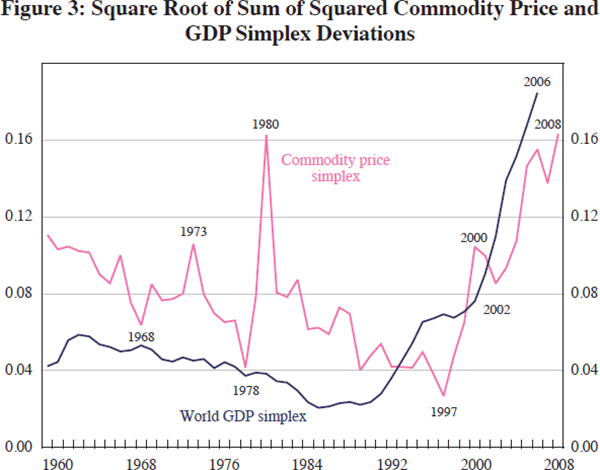
Figure 3 clearly establishes that that there is a strong correlation between the variability of real GDP and the variability of relative prices in the commodity sector. This suggests that shifts in the pattern of world production and expenditure may be associated with the increased variability of relative prices.
It is not clear from the paper whether G-Cubed can explain the shifts in the patterns of world production and expenditure and capture the links between these shifts and relative price movements. Thus, while the exercise is of some value, one is left with considerable uncertainty about how much weight can be placed on the conclusions.
2. General Discussion
The initial discussion developed around the consequences of a positive productivity shock in China. One participant pointed out that over the past decade, China's exports had risen relative to GDP, but the opposite was true of consumption. This is contrary to the idea that consumption should rise at least as fast as output in response to a permanent improvement in productivity. Another participant raised the possibility that this was not an anomaly since excess labour in the rural sector was keeping wages in the urban sector low, implying that the benefits of rising productivity were accruing to firms as profits, which are in turn being reinvested. Adam Cagliarini responded by noting that wages in the model could be made very sticky in China to help generate such a result.
The debate then turned to the behaviour of China's current account. Over recent years, as China experienced significant productivity gains without corresponding rises in Chinese consumption, savings flowed out of China. By contrast, the model in the paper implies a net inflow of capital to China. Warwick McKibbin agreed with these observations and said that they would consider the issue in future iterations of their paper.
In response to large relative price movements, participants suggested that the paper implied that monetary policy should tolerate deviations of inflation from target and stabilise prices around the new relative price level. In line with the earlier discussion of Lutz Kilian's paper, one participant suggested that a central bank should instead allow other prices to move in an offsetting manner in order to hit a price-level target. However, it was argued by another participant that this was not optimal if these other prices were relatively inflexible. Yet another participant thought that the optimal policy response will depend on whether shocks were revealed over a relatively short period or more gradually over a long period (in which case even inflexible prices would have time to adjust).
The remainder of the discussion focused on clarification of the structure of the model and the underlying assumptions. A participant questioned the frequency of price adjustments in the model, and also asked whether the model was consistent with the observed quantities of commodities traded. In response, Warwick McKibbin noted that the model is Keynesian, in that it incorporates sticky wages, but not New Keynesian, because it does not include sticky prices. Prices adjust annually to clear the market; how prices adjust depends on the flexibility of wages in the production of those commodities. Relating this to the policy implications of the research, Adam Cagliarini noted that central banks may target the prices of the sectors which are labour intensive in production, in an environment of sticky prices. Finally, in response to a question about the modelling strategy, Warwick McKibbin noted that the model used in the paper does not forecast well, rather it was intended to provide insights into the consequences of marginal changes over time compared to a baseline case.