RDP 2026-01: Shock-percentile Restrictions for SVARs 3. Challenges with Eliciting Bounds on Shocks
March 2026
Imposing a shock-magnitude restriction requires specifying the numeric bound, k, in (5) above. While narrative information may suggest that a shock was large in a specific episode, it is difficult to use this information to formulate a numeric bound on the shock. If we knew that the structural shocks were Gaussian, then restricting a shock to exceed, say, three standard deviations in size could be interpreted as imposing the belief that the period contained a shock with magnitude that is expected to occur with low probability. However, at this point, the SVAR framework considered here makes no parametric distributional assumption about the shocks. It is therefore not obvious whether a shock exceeding three standard deviations is a low-probability event before observing the data and identifying the structural shocks.
Instead, LMN propose a procedure for eliciting bounds on shock magnitudes that uses the observed data and its estimated covariance structure (i.e. the VAR's reduced-form parameters) as inputs. An important additional ingredient in this procedure is an algorithm that is used to simulate values of Q. Section 3.1 describes this algorithm. Section 3.2 then argues that the arbitrary nature of the algorithm in this setting casts doubt on the credibility of the resulting shock-magnitude restrictions. Section 3.3 argues that the procedure would also be problematic if viewed from a Bayesian perspective.
3.1 The RWZ algorithm
A key ingredient in the simulation-based procedure used to elicit the shock-magnitude bounds is an algorithm used to obtain random draws of Q. The algorithm, based on Rubio-Ramírez et al (2010), involves the following steps:
- Draw an n × n matrix of independent standard normal random variables Z.
- Compute the QR decomposition Z = QR, where R is upper-triangular with non-negative diagonal elements.
- Normalise the columns of Q to satisfy
The resulting draws of Q are uniformly distributed over the unconstrained identified set .
3.2 The bound elicitation procedure
In illustrating the procedure proposed by LMN to elicit bounds on shock magnitudes, it is useful to introduce their empirical setting. They use a three-variable SVAR to examine the relationship between real activity and measures of macroeconomic and financial uncertainty in the United States.
Let yt = (Mt, Yt, Ft)′ with corresponding structural shocks is the measure of macroeconomic uncertainty constructed in Jurado, Ludvigson and Ng (2015). This measure averages the square root of conditional forecast error variances of one-step-ahead forecasts across a large panel of macroeconomic data, where the conditional variances are estimated using stochastic volatility models. Underlying this measure is the idea that macroeconomic uncertainty is higher when macroeconomic variables are more difficult to predict. Yt is the log of industrial production, which is a measure of real activity. Ft is a measure of financial uncertainty constructed in the same way as Mt, but based on a large set of financial indicators. The VAR is monthly and contains six lags and a constant. The reduced-form parameters are estimated via ordinary least squares (OLS) over a sample running from July 1960 to April 2015.[11]
LMN use the RWZ algorithm to obtain 1.5 million draws of Q from . Each draw implies a path for the structural shocks, Computing the sequence of shocks at each draw of Q builds up a shock distribution in each period. To motivate their shock-magnitude restrictions, LMN examine these shock distributions. Figure 1 plots the distributions of the ‘financial uncertainty shock’ in September 2008 (the Lehman failure) and October 1987 (the Black Monday episode). In both episodes, the distribution of the shock is right skewed with positive values more likely than negative values.
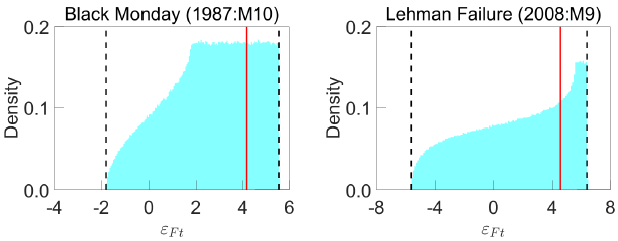
Notes: Distributions of financial uncertainty shocks implied by RWZ algorithm when imposing sign normalisation on impact impulse responses. Solid lines are 75th percentiles; dashed lines are bounds of identified sets.
LMN interpret these results as suggesting that ‘the covariance structure of the data alone provides overwhelming evidence of a large positive financial uncertainty shock in the months of the 1987 crash and the 2008 Lehman collapse’. A similar exercise for the macroeconomic uncertainty shock points to large positive macroeconomic uncertainty shocks in September 2008 (the Lehman episode) and December 1970 (leading up to the collapse of the Bretton Woods system of fixed exchange rates). LMN subsequently formulate shock-magnitude restrictions in these periods, where the bounds (k) are elicited based on these shock distributions. For instance, one exercise in LMN sets lower bounds equal to the 75th percentiles of the shock distributions. To give a specific example, the financial uncertainty shock in the Black Monday episode is restricted to exceed the 75th percentile of the shock distribution in that period, which is around 4.2 standard deviations; that is, the shock-magnitude restriction is for t = 1987:M10.
This procedure has been used by several papers that employ shock-magnitude restrictions (see the references in footnote 1). However, given the sign normalisation, the structural parameters are set identified and any Q in is observationally equivalent. The distribution for Q induced by the RWZ (or any other) algorithm is therefore arbitrary in this setting (e.g. Fry and Pagan 2011; Baumeister and Hamilton 2015, 2024). In turn, the shock distributions induced by the distribution for Q are also arbitrary. Ultimately, this casts doubt on the credibility of shock-magnitude restrictions when the bounds are elicited via this procedure.
To support the claim that the induced shock distribution is arbitrary, I examine unconstrained identified sets for the uncertainty shocks in each month:[12]
These unconstrained identified sets characterise the information about the structural shocks contained in the data, given the sign normalisation. Figure 2 plots the identified sets for the uncertainty shocks in each period. It is apparent that the identified sets for the shocks always span zero, so – given the sign normalisation only – the data and its covariance structure never unambiguously imply whether a positive or negative shock has occurred, much less whether the shock was relatively large or small. At best, we may be able to rule out certain features of the shocks; for example, the identified set for the financial uncertainty shock in the Black Monday episode has a lower bound of around –2 (see Figure 1), so the data are inconsistent with a very large negative financial uncertainty shock in this period. Otherwise, the features of the shock distributions used to elicit the shock-magnitude restrictions depend on the algorithm used to draw Q. If we used a different algorithm, we could obtain a very different distribution.
The unconstrained identified sets for the two uncertainty shocks include zero in every period and the data are largely uninformative about the magnitudes of the shocks. A natural question is whether this result is specific to the current application – for example, does it depend on features of the reduced-form parameters? Appendix A.1 shows that, in a general n-variable SVAR, unconstrained identified sets for structural shocks include zero at all possible values of the reduced-form parameters and for any realisation of the data. So the indeterminacy of the shock signs is not peculiar to the current application. Appendix A.2 uses a simple example to illustrate how different algorithms for randomly generating parameters could in principle generate very different shock distributions.
3.3 Can the procedure be motivated from a Bayesian perspective?
In the Bayesian setting, the RWZ algorithm is often used to draw from the posterior distribution under a uniform prior for Q.[13] A Bayesian analogue of the bound-elicitation procedure would be to: 1) specify a prior for and a uniform prior over ; 2) use the posterior for the structural shocks to elicit bounds (e.g. by taking a specified percentile of the posterior distributions of the shocks in selected periods); and 3) use these bounds to impose shock-magnitude restrictions in another SVAR.
There are two main problems with this procedure. First, the obtained bounds may be sensitive to the choice of prior assumed in the first step; since Q is set identified, the conditional prior for Q given is not updated by the likelihood (e.g. Poirier 1998; Moon and Schorfheide 2012). To the extent that the uniform prior does not accurately reflect the researcher's beliefs, this sensitivity is problematic. Second, even if the uniform prior for Q is a good representation of the researcher's subjective beliefs, it is not obvious how one could justify dogmatic identifying restrictions on the basis of the induced posterior over the structural shocks; the posterior merely tells us that some shock values are more or less likely than others, whereas a shock-magnitude restriction dogmatically rules out some shock values. In summary, even with a well-defined subjective (uniform) prior for Q, a Bayesian analogue of the bound-elicitation procedure would generate shock-magnitude restrictions that lack credibility.
Footnotes
Angelini et al (2019) consider the same model, but identify shocks by exploiting breaks in the volatility of macroeconomic variables. [11]
These identified sets can be characterised by their end points. depends on Q only via qj. The unconstrained identified set for qj is given by the intersection of the unit sphere in and the half-space , which is path-connected. Since is a continuous function of qj on a path-connected domain, the set of function values on this domain is an interval. This argument follows the same reasoning as in Giacomini and Kitagawa (2021a, 2021b), who provide conditions for convexity of impulse-response identified sets. I approximate these sets by taking the minimum and maximum of over the 1.5 million draws of Q from . [12]
While there has been debate about the desirability of using such a prior, it nevertheless remains a well-defined prior distribution. For different sides of this debate, see Baumeister and Hamilton (2018, 2019, 2024), Watson (2020), Arias et al (2025) and Inoue and Kilian (2025, 2026). [13]