RDP 2026-01: Shock-percentile Restrictions for SVARs Appendix B: Monte Carlo Exercises
March 2026
This appendix details how the Monte Carlo exercises in Section 4.2 are implemented and describes the additional exercises that are referred to in the main text.
B.1 Implementation details
In each Monte Carlo replication, the identified set for under the baseline sign restrictions is computed analytically.[39] Under the shock-percentile restriction, the identified set is approximated using draws of Q from the uniform distribution over , obtained via the RWZ algorithm. At each draw of Q, I compute the implied value of , then approximate the identified set by the minimum and maximum values of over the draws.[40] Montiel Olea and Nesbit (2021) provide results about the number of draws required to guarantee a given degree of approximation error. Their Theorem 3 provides an upper bound on the number of draws L from within the identified set required to guarantee that a misclassification error less than occurs with probability at least . The upper bound is where d is the dimension of the parameter region being approximated. Setting d = 1 (since is scalar) and yields an upper bound for L of around 1,060. I therefore approximate using 1,060 draws of Q in each Monte Carlo replication.
Because numerical approximation introduces error, the identified set obtained under the shock-percentile restriction can appear strictly smaller than under the baseline sign restrictions even when the shock-percentile restriction is not actually binding. When computing the share of Monte Carlo replications in which the shock-percentile restriction contributes no additional identifying information, I account for this approximation error by reporting the share of replications where the two identified sets differ in length by no more than 1 per cent.
B.2 Additional exercises
The Monte Carlo exercise in Section 4.2 assumes a DGP where vec(H) = (1, −0.3, 0.2, 1.2)′, which implies that pt and qt are weakly negatively correlated. Under this DGP, the shock-percentile restrictions often (sometimes substantially) sharpen identification. If the correlation were stronger, the identified set would be shorter under the baseline sign restrictions and the shock-percentile restrictions would tend to sharpen identification by less.
To illustrate this, I repeat the Monte Carlo exercise with an alternative DGP that yields tighter identification under the baseline. More specifically, the DGP now assumes that vec(H) = (6, −1.8, 0.2, 1.2)′. Relative to the original DGP, these parameter values imply that the supply shock plays a much more important role in driving variation in pt and qt, inducing a stronger negative correlation between the two variables. Consequently, the identified set under the baseline sign restrictions is about 60 per cent shorter than the identified set under the original DGP.[41]
The left panel of Figure B1 plots the Monte Carlo distribution of the length of the identified set under this alternative DGP. Under the weaker shock-percentile restriction , the identified set is only about 0.1 per cent shorter, on average, than under the baseline sign restrictions, and the shock-percentile restriction is binding in only about 0.1 per cent of Monte Carlo replications. Even the stronger shock-percentile restriction only reduces the length of the identified set by about 1 per cent on average and does not sharpen identification at all in around 94 per cent of replications. Overall, the shock-percentile restrictions tend to be less informative than under the original DGP; they bind less frequently and, conditional on binding, tend to sharpen identification by less.
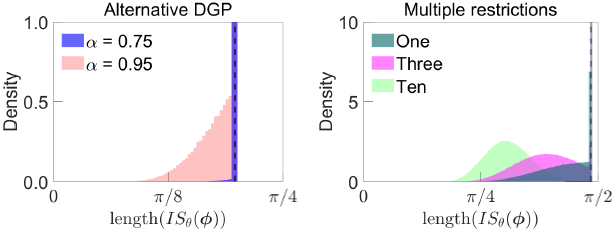
Notes: Monte Carlo distribution of length of identified set under combination of baseline and shock-percentile restrictions, where each Monte Carlo replication represents different realisation from DGP. Left panel assumes alternative DGP with sharper identification under baseline sign restrictions; right panel assumes original DGP and imposes multiple shock-percentile restrictions with Dashed line represents length of identified set under sign restrictions only. y-axes truncated for readability.
The Monte Carlo exercises in Section 4.2 and above impose only a single shock-percentile restriction. Imposing multiple restrictions – as in the empirical application in Section 5 – should tend to sharpen identification further. To illustrate this, I return to the original DGP considered in Section 4.2 and consider imposing multiple ‘weak’ shock-percentile restrictions with . I consider imposing one, three or ten shock-percentile restrictions. In each exercise, the restrictions are imposed in the periods corresponding to the largest positive realisations of ; that is, the shock-percentile restrictions take the form
where is the rth largest order statistic of the shock sequence In the cases considered,
The right panel of Figure B1 plots the Monte Carlo distribution of the length of the identified set for each set of restrictions. It is apparent that adding additional shock-percentile restrictions can substantially sharpen identification; the Monte Carlo distribution of the length of the identified set shifts to the left as more shock-percentile restrictions are added. With three shock-percentile restrictions, the length of the identified set is 18 per cent shorter, on average, than under the baseline sign restrictions (compared with 7 per cent when there is one restriction). Under ten restrictions the length of the identified set is 36 per cent shorter, on average, than under the baseline sign restrictions.
Footnotes
For a characterisation of the identified set under these restrictions, see Baumeister and Hamilton (2015) or Read (2024). [39]
Draws of Q are transformed into draws of via where [40]
It is well-known that the strength of the correlation between price and quantity innovations influences the sharpness of identification in this model of supply and demand. For example, see Uhlig (2017) or Read (2024). [41]