RDP 2025-08: Ageing and Economic Growth in China Appendix A: China Data and Regressions
November 2025
A.1 Geographic variation
The following maps illustrate the log differences in old-age ratio by province. Figure A1 shows the data for the 1990s, Figure A2 for the 2000s and Figure A3 for the 2010s.
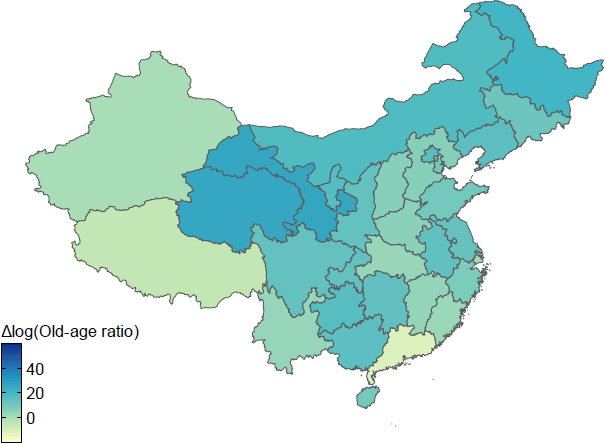
Sources: Author's calculations; CEIC Data; National Bureau of Statistics of China.
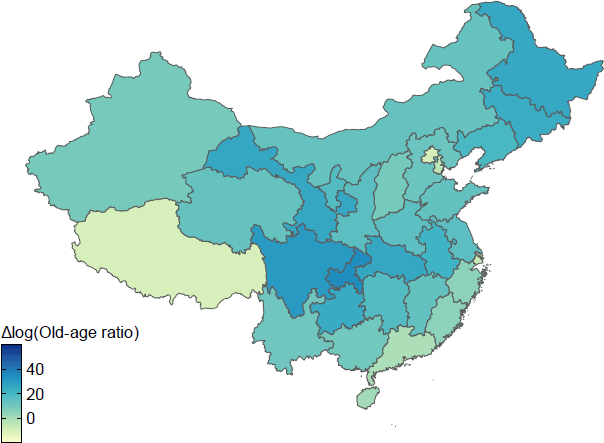
Sources: Author's calculations; CEIC Data; National Bureau of Statistics of China.
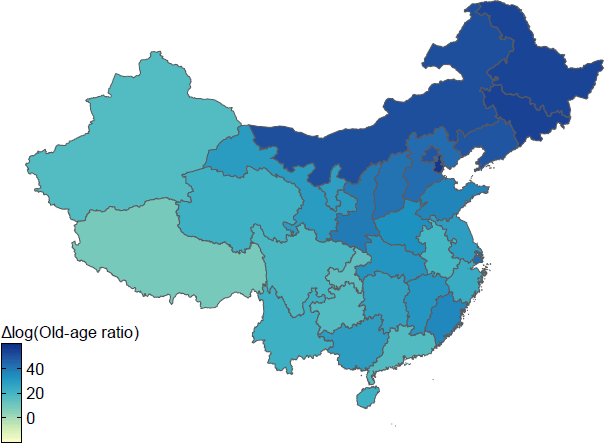
Sources: Author's calculations; CEIC Data; National Bureau of Statistics of China.
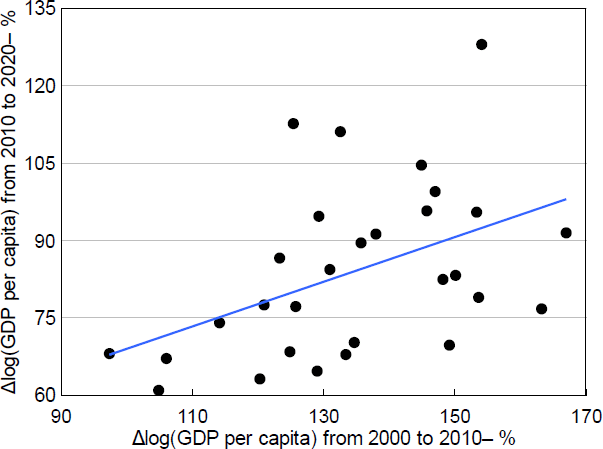
A.2 Intertemporal growth correlations
As discussed in Section 2, the correlation between provincial growth over the 1990s and over the 2000s is negative. However, for the 2000s and 2010s, this correlation is positive.
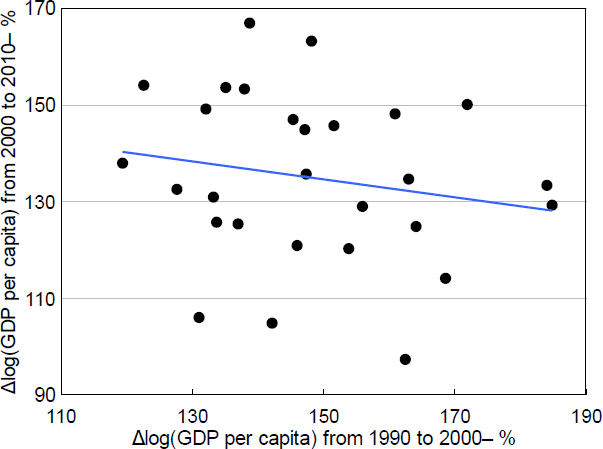
Note: Line of best fit shown.
Sources: Author's calculations; CEIC Data; National Bureau of Statistics of China.
Note: Line of best fit shown.
Sources: Author's calculations; CEIC Data; National Bureau of Statistics of China.
A.3 Full regression results
The first-stage regression summary statistics for the main specification are shown in Table A1.
| R-squared | Adjusted R-squared | Robust F (1,27) | Prob > F | |
|---|---|---|---|---|
| log(old-age ratio) | 0.7675 | 0.7493 | 70.6168 | 0.0000 |
|
Note: F-statistic adjusted for 28 clusters of provinces. |
||||
The full table for the regressions described in Tables 2 and 3 is shown in Table A2.
| OLS | Instrumental variables | ||||||
|---|---|---|---|---|---|---|---|
| 20-year lag | 20-year lag | 20-year lag | 20-year lag | 30-year lag | 40-year lag | ||
| log(old-age ratio) | −0.270 (0.181) |
−0.716*** (0.210) |
−0.899*** (0.202) |
−0.569** (0.287) |
−0.868*** (0.199) |
−0.615*** (0.182) |
−0.806*** (0.180) |
| Controls | |||||||
| Year | |||||||
| 2000 | 0.017 (0.059) |
0.651 (0.074) |
−0.114** (0.057) |
−0.120** (0.056) |
−0.101 (0.240) |
||
| 2010 | −0.427*** (0.073) |
−0.337*** (0.074) |
−0.427*** (0.068) |
−0.506*** (0.092) |
−0.889*** (0.177) |
−0.382*** (0.053) |
|
| Industry | |||||||
| Agriculture | 0.159 (0.121) |
||||||
| Mining | −0.027 (0.021) |
||||||
| Manufacturing | 0.198*** (0.065) |
||||||
| Industry#Year | |||||||
| Agriculture#2000 | 0.206* (0.111) |
||||||
| Agriculture#2010 | −0.167 (0.122) |
||||||
| Mining#2000 | 0.043 (0.043) |
||||||
| Mining#2010 | 0.044 (0.033) |
||||||
| Manufacturing#2000 | −0.143* (0.075) |
||||||
| Manufacturing#2010 | −0.254*** (0.070) |
||||||
| Coastal | |||||||
| Coastal | 0.229*** (0.049) |
0.207*** (0.047) |
−0.158** (0.074) |
−0.130*** (0.041) |
|||
| Coastal#2000 | −0.363*** (0.079) |
−0.372*** (0.084) |
|||||
| Coastal#2010 | −0.382*** (0.068) |
−0.340*** (0.063) |
0.022 (0.075) |
||||
| Province fixed effects | N | N | N | Y | N | N | N |
| Constant | 1.416*** (0.027) |
1.468*** (0.032) |
1.567*** (0.036) |
1.634*** (0.034) |
1.969*** (0.144) |
1.482*** (0.058) |
1.160*** (0.077) |
| Observations: clusters | 84: 28 | 84: 28 | 84: 28 | 84: 28 | 84: 28 | 58: 30 | 28: 28 |
| Notes: ***, ** and * denote statistical significance at the 1, 5 and 10 per cent levels, respectively. Standard errors are in parentheses and clustered at a provincial level. | |||||||
Running the main specification of the instrumental variable regression individually for each decade shows that the coefficient on ageing is large and negative for the 2000s and 2010s, and smaller for the 1990s (Table A3). The sample size when running the regression using individual decades is relatively small.
| Decade | Effect of GDP per capita growth |
|---|---|
| 1990s | −0.053 (0.785) |
| 2000s | −0.768 (0.693) |
| 2010s | −0.895*** (0.171) |
|
Notes: ***, ** and * denote statistical significance at the 1, 5 and 10 per cent levels, respectively. Standard errors are in parentheses and clustered at a provincial level. |
|
The full table for the regression described in Table 4 is shown in Table A4.
| 20-year lag | |
|---|---|
| log(old-age ratio) | −3.710*** (0.985) |
| Controls | |
| Year | |
| 2000 | 0.036 (0.062) |
| 2010 | −0.306*** (0.079) |
| Coastal | |
| Coastal | 0.226*** (0.046) |
| Coastal#2000 | −0.376*** (0.083) |
| Coastal#2010 | −0.336*** (0.067) |
| Constant | 1.439*** (0.029) |
| Observations: clusters | 84: 28 |
|
Notes: ***, ** and * denote statistical significance at the 1, 5 and 10 per cent levels, respectively. Standard errors are in parentheses and clustered at a provincial level. |
|