RDP 2013-10: Stochastic Terms of Trade Volatility in Small Open Economies Appendix D: Terms of Trade Processes – GARCH Estimation
August 2013 – ISSN 1320-7229 (Print), ISSN 1448-5109 (Online)
- Download the Paper 1.06MB
To examine the robustness of our assumption about the functional form of the empirical terms of trade process, we also estimated exponential generalised autoregressive conditional heteroskedasticity (EGARCH) models of the form:


The EGARCH model differs from our baseline stochastic volatility model in two respects. First, in the EGARCH model the equation for the volatility of the terms of trade shocks does not include an error term. Instead, increases in volatility can only occur because of large shocks to the terms of trade. In particular, if the parameter α > 0, the model implies that a deviation of ut−1 from its expected value causes the variance of shocks to the volatility of the terms of trade to be larger than otherwise. The second difference is that we allow positive and negative shocks to have an asymmetric effect on volatility. If β = 0 then a positive shock to the terms of trade has the same effect on volatility as a negative shock. In contrast, if β > 0 then a positive surprise increases volatility by more than a negative surprise.
The model was estimated assuming a Student-t distribution for the errors of the terms of trade.[17] We estimated this model using maximum likelihood methods without imposing any priors on the parameter values. Thus, this exercise also provides a check on the restrictiveness of the priors in the Bayesian estimation of the baseline stochastic volatility model. Table D1 shows the result of this estimation.
| Australia | Brazil | Canada | Mexico | New Zealand | South Africa | |
|---|---|---|---|---|---|---|
| ρq | 0.94*** | 0.96*** | 0.91*** | 0.91*** | 0.92*** | 0.81*** |
| (0.02) | (0.02) | (0.03) | (0.02) | (0.02) | (0.05) | |
| σq | −3.20*** | −3.08*** | −4.00*** | −3.05*** | −3.50*** | −3.18*** |
| (0.51) | (0.28) | (0.32) | (0.28) | (0.17) | (0.20) | |
| ρσ | 0.95*** | 0.92*** | 0.81*** | 0.65*** | 0.93*** | 0.96*** |
| (0.04) | (0.06) | (0.17) | (0.17) | (0.05) | (0.04) | |
| α | 0.39*** | 0.35** | 0.33** | 0.77** | 0.41*** | 0.19** |
| (0.14) | (0.14) | (0.16) | (0.27) | (0.14) | (0.10) | |
| β | 0.03 | 0.08 | 0.08 | 0.09 | 0.03 | 0.06 |
| (0.07) | (0.09) | (0.09) | (0.16) | (0.06) | (0.07) | |
| Notes: *, ** and *** denote significance from zero at the 10, 5 and 1 per cent levels, respectively; standard errors are in parentheses | ||||||
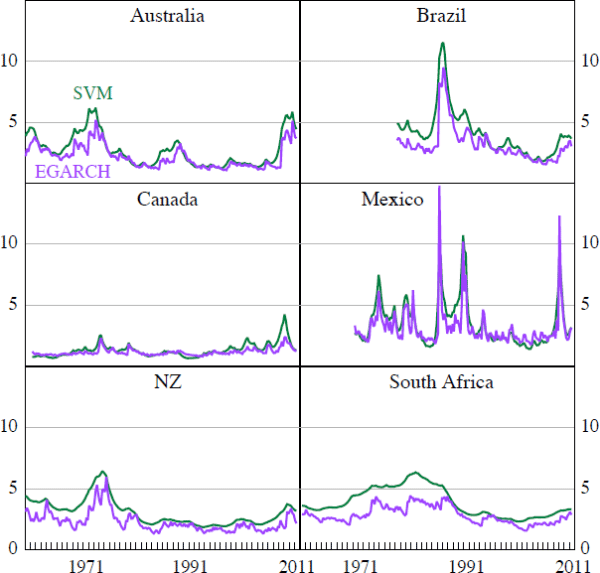
Pleasingly, the persistence of the terms of trade and volatility processes, as well as the estimated mean volatility from the EGARCH estimation, are similar to those produced in our baseline stochastic volatility model. The results also indicate that positive and negative shocks to the terms of trade appear to have a symmetric effect on future terms of trade volatility. We interpret these results as supporting our choice to model the terms of trade using a stochastic volatility model.
As a final check on the plausibility of our baseline results, Figure D1 compares the implied standard deviation of terms of trade shocks derived from our EGARCH estimation to the median estimates implied by the stochastic volatility model (SVM). For each of the countries, the two methods imply a similar time series of terms of trade volatility.
Footnote
Estimates assuming a Gaussian distribution produced very similar results. [17]