Reserve Bank of Australia Annual Report – 1971 Domestic Finance
Aside from seasonal changes, financial conditions in Australia during 1970/71 were generally tight. In the course of the seasonal upswing in liquidity, interest rates in short term private markets fell from the high levels reached in the final quarter of 1969/70; however, in the second half of the year these falls were to varying extents reversed. Further small increases occurred in interest rates paid by private borrowers for longer term funds in the course of 1970/71; these rates had risen sharply towards the end of 1969/70. In the six months to September 1970 the volume of money, seasonally adjusted, increased by only 1.4 per cent; thereafter the rate of growth quickened and for the whole of 1970/71 amounted to 6.8 per cent which was slightly above the rate for the previous year. By the standards of earlier years, the growth in the volume of money in both 1969/70 and 1970/71 was quite modest. An important factor tending to restrain the growth in the volume of money and bank liquidity was the strong demand for short term Government securities, mainly Treasury notes, by the non-bank private sector during the seasonal upswing in liquidity and for Commonwealth bonds generally in the final quarter of the financial year. No doubt in part a consequence of the tight domestic financial conditions relative to those abroad, capital inflow reached a very high level during 1970/71 and towards the end of the year was tending to moderate domestic financial pressures.
GRAPH 9 MONETARY INDICATORS
During the first three quarters of 1970/71, demand for short term paper, especially that issued by the Commonwealth Government, was particularly strong. There were record issues of Treasury notes in this period; in their purchases of bonds from the Reserve Bank's portfolio and in their loan subscriptions, investors heavily favoured short maturities. Such behaviour appears to have stemmed from their experience in weathering the extremely tight financial conditions in the final quarter of 1969/70 with a relatively illiquid structure of assets and from apprehensions that conditions as tight or even tighter could eventuate towards the end of 1970/71. However, by about March, investors appeared to have been coming increasingly to the view that the seasonal tightening in financial conditions might not be as severe as previously feared; at the same time an expectation was gaining ground that the next move in interest rates was more likely to be down than up. The course of interest rates overseas and the high rate of capital inflow were important factors in these changes in market views, one evidence of which was a tendency for investors to lengthen their portfolios during the last four months of the financial year.
PUBLIC FINANCE
A strong acceleration in expenditures, as mentioned earlier (p.12), and a slower growth in receipts resulted in a rise in the overall deficit of the public sector from $225 million in 1969/70 to about $400 million in 1970/71. On a national accounting basis, taxation collections of Commonwealth authorities increased by 13 per cent, compared with a rise of 15 per cent in 1969/70. Amounts raised through indirect taxes and company tax continued to rise strongly but the growth in personal income tax collections, affected by reductions in tax rates and declining rural incomes, was lower than in the previous year. Wage increases during 1970/71 had a considerable impact on the spending of state and local authorities. There was a large increase in payments to states from the Commonwealth Government but, even so, a cut-back in spending by state governments in the second half of the year became necessary to limit the growth in their deficits.
Government transactions can be analysed also on a budgetary basis. In 1970/71, the Commonwealth Government budgeted for a surplus of $4 million compared with the deficit of $7 million realised in the previous year. In the event, both revenue and expenditure exceeded expectations but the excess was greater for expenditure and a deficit of $75 million resulted. The main factors contributing to the unexpectedly strong growth in spending were additional payments to the states, the Commonwealth's own additional wage and salary payments and contributions to the operations of the Australian Wool Commission; these increases were partly offset by the cut-back in spending by $75 million announced by the Government in February 1971 and by other reductions in expenditure.
As mentioned elsewhere in the Report (p.17), the Commonwealth Government's net debt repayments overseas in 1970/71 were substantially lower than in the previous year. Wheat Board financing, which in 1969/70 had involved the Commonwealth Government in a net outlay of $184 million, was a source of $65 million to the Government in 1970/71. Miscellaneous financing transactions, which included an amount of $37 million to finance part of the increase in Australia's quota at the International Monetary Fund, involved a small net use of funds in 1970/71; in the previous year, net receipts from these transactions had totalled $45 million.
| $ Million | ||||
|---|---|---|---|---|
| 1967/68 | 1968/69 | 1969/70 | 1970/71 | |
| Expenditure | 6,148 | 6,569 | 7,088 | 8,058 |
| Receipts | 5,506 | 6,184 | 7,081 | 7,982 |
| Deficit | 642 | 385 | 7 | 75 |
| Less: | ||||
| Net overseas borrowing | −(132) | −(142) | −(−131) | −(−46) |
| Wheat Board repayments | – | – | −(−184) | −(65) |
| Miscellaneous financing transactions | −(−21) | −(57) | −(45) | −(−9) |
| Domestic borrowing requirement | 532 | 186 | 276 | 65 |
As a net result of these transactions, the domestic borrowing requirement was $65 million in 1970/71, more than $200 million below that for the previous year. In both 1969/70 and 1970/71, net raisings from domestic loans and Treasury note issues exceeded the borrowing requirement. The net amount raised from domestic loans by the Commonwealth in 1970/71 was $205 million compared with $263 million in the previous year. Over the first ten months of 1970/71, gross subscriptions to cash loans fell short of redemptions and repurchases of securities. This reflected, in particular, the wide margin by which redemptions exceeded cash subscriptions in the February loan. Heavy redemptions were attributable to the large proportion of the maturing series held by “rebate washers” who had acquired their holdings shortly before maturity date in order to gain the tax rebate on the final interest payment. Cash subscriptions to this loan appeared to suffer from the uncertainties which were engendered by the disturbed state of the capital market at the time and which may have led some investors to prefer Treasury notes. In the subsequent loan in May, cash subscriptions were a record for that time of the year while redemptions of the maturing stock, which did not carry a tax rebate, were very low. Special bonds were well supported throughout 1970/71, raising a net $71 million or $22 million more than in the previous year. The above figures do not give a complete picture of the demand for government securities as changes in the private sector's holdings reflect transactions with the Reserve Bank as well as subscriptions to new issues and redemptions of maturing stock. Up to March 1971, Treasury notes on issue rose to the highest level ever recorded but this movement was reversed during the seasonal run down in liquidity and over the year as a whole the total on issue rose by $18 million; during 1969/70 there had been an increase of $47 million in Treasury notes on issue. As a result of the large excess of net raisings from domestic loans and Treasury note issues over the borrowing requirement in 1970/71, the Commonwealth Government's cash balances with the Reserve Bank rose by $157 million. This compares with a rise of $19 million in cash balances in the previous year, after $14 million had been applied to redeem the Treasury bills which remained on issue to the Reserve Bank at 30 June 1969.
Coupon rates offered on medium and long term securities did not change during the year, remaining at 6.8 per cent and 7 per cent respectively. From early March 1971, short term yields on non-rebateable bonds tended to decline slightly in response to a strengthening of demand for these securities; a slightly lower yield was offered on the shortest term maturity in the May loan. Yields on securities carrying a tax rebate showed some tendency to fall during the year, increasing slightly the margin between their yields and those on non-rebateable bonds. There were small changes in Treasury note yields during the year. Increases (0.2 per cent for 13 week notes and 0.3 per cent for 26 week notes) were announced in August; these increases were approximately reversed in April and June by small reductions which were intended to widen the spread of yields on Commonwealth securities.
Local and semi-government bodies raised $497 million in 1970/71 compared with $475 million in the previous year. In the early part of the year contributions to private loans, subscribed mainly by financial institutions, lagged but support improved as the year progressed and for the whole of 1970/71 the amount raised in these loans was about 3 per cent higher than in 1969/70. Although public issues faced strong competition from other borrowers, especially in the December quarter, they raised $67 million for the full year compared with $56 million in 1969/70. Interest rates in both public and private issues were maintained at the levels established in May 1970.
PRIVATE FINANCE
With the incomes of private groups continuing to rise strongly and the growth of their spending tending to ease slightly, the private sector incurred a lower deficit than in 1969/70. Although total borrowing of private non-finance groups maintained a solid rate of growth, a relatively higher proportion was from overseas sources; the expansion in financing from domestic sources, both in the form of direct borrowing and borrowing via intermediaries, may have been a little lower than in 1969/70.
MONEY AND CAPITAL MARKETS
Although short term markets generally did not experience the severe pressures during 1970/71 that had characterised the final quarter of 1969/70, conditions were for the most part fairly tight. Some sections were subject to considerable strains as a result of disturbances originating in other parts of the capital market in the early months of 1971.
One indicator of conditions in short term markets is the cost of funds to authorised dealers. In June 1970, the interest rate paid by dealers on loans out-standing averaged a little over 6 per cent, the highest monthly figure ever recorded. However, there was a noticeable decline in rates in the early part of 1970/71 and, from September 1970 to March 1971, the weighted average rate on clients' loans outstanding was generally around 5 per cent. Other short term interest rates, such as those on bank accepted commercial bills and on inter-company lending, also recorded marked declines during the first half of 1970/71. Short term interest rates again rose substantially during the period of seasonal decline in liquidity but, with the possible exception of rates in the inter-company market, did not regain the levels reached towards the end of 1969/70.
A strong demand for liquid assets, which had been drawn on heavily in the financial stringency of the closing months of 1969/70, was a feature of investor behaviour generally during much of 1970/71. It was clearly evident in short term markets and was illustrated by the portfolio management of the authorised dealers. For the first three quarters of the year, dealers showed a strong preference for securities due to mature within the financial year. In this period they ran up their holdings of Treasury notes from less than $10 million to almost $150 million, while their bond holdings fell by some $40 million. Other investors also subscribed heavily to Treasury notes; in part, this reflected a switch of funds from lower-yielding bank deposits.
Towards the end of the March quarter there were signs of a change in attitudes. In particular, the view seemed to have been strengthened that financial conditions in the June quarter might not be as tight as previously expected and that interest rates generally were unlikely to rise further, apart from temporary seasonal increases. Among authorised dealers this change in view was seen in a large scale switching from Treasury notes into bonds; by June 1971 the average maturity of dealers' portfolios had lengthened substantially.
The announcement in February by a large mining investment company of its inability to meet its debts had pronounced repercussions in short term financial markets during the second half of 1970/71. In part, this was because a major portion of the company's debts were to financial intermediaries engaged in short term financing and to lenders in the inter-company market. A more general factor was the acute nervousness engendered among investors by the company's announcement and aggravated by a series of share market disturbances. Investors' increased concern for safety was reflected in a tendency to shift funds to assets which offered a higher degree of security. There were indications that authorised dealers benefited a good deal from this shift; their loans from non-bank clients rose very strongly in the March quarter and they maintained their portfolios at a high level in the June quarter with less recourse to last resort facilities with the Reserve Bank than in the previous year. On the other hand, some other intermediaries engaged in short term financing faced heavy calling of loans; they were able to meet these calls by realising assets and by turning to alternative sources of borrowing within Australia and overseas. With the containment of these immediate pressures and the reassurance that steps were in train directed towards orderly realisation of the mining investment company's assets, financial markets became somewhat more settled. However, a substantial amount of the company's debts, which lenders had originally believed to be liquid, had not been repaid at the end of the financial year. Among other longer term effects of the company's failure were a considerably more selective approach by lenders in the inter-company market and a greater concern generally over the quality of security for loans. In particular, lenders' preferences appeared to shift from unsecured loans and non-bank bills to bank accepted bills.
The volume of bank acceptances, which had increased in 1969/70, rose further in 1970/71. Apart from the effect of lenders' changing preferences, the inability of the banks to finance from their own resources all demands upon them would have contributed to the increase in acceptances. An appreciable rise in the volume of bills which banks accepted but did not discount was the major source of supply of bank acceptances in the market. In 1969/70 an important source of bills had been sales by the banks from their own portfolios in order to obtain funds; in 1970/71 banks did not rely as heavily on such sales. The authorised dealers added to their holdings of bank bills during 1970/71 but the increased volume of acceptances outstanding was mainly taken up by other lenders whose demand was particularly strong over the closing months of the year.
During the disturbances in financial markets, there was of course the possibility of a sharp general reduction in investor confidence with perhaps serious consequences for a range of participants in financial markets. Throughout the period, contacts with the trading banks, in the money market, and elsewhere in financial markets kept the Bank closely in touch with developments. As a precautionary measure, trading banks were informed that if reduced confidence in other markets increased demands on the banking sector, it would be appropriate for them to respond fully as and when they thought suitable, doing so in the knowledge that the Bank stood ready to support them. In the event, the additional demands on the banks appeared to be fairly limited.
The strong overall demand for funds in fixed interest markets in the first half of 1970/71 was reflected in a high level of net raisings in this period; interest rates on new issues reached their highest level for many years. In the December quarter, when demands of industrial borrowers were particularly heavy, interest rates offered tended to increase and the minimum maturity for which the maximum rate was offered to shorten; rates up to 9.5 per cent were offered by industrial companies in this period. Fixed interest raisings fell sharply in the second half of the year but interest rates remained high. Some borrowers switched to overseas sources of finance and there may also have been some deferment of issues in expectation of easier borrowing conditions within Australia. Capital market disturbances early in the second half of 1970/71 may have affected the supply of funds. The tendency for raisings to be concentrated in the first half of the year was apparent among both industrial borrowers and finance companies.
Some large issues by established mining companies were mainly responsible for the high level of equity raisings by listed companies during the first half of 1970/71. Share issues by non-mining companies declined during this period. In the March quarter of 1971 total equity raisings fell considerably and, according to preliminary indications, were fairly low in the June quarter. The slackening in growth of economic activity could have reduced demands for equity issues. Furthermore, new issues may have been discouraged by the depressed conditions of share markets. Industrial borrowers seem to have relied more heavily on fixed interest borrowings in Australia and also may have met more of their financial requirements from overseas sources. The number of new mining company flotations dropped sharply in 1970/71.
Australian share markets were generally weak during 1970/71. This was probably in part a consequence of tight financial conditions and high interest rate levels accompanied by a reaction from the recent boom in mining stocks. It also reflected reduced investor confidence stemming from a series of disturbances affecting share markets. Following a modest rise in the early part of the year, the Sydney Stock Exchange “All Ordinaries” Share Price Index declined sharply in the December quarter. The announcement in early February of the failure (mentioned above) of a mining investment company further depressed prices. Investor confidence was also later weakened by developments affecting some mining shares, including reversals of news of drilling results and disclosure of oversold positions in some shares, and by the failure of several stock broking firms; several mutual funds also suspended operations in the first half of 1971. At 30 June 1971, the “All Ordinaries” Index was 9 per cent lower than a year earlier. Declines during 1970/71 in prices of speculative mining stocks were particularly sharp. Turnovers, especially of mining stocks, were well down on the previous year's record levels.
The events in financial markets during 1970/71 and other recent years have caused considerable concern and led to official investigation of practices and responsibilities in securities markets both at the state level and by the Senate Select Committee on Securities and Exchange. A number of changes have already been made to laws relating to the securities industry and others are proposed; stock exchanges have revised certain rules. The continuing process of improvement of laws and practices in the securities industry is a necessary part of maintaining the orderly functioning of securities markets. It cannot, of course, remove the need, apparently not fully recognised in the recent past, for careful inquiry and prudent judgment on the part of lenders and investors as to the risk they undertake and its relationship to their capacity to carry risk.
FINANCIAL INSTITUTIONS
Links between Australian and overseas financial institutions have increased in recent years. During 1970/71, 12 overseas banking institutions applied to open representative offices in Australia, bringing the total number to 39. The first such representative office was established in 1957 but the number did not start to grow appreciably until the late nineteen-sixties when banks incorporated in the United States began showing increased interest. Over the past two years, however, European and Japanese banks have considerably strengthened their representation. Representative offices of overseas banks are authorised on condition that they act purely as liaison offices and do not undertake any banking business. Some of the Australian trading banks have opened representative offices abroad in recent years; during 1970/71, decisions to open further offices (in Singapore by one bank and in Singapore and Hong Kong by another bank) were announced.
Overseas banking and other financial organisations were again active in acquiring equity holdings in existing Australian non-bank financial institutions and in establishing new financial enterprises mainly in conjunction with Australian institutions. At the end of 1970/71, the number of public companies engaged in non-bank financing (excluding insurance companies) in which overseas concerns held substantial equity interests was around 60; a decade ago the corresponding figure was about 10.
The majority of the new financial enterprises formed through joint participation of Australian and overseas financial institutions comprise what are commonly referred to as merchant banks. The operations they undertake vary considerably but a common feature is the provision of a fairly broad range of financial services which may include under-writing and sub-underwriting, the acceptance of bills, general financial advice to businesses and portfolio management as well as the actual provision of business finance, generally through discounting commercial bills or short to medium term advances.
The trading banks have been prominent among the Australian participants in new merchant bank ventures, thereby further extending the fields of financing with which they are associated. Other areas of financial activity in which the trading banks have set up or acquired interests over the past 15 years include savings banks, finance companies (engaged in instalment credit and other financing), nominee companies and unit trusts.
As well as extending their institutional links, the trading banks, as mentioned in earlier Reports, have been expanding the range of financial facilities they themselves offer, both in respect of the liabilities they issue and the types of loans they make. These processes have been taking banks into new areas, some of which had been occupied mainly by non-bank intermediaries. At the same time, however, the new non-bank institutions that have been emerging, many linked to overseas banks and other entities of high repute in international finance, have been establishing a place particularly in markets for short term funds. These developments, which are a natural accompaniment to economic expansion, have produced considerable overlapping of the areas of financing occupied by banks and non-banks, and the present pattern raises some important policy issues. In the course of their special relationship with the monetary authorities, benefits are conferred on banks but constraints are also imposed—in part in the interests of monetary policy. To the extent that this singling out of banks affects the pattern of the business they undertake, questions of efficiency in the conduct of the community's financial intermediation arise and on these grounds there is some case for limiting the degree and manner of treating banks differently from non-banks.
In its assessments of current and prospective developments in the financial system, the Bank continues to benefit from periodic meetings with banks and other financial institutions. In 1970/71, the groups with whom the Bank meets on a regular basis to exchange information were extended to include the Australian Association of Permanent Building Societies.
Indications are that in 1970/71 most financial intermediaries recorded solid increases in their lending but that the rates of growth were generally below the very high rates recorded in the previous year. In the constrained financial conditions, competition for available funds was particularly strong and some intermediaries were obliged to offer higher interest rates or broaden the range of claims they issued to maintain a desired inflow of funds.
Trading Banks
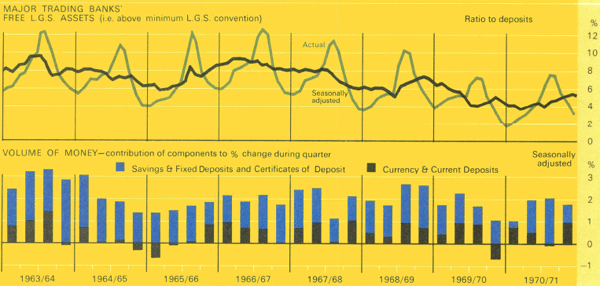
In 1970/71 the major trading banks experienced their second successive year of slow deposit growth. The rate of increase in their total deposits in 1969/70 was 5.5 per cent and in 1970/71 it eased further to 4.4 per cent.
GRAPH 10 MAJOR TRADING BANK DEPOSITS
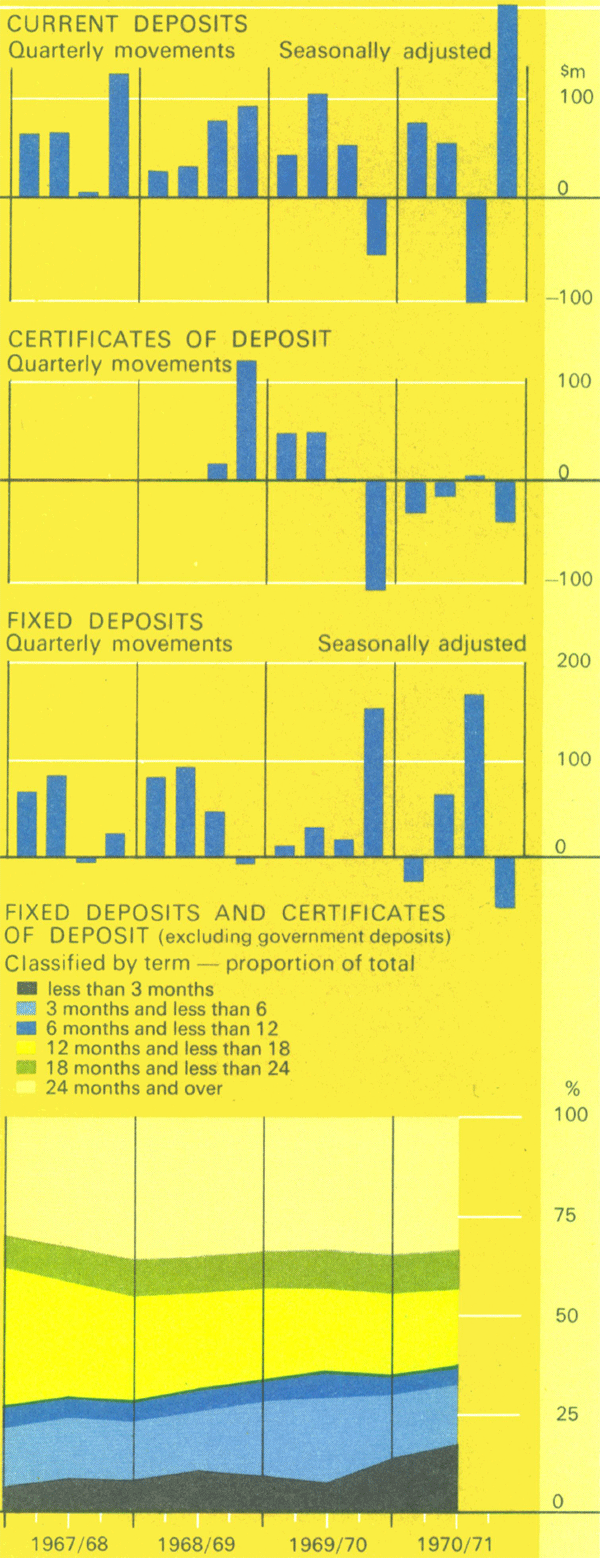
Deposit experience was particularly sluggish in the five months to November but improved markedly over the remainder of the financial year. The separate categories of deposits showed diverse movements (see graph 10). After allowing for seasonal influences, current deposits showed a moderate rise in the first half of the year, declined in the March quarter but recovered strongly in the final quarter; the increase over the whole year was 5.7 per cent. Fixed deposits also increased by 5.7 per cent in 1970/71; on a seasonally adjusted basis, they showed little net change over the first five months of the year, then increased rapidly until April after which there was a decline. The generally stronger performance in the second half of the year may have been due partly to the extension of fixed deposit terms (outlined below) but also possibly reflected investors' increased concern for security. Certificates of deposit continued the decline that had been in evidence in the second half of 1969/70. At June 1971, certificates of deposit outstanding amounted to $43 million, a fall of $83 million over the year.
In December 1970, trading banks extended the maximum maturity offered for fixed deposits from two to four years. The longer term deposits offer interest rates up to a maximum of 6.5 per cent which is 1 per cent above the maximum rate previously available on fixed deposits. The broadening of the maturity structure of trading banks' liabilities improved their ability to compete with other intermediaries and was consistent with the long term tendency for term lending to assume increasing importance in the overall pattern of trading bank lending.
During 1969/70 the liquidity position of the major trading banks had tightened considerably. In June 1970 the ratio of their holdings of liquid assets plus Government securities to total deposits (LGS ratio) stood at 20.5 per cent, the lowest level for many years, and some banks found it necessary to borrow from the Reserve Bank to ensure that their individual LGS ratios did not fall below the agreed minimum of 18 per cent provided for under the LGS convention. In terms of this convention, each bank undertakes to direct its policy to ensuring that its LGS ratio will not fall below an agreed uniform minimum (18 per cent since 1962). If for any reason this minimum is not maintained the bank undertakes to correct the position, if necessary by borrowing from the Reserve Bank. For its part, the Reserve Bank undertakes so to administer the Statutory Reserve Deposits of the trading banks that, if trading bank lending is in accord with central bank credit policy, banks generally will be able to maintain their LGS ratios above the agreed minimum.
During 1970/71 the liquidity of the trading banks remained under pressure. The rise in the LGS ratio over the first eight months of the year represented no more than the normal seasonal movement. The subsequent seasonal decline was eased by a reduction in April in the Statutory Reserve Deposit ratio from 9.4 per cent to 8.9 per cent and by the high levels of capital inflow; aggregate LGS ratios during the final quarter were a little higher than in the corresponding months of 1969/70.
Generally, the pressure from bank customers for financial accommodation continued unabated in 1970/71. However, their tight liquidity situation was a major constraint operating on banks and prevented them from meeting all these demands. Total lending approvals for the year were about 6 per cent above the 1969/70 figure. Overdraft approvals, which included a number of large approvals for special purposes, increased by 9 per cent but this was partly offset by the decline in term loan approvals. After easing toward the end of 1969/70, the seasonally adjusted rate of new and increased overdraft approvals rose moderately in the early part of 1970/71; this higher rate was maintained until February but during the remainder of the year the rate of new approvals returned to a somewhat lower level. The rate of cancellations and reductions which in previous years had tended to rise steadily showed only a slight increase in 1970/71. As a result, overdraft limits increased substantially. Outstanding overdraft advances of the major trading banks (discussed below) grew at about the same pace as limits over 1970/71 and the percentage use of limits remained at a high level.
Farm development loan approvals were higher in 1970/71 than in the previous year. However, there was a fall in term loan approvals; this followed two years of rapid expansion of term lending which had reflected high rates of approvals subject to refinancing with the Australian Resources Development Bank. Repayments of earlier loans have become increasingly important sources of funds for new lending from both Term and Farm Development Loan Funds but, particularly for the latter, the scale of such repayments still falls somewhat short of the rate at which new loans are being disbursed. By early 1970/71 the balances of these Funds had reached relatively low levels and it was decided in September to make further transfers to them. The transfers amounted to $63 million, $31 million to the Term Loan Fund and $32 million to the Farm Development Loan Fund. A reduction in the Statutory Reserve Deposit ratio from 10 per cent to 9.4 per cent on 29 September provided approximately two thirds of the aggregate amount of the transfers; the remainder came from subsequent transfers from banks' other assets.
GRAPH 11 MAJOR TRADING BANK LENDING
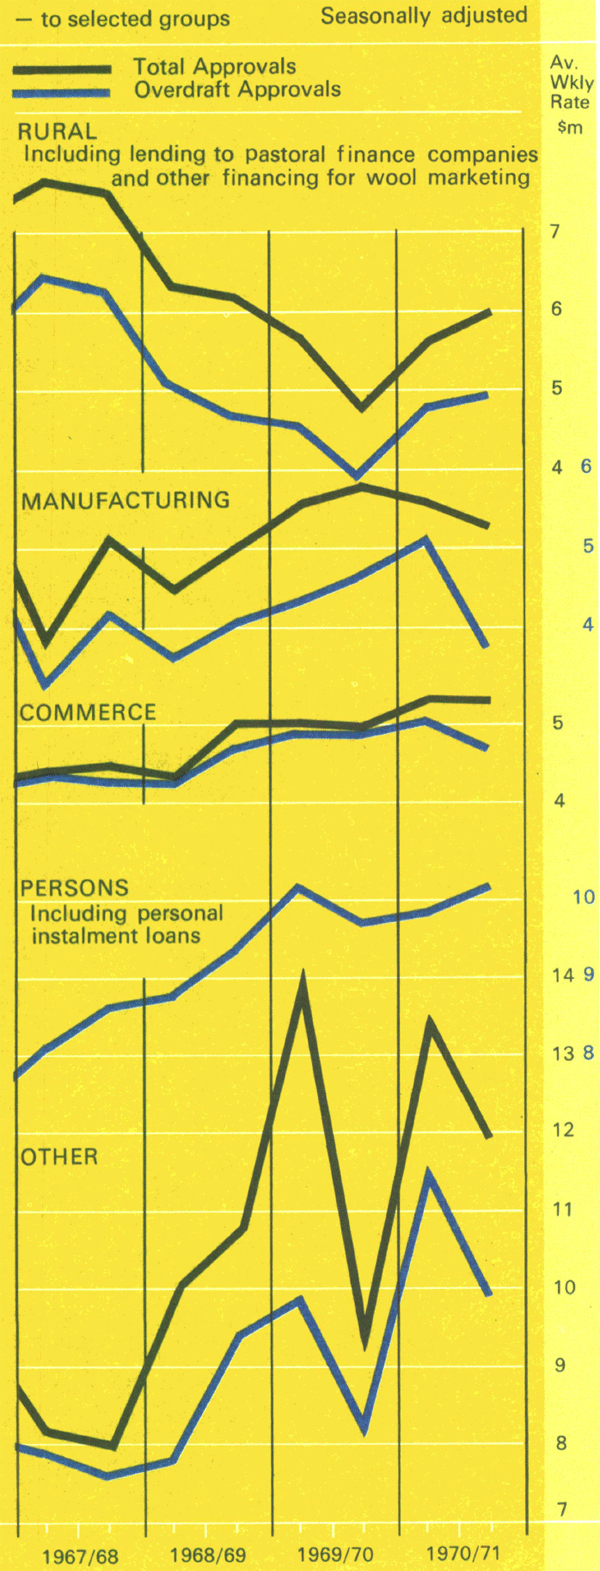
Graph 11 shows the distribution of new lending approvals of the major trading banks among selected groups; the rural group includes lending to pastoral finance companies and other financing for wool marketing. The strong increase in 1970/71 in lending to the rural group reflected the contribution of banks to the financing requirements for the new wool marketing arrangements. Direct lending to farmers declined in 1970/71 as it had done in the previous two years. This downward trend would seem to reflect reduced demands for finance for property purchase and farm investment, the reluctance of farmers already in strained financial circumstances to incur further debt, and the fact that at present there would be a considerable number of farmers to whom further lending could not be considered a sound commercial proposition. Nevertheless, the banks continued during 1970/71 their long-standing policy of giving sympathetic treatment to the rural sector including, in particular, producers affected by drought and flood. Lending to commerce and to persons increased but lending to manufacturing industry was slightly lower than in the previous year. The “other” category did not maintain the rapid rate of expansion of the past few years, apparently reflecting mainly a somewhat slower growth in the mining industry's recourse to the banking system for finance.
In seasonally adjusted terms, the slackening in the growth of outstanding advances of the major trading banks which occurred in the final months of 1969/70 continued in the first half of 1970/71. In the second half of the year advances grew more quickly. Nevertheless, the growth in advances of 8.4 per cent for the year as a whole was somewhat slower than in 1969/70. Overdraft advances rose by 7.4 per cent in 1970/71 compared with 9.8 per cent in 1969/70. The rates of increase in term and farm development loans outstanding were also lower than in the previous year. Temporary advances to wool buyers declined for the second successive year.
The Australian Resources Development Bank Limited and the Australian Banks' Export Refinance Corporation Limited, both wholly owned by the major trading banks, continued to expand their operations during 1970/71.
The Resources Bank again financed a wide range of natural resource projects; its loans outstanding rose by $98 million to $261 million which was slightly below the previous year's increase. Most loans continued to be in the form of refinanced trading bank loans although the Resources Bank was able to extend its activities as a direct lender. The easing of financial conditions and reductions in interest rates in capital markets abroad encouraged a further swing to overseas sources of finance; for the year, its net overseas borrowing amounted to $40 million compared with $30 million in 1969/70. Funds raised in Australia were below the previous year's level. The total amount raised from issues of transferable deposits, the Bank's major domestic source of funds, was $35 million ($42 million in 1969/70).
Increasing success by Australian exporters in overseas markets for manufactured goods has led recently to greatly expanded recourse to the refinancing facilities of the Australian Banks' Export Refinance Corporation Limited. At June 1971, the Corporation's refinancing loans outstanding amounted to $21 million compared with $7 million a year earlier. In addition, outstanding loan commitments at June 1971, in respect of both actual and potential export contracts, aggregated a further $27 million. The Corporation's potential sources of funds were widened during the year with an amendment to the Banking (Savings Banks) Regulations prescribing loans to the Corporation as a permissible form of investment for the savings banks.
The other trading banks, which include the State Government trading banks, continued to experience a faster growth in deposits than the major trading banks. The increase of 9 per cent in 1970/71 was only slightly lower than that of other recent years. Following a very rapid rise last year, the rate of increase in the advances of these banks eased to 9 per cent in 1970/71. Their holdings of liquid assets and Government securities increased during the year, largely reversing the sharp decline that occurred in 1969/70.
Savings Banks
On a seasonally adjusted basis, the rate of increase in savings bank deposits was fairly slack in the first few months of 1970/71, but thereafter the pace of expansion quickened. Over the full year deposits grew by 7.5 per cent compared with 6.0 per cent in the previous year and an average rate of growth of about 9 per cent during the nineteen-sixties. Savings banks probably benefited from the high level of personal savings in 1970/71 and from a more cautious attitude by investors. On the other hand, the flow of funds to savings banks may have been diminished by the smaller increase towards the end of 1969/70 in predominant interest rates on their deposits relative to the rise in rates on most competing assets. Apart from an increase in the rate of interest on savings bank Investment Accounts from 5 per cent to 5.25 per cent per annum in May 1971, the predominant interest rates on savings bank deposits remained unchanged during the year.
The increase in savings banks' holdings of LGS assets was considerably larger than in 1969/70 but, as in other recent years, the rate of increase remained well below that of deposits. Following the increase in yields on Treasury notes in August 1970, the savings banks began to add substantially to their holdings of these securities and at the same time to reduce their fixed deposits with the Reserve Bank. In the six months to December 1970, their holdings of Treasury notes increased by $275 million and their deposits with the Reserve Bank declined by about $185 million. In the second half of the year these movements were to a large extent reversed as interest rate adjustments reduced the relative attractiveness of Treasury notes. Savings banks' holdings of Government securities other than Treasury notes, which in the previous year had shown little change, increased moderately in 1970/71. Their holdings of local and semi-government securities maintained the steady growth of earlier years.
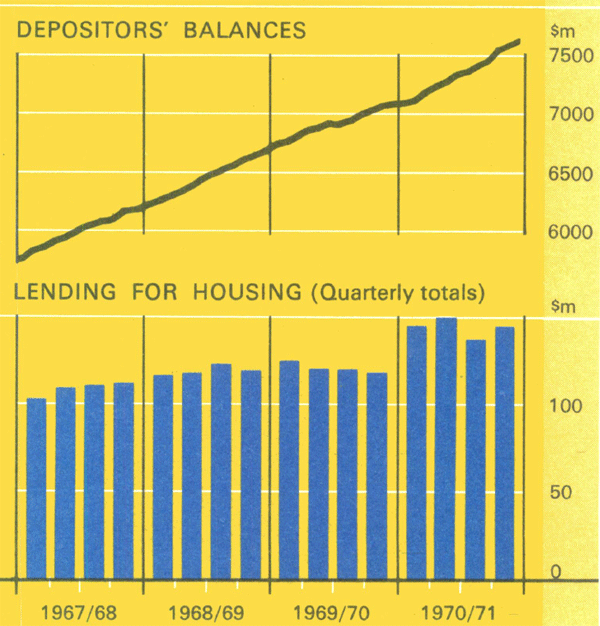
Around the end of 1969/70 savings banks had been asked to consider adding significantly to their lending for housing to help offset the reduction that was occurring in the flow of housing finance from other institutional lenders. Their response is indicated by the increase of 25 per cent in their approvals to $145 million in the September quarter; this rate of lending was maintained in the December quarter. A change announced in October 1970 in the regulations governing savings banks' investments (see p.30) removed a potential constraint on lending for housing by those savings banks subject to the Banking Act. In the second half of 1970/71 lending declined slightly. Total approvals for the year were 21 per cent higher than in 1969/70. The higher rate of lending was reflected also in the solid growth that occurred in housing loans outstanding.
GRAPH 12 SAVINGS BANKS
Seasonally adjusted
Other Intermediaries
Finance companies continued to expand their activities in 1970/71 although competition from other borrowers may have added to the difficulty of raising funds. Their new lending showed little change in the early part of 1970/71 but subsequently rose fairly strongly; over the 11 months to May 1971 it was 11 per cent higher than in the corresponding period of 1969/70 (see graph 13). Total outstanding balances owed to finance companies maintained a strong upward trend during the first half of the year but grew less rapidly during the following five months; at May 1971 balances outstanding were 17 per cent above their level a year earlier. In recent years, the growth in finance company lending has tended to be more in the provision of business finance than in consumer finance; this trend appeared to continue in 1970/71. Leasing business of the finance companies again increased markedly. Their short term commercial loans, which include funds invested to meet companies' needs for liquidity, rose during the first half of the year but subsequently declined. Other consumer and commercial loans again increased strongly in 1970/71. The growth in instalment credit balances outstanding in 1970/71 (10 per cent) was a little lower than in the previous year.
GRAPH 13 NON-BANK FINANCING
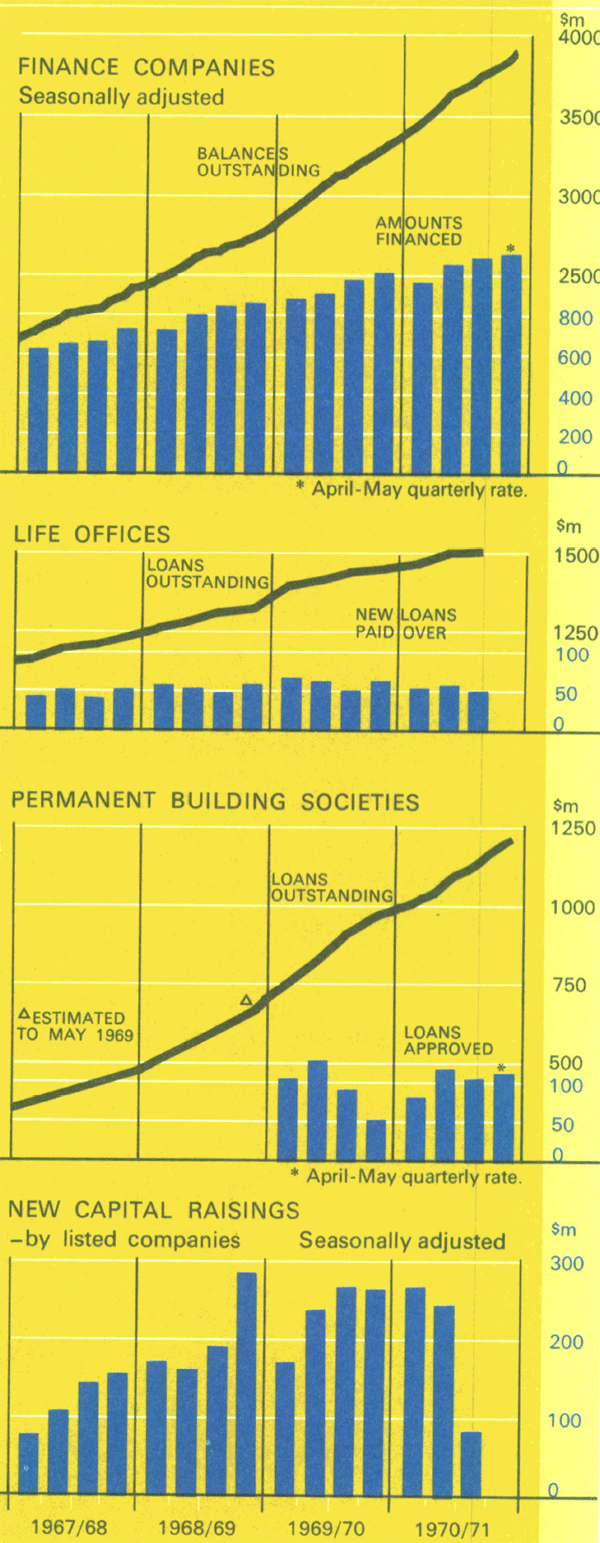
Permanent building societies grew rapidly in 1970/71. Over the 11 months ended May 1971, claims of shareholders and other lenders on these societies grew by 30 per cent compared with 35 per cent in the corresponding period of 1969/70. As in the previous year, the inflow of funds was higher in the first six months. This experience suggests that permanent building societies are subject to seasonal influences broadly similar to those affecting most other financial institutions. Lending approvals by societies rose strongly in the September quarter from the very low rate of the final three months of 1969/70. Approvals rose further in the December quarter but eased slightly in the second half of the year. From September 1970 onwards, the rate of approvals was much more stable than in 1969/70. Given the seasonal variations in the intake of funds referred to above, it is apparent that societies have to a greater extent allowed the impact of such variations to fall on their holdings of liquid assets rather than their lending for housing. In view of the importance that permanent building societies have acquired as a source of housing finance, the avoidance of undue fluctuations in their rate of lending represents an important contribution to the stability of the building industry.
Total assets of life offices increased by 7.5 per cent in the first three quarters of 1970/71, somewhat below the rate of growth in the corresponding period of 1969/70. Their holdings of debentures and of Commonwealth Government and local and semi-government securities rose at about the same rate as their total assets. As in the previous year, the share and property holdings of life offices increased strongly. Their new lending, which had been expanding in recent years, declined in the first three quarters of 1970/71; loans on policies continued their upward trend but mortgage loans fell sharply. The share of total assets of life offices accounted for by loans outstanding (26 per cent at March 1971) continued to decline in this period.
Outstanding rural advances of pastoral finance companies rose in the first half of 1970/71 but subsequently fell sharply. Over the 11 months to May 1971 they declined by about 3 per cent. Advances rose in Queensland but fell in most other states. Clients' credit balances held with pastoral companies continued to decline.
Institutional Developments
During the year, the merger of the Australia and New Zealand Bank Limited and The English Scottish and Australian Bank Limited into the Australia and New Zealand Banking Group Limited was completed. Their respective savings bank subsidiaries were also merged. The new parent bank was granted an authority to carry on banking business in September 1970 and in the following month formally commenced operations.
Early in May, a Bill was introduced into the House of Representatives to give the Commonwealth power to control the acquisition by local or overseas interests of large shareholdings in banks incorporated in Australia and holding authorities under the Banking Act. Subject to certain transitional provisions, the Bill provides that the nominal value of voting shares of a bank in which a person (including a corporation) may have an interest shall be limited to less than 10 per cent of the total nominal value of the bank's voting shares unless the Treasurer fixes a higher percentage for that person. In introducing the Bill, the Treasurer stated that the policy of the Government, as it had been of all previous Governments since 1945, was not to grant overseas interests authorities to carry on banking business in Australia or to allow them to acquire interests in existing Australian banks.
An amendment to the Banking (Savings Banks) Regulations, announced in October, reduced from 65 per cent to 60 per cent the proportion of depositors' balances that savings banks subject to the Banking Act are required to hold in prescribed liquid assets and public sector securities. Since the investment ratio was last changed in 1963, housing loans outstanding had grown proportionately faster than depositors' balances and some savings banks were beginning to feel constrained by the 65 per cent requirement. The amendment to the Regulations ensured that it did not become necessary on this account for them to curtail lending for housing.