Reserve Bank of Australia Annual Report – 1969 Domestic Finance
Sector Financing
For the most part, purchases of goods and services are, of course, met from current income. If spending exceeds current income a deficit is incurred which must be financed by borrowing or by running down holdings of financial assets; similarly, a surplus may be used for the purchase of financial assets or for repaying debts. All sectors of the economy acquire both assets and liabilities but some may run a net deficit and others a net surplus. For the economy as a whole (including the overseas sector), total surpluses equal total deficits. Financial institutions act as intermediaries between the ultimate deficit and surplus groups, borrowing from those in surplus and lending to those in deficit; the profits from their operations also yield a surplus which may be used to finance others' deficits. The Reserve Bank is an intermediary in that it incurs liabilities, through issuing notes and acquiring deposits from banks and governments, and accepts claims on the overseas sector (as custodian of Australia's reserves), on government and on special classes of borrowers.
In 1968/69, as in most recent years, both the private and public sectors ran deficits and there was a corresponding surplus of the overseas sector with Australia (a current account deficit in Australia's balance of payments). Borrowing from the rest of the world was sufficient to finance the deficits of the public and private sectors and to enable Australia to add to its foreign assets (see pages 16 & 17).
Public Sector Financing
In the public sector, revenue increased substantially in 1968/69. Although personal income tax rates were unchanged during the year, higher incomes coupled with a progressive tax scale yielded increased revenue to the Commonwealth Government and this was supplemented by the return from small increases in rates of company taxation and sales tax. State and local authority revenue raisings were increased by the introduction of a receipts duty in several states and by higher transport charges and local government rates. Public sector spending grew at a slower pace in 1968/69 and the net deficit of the public sector (on a national accounting basis) declined, to $530 million. Within the public sector, the deficit of state and local authorities increased in 1968/69 but this was more than offset by a rise in the surplus of Commonwealth authorities.
On a budgetary basis, the deficit of the Commonwealth Government in 1968/69 was $385 million, compared with $642 million in 1967/68. This was the first decline in the Commonwealth Government's deficit since 1964/65. But whereas last year most of the deficit was financed by domestic borrowing, in 1968/69 37 per cent of it was financed from overseas. The composition of domestic borrowing was also very different. In 1967/68, $297 million (56 per cent) of the Commonwealth Government's domestic borrowing requirement was met from loan raisings, $184 million from an increase in Treasury notes on issue, and $51 million from temporary borrowing from the Reserve Bank. In contrast, in 1968/69 net domestic loan raisings yielded $381 million, which was well above the domestic borrowing requirement of $186 million, and over the year there was a reduction of $68 million in Treasury notes on issue and a net repayment to the Reserve Bank of $127 million of temporary borrowing. (See graph 8).
Graph 8
GOVERNMENT FINANCE
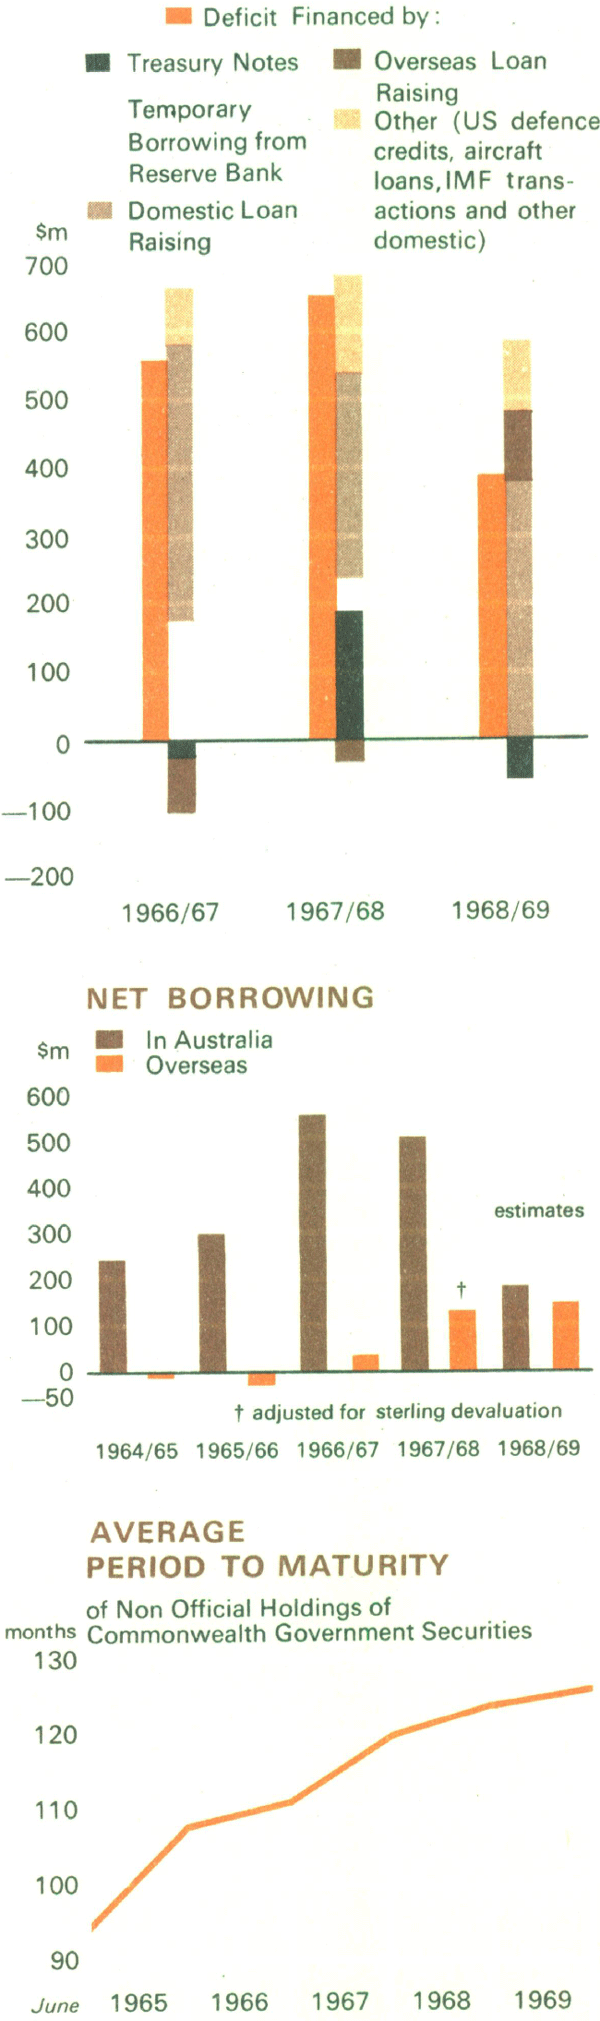
The Commonwealth Government again floated four cash loans in Australia in 1968/69—in August and November 1968 and February and May 1969. In aggregate the proceeds from these loans exceeded that of the four loans floated in 1967/68 but this reflected the heavy subscription to the February loan; subscriptions to the other three were below the levels of the corresponding loans in 1967/68. Redemptions in 1968/69 were lower than in the previous year. Special bonds remained on continuous issue throughout the year and yielded a net $16 million, compared with a net $26 million in 1967/68. There was again a strong demand for Treasury notes during the seasonal upswing in liquidity but the total on issue reached a peak for the year well below that attained in 1967/68 and at end June 1969 Treasury notes on issue had run down to a level substantially lower than that at end June 1968.
After allowing for the change in terms of the November loan raising, there was not much change during the year in the yields at which bonds were issued. The terms of the August cash loan were unchanged from those of the previous loan in 1968. The November loan, which was the first to be issued on a non-rebateable basis (see page 33), offered yields of around 0.15 per cent higher than for similar maturities on rebateable bonds. The terms of the February loan were broadly the same as those of comparable maturities in the November loan but in May yields on shorter dated securities were increased slightly. The yields at which bonds carrying the tax rebate were traded in the market fell after the introduction of non-rebateable securities. Market yields on short-dated bonds subsequently rose slightly but there was little overall movement until near the end of the year when market yields rose sharply in response to open market operations by monetary authorities (see page 30). In the first cash loan raising in 1969/70, issue yields on all maturities were higher. Issue yields on Treasury notes were increased by small amounts in November, December and January and were further increased in April, May and June 1969.
Loan raisings by local and semi-governmental bodies increased by 9.0 per cent over 1968/69, to $461 million. Most of the increase in subscriptions came from life offices. Public loan raisings by semi-governmental authorities raised $45 million, an increase of 17 per cent on last year, but underwriters were called on for a substantially higher proportion of the amounts sought. Interest rates paid on local and semi-governmental borrowing remained unchanged over the year.
Private Sector Financing
During 1968/69 there was a rapid rise in the income of the private sector. The upward movement in farm income was very large and wages and profits increased at a fast pace. Spending by the private sector also grew strongly. The sector again incurred a net deficit; the amount, about $450 million, was roughly the same as in 1967/68.
In 1968/69 the private non-finance group incurred a net deficit of about $850 million. This was partly offset within the private sector by a net surplus of about $400 million achieved by financial institutions, largely in the form of undistributed earnings of life offices and pension funds. The net deficit of the private non-finance group was somewhat larger than in the previous year and the increase in its total financial assets and liabilities was substantially greater.
The massive inflow of foreign capital to the private sector was once more the most important element in meeting the private non-finance group's demand for funds in 1968/69. Loans by trading banks contributed markedly less to the increase in the group's liabilities in 1968/69 than in the previous year and savings bank lending contributed a smaller proportion. An important influence this year was a sharp increase in advances from the Rural Credits Department of the Reserve Bank; after a net reduction in Rural Credits advances of $129 million over 1967/68, these advances added $251 million to the private sector's funds in 1968/69. Building society mortgages continued their recent rapid growth, while finance companies provided about the same proportion of the increase in the private non-finance group's borrowing as in 1967/68. Borrowing through the issue of corporate securities increased strongly during the year.
The private non-finance group added to its claims on the banking system at a much faster rate in 1968/69. Net contributions to life offices and pension funds grew steadily but accounted for a smaller proportion of the increase in total financial asset holdings by the private non-finance group than in 1967/68. Holdings of public sector securities increased moderately after falling in 1967/68. The high level of demand for notes and coin, which emerged with the introduction of decimal currency, was maintained.
Financial Intermediation
The Banking System
In recent years the Australian banking system has been under pressure to adjust to growing competition from other financial intermediaries and to developments in international financial markets. This process of adjustment continued in 1968/69.
In December 1968 the Australia and New Zealand Bank Limited and The English Scottish and Australian Bank Limited announced their intention to merge and, as required under the Banking Act, sought the Commonwealth Treasurer's approval to do so. The Treasurer subsequently announced that, after consideration of reports by the Reserve Bank and Treasury, the Government had decided to give its approval, subject to agreement on certain procedural aspects of the merger. Formal approval was announced on 24 May 1969. The Australia and New Zealand Banking Group Limited, incorporated in the United Kingdom, assumed ownership of the two banks in June and will in due course conduct their combined banking business. The combined savings bank business of the two banks in Australia will be conducted by Australia and New Zealand Savings Bank Limited, whose shares will be owned by Australia and New Zealand Banking Group Limited. This was the first merger between major Australian trading banks since 1951. Two other merger proposals were announced around the end of 1968, one between the Bank of New South Wales and The Commercial Bank of Australia Limited and the other between The National Bank of Australasia Limited and The Commercial Banking Company of Sydney Limited. Discussions between the first of these groups, however, terminated without reaching agreement and there is not at present any proposal before the Government concerning the latter.
During the year there was a marked expansion of international banking relationships, which affected both Australian banks and overseas banking interests in Australia. A number of major overseas banking organisations formed or extended links with Australian institutions to operate mainly in medium- to long-term financing; an Australian trading bank entered into one such association in 1968/69. The Commonwealth Government maintained its policy of not granting new authorities to overseas banks to conduct banking business in Australia but continued to approve the establishment by overseas banks of representative offices in Australia to undertake liaison activities; the number of these increased quite sharply in 1968/69. The year also saw the opening of representative offices overseas by several Australian banks.
An innovation in Australian trading bank practice during the year was the issue in March 1969 of marketable certificates of deposit. The introduction of these certificates, which combine the characteristics of interest bearing deposits with those of marketable assets, was designed to help maintain the competitiveness of banks in markets for short-term funds. Certificates of deposit have been issued in amounts of $50,000 or over for terms ranging from three months to two years at yields of up to 4.75 per cent. Banks are not permitted to buy back certificates issued by themselves. The Australian Resources Development Bank is permitted to make limited issues of such certificates of deposit subject to the same minimum denomination and maximum yield conditions as trading bank issues. In addition, the Resources Bank issues longer term transferable certificates of deposit, which are non-bearer securities, in multiples of $100. Authorised dealers in the short-term money market are permitted to deal in certificates of deposit and to hold a limited proportion of their portfolios in this form.
In March 1969 it was announced that approval had been given for savings banks to pay interest on progressive savings accounts up to 1 per cent per annum higher than on ordinary deposit accounts. A depositor to a progressive savings account undertakes to make regular deposits and not to make withdrawals over a period of at least three years.
Graph 9
BANK DEPOSITS
Trading Banks
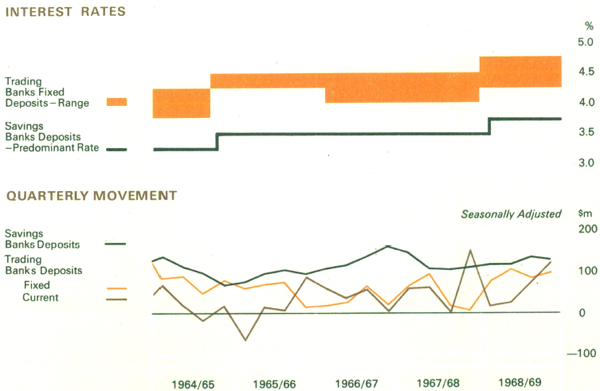
After increasing by 8 per cent in 1967/68, major trading bank deposits again grew at a fast pace in 1968/69, rising by 10 per cent over the year. Most of the growth was in fixed deposits (including certificates of deposit), which achieved an annual growth rate of 15 per cent, compared with 8 per cent in 1967/68. (See graph 9). The ratio of fixed to total deposits, which had increased strongly in the early 1960's but had shown little change since the end of 1966, again moved up, rising from 40.4 per cent in June 1968 to 42.3 per cent in June 1969. The faster growth in fixed deposits came with an increase of 0.25 per cent in fixed deposit interest rates, announced at the end of June 1968 as a measure designed largely to maintain the attractiveness of bank deposits. In the last quarter of the year there was a further stimulus from the introduction of certificates of deposit; at the end of June 1969 major trading banks' outstanding certificates of deposit represented just over 2 per cent of their total deposits. Current deposits showed little overall movement in the first half of 1968/69 (on a seasonally adjusted basis), but grew more quickly in the latter part of the year, increasing by 7 per cent over the year as a whole compared with an increase of 8 per cent in 1967/68.
During 1967/68 there had been little change in major trading banks' holdings of liquid assets and Government securities (L.G.S. assets) and, with deposits increasing, the ratio of L.G.S. assets to deposits of the major trading banks had declined over the year to 21.9 per cent in June 1968. At the beginning of 1968/69 it was anticipated that a continued strong demand for funds and an expected decline in international reserves would produce some tightening in bank liquidity over the year, from its initial low level. There was no evidence of such a tightening in the early months of 1968/69 and during the period of seasonal upturn in bank liquidity the Statutory Reserve Deposit ratio was increased in two equal steps from 8.0 per cent to 9.0 per cent. In December-January private sector liquidity was boosted by advances by the Rural Credits Department of the Reserve Bank and the major trading banks' L.G.S. ratio (on a seasonally adjusted basis) began to rise sharply. The upward trend in the ratio was maintained over the rest of the year and in June 1969 the major trading banks' L.G.S. ratio was 22.9 per cent. L.G.S. assets of the major trading banks increased during the year by $190 million.
Graph 10
MAJOR TRADING BANKS
OVERDRAFT LENDING
Seasonally Adjusted
Trading bank loans to authorised dealers in the money market rose slightly in 1968/69 while their balances in Term Loan Fund and Farm Development Loan Fund accounts with the Reserve Bank declined.
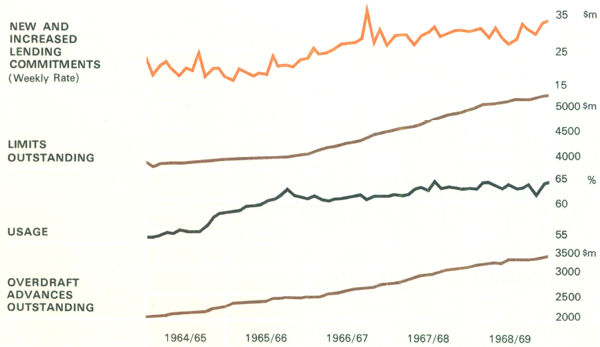
Outstanding advances of the major trading banks (on a seasonally adjusted basis) rose sharply in the first quarter of 1968/69, increasing by about the same amount as the increase in deposits. After this there was a gradual rise until the last quarter when there was a further strong upward movement. The growth over the year as a whole, of 10 per cent, was the lowest since 1965/66 and was well below the rate of increase in 1967/68. Overdraft advances grew strongly in the first quarter of 1968/69 but levelled out in the second and third quarters before increasing again in the last months of the year. An increase of 0.25 per cent in the maximum overdraft interest rate was approved in October 1968, bringing the rate to 7.50 per cent. Temporary wool advances rose strongly during the year. Term loans outstanding also rose substantially around the middle of 1968/69 but at a slow rate over the rest of the year; farm development loans maintained a steady growth.
The weekly rate of aggregate new and increased lending commitments followed a downward trend in the first half of 1968/69 but regained previous levels later in the year. Cancellations and reductions of overdraft limits maintained fairly high levels over most of the year and consequently net approvals were generally low. Usage of limits was at a high level throughout 1968/69. (See graph 10). Approvals of term loans were higher in 1968/69 than in the previous year, largely reflecting loans refinanced by the Australian Resources Development Bank.
Trading bank lending to the rural sector fell from the high levels of 1967/68, despite some upturn towards the end of 1968/69. New loan approvals to the manufacturing sector and to commerce were at higher levels in 1968/69 than in the previous year and there appears to have been a high rate of new loans approved to the mining industry. The rate of new approvals to persons for housing was slightly lower but other personal lending rose strongly.
Deposits of the other trading banks, which had grown rapidly in 1967/68, continued the strong upward movement in 1968/69, rising by over 10 per cent. Holdings of L.G.S. assets by this group grew substantially during the year, after falling in 1967/68; the growth in their advances eased considerably.
Savings Banks
Savings bank deposits increased by $490 million in 1968/69, a rise of 7.8 per cent. Although the rate of interest payable on these deposits was increased in August 1968, their growth during the year was at roughly the same rate as in other recent years. (See graph 11).
Graph 11
SAVINGS BANKS
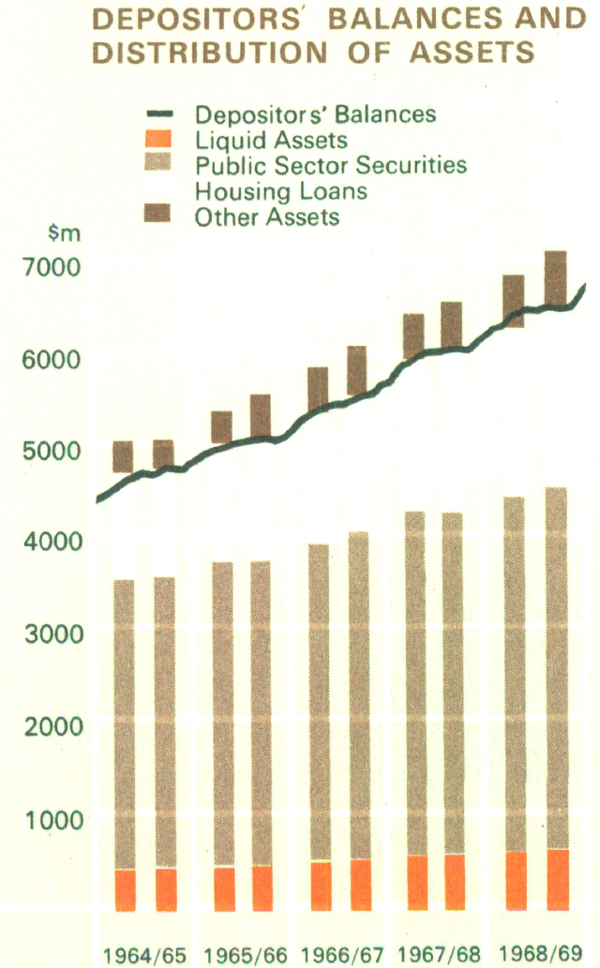
Savings bank L.G.S. assets increased less in 1968/69 than in the previous year and a large part of the increase was in the form of interest bearing deposits with the Reserve Bank; the increase in savings bank holdings of Government securities was substantially less than in 1967/68. Savings banks increased their holdings of local and semi-governmental securities at about the same rate as in 1967/68.
The high level of expenditure on housing during the year was reflected in a strong growth in the rate of new approvals for housing by savings banks. However, with repayments of housing loans also higher in 1968/69, the rate of increase in loans outstanding for housing declined slightly during the year and savings banks' share of total finance for housing probably declined. Other loans by savings banks grew more slowly.
Australian Resources Development Bank
The Australian Resources Development Bank Limited opened for business in March 1968 with the purpose of making finance available, both directly and through trading banks, for the development with local equity of Australia's natural resources. In its first full year of operation the bank grew rapidly. The funds of the bank have been derived largely from the public issue of medium-term transferable certificates of deposit; these have been supplemented by support from the major trading banks and the Reserve Bank. The Resources Bank made two issues of transferable certificates of deposit in 1968/69. Despite reductions in the interest rates offered on these, both were fully subscribed. Lending activities of the Resources Bank have been mostly by way of refinancing loans made by trading banks. Refinancing loans have encompassed large development projects relating mainly to mining ventures. By June 1969 loans outstanding were $61 million, compared with $11 million in June 1968.
Other Domestic Finance
The high tempo of economic activity in 1968/69 was reflected in most sections of the financial market. (See graph 12).
Graph 12
BANK AND NON-BANK FINANCING
ADVANCES OUTSTANDING
Seasonally Adjusted
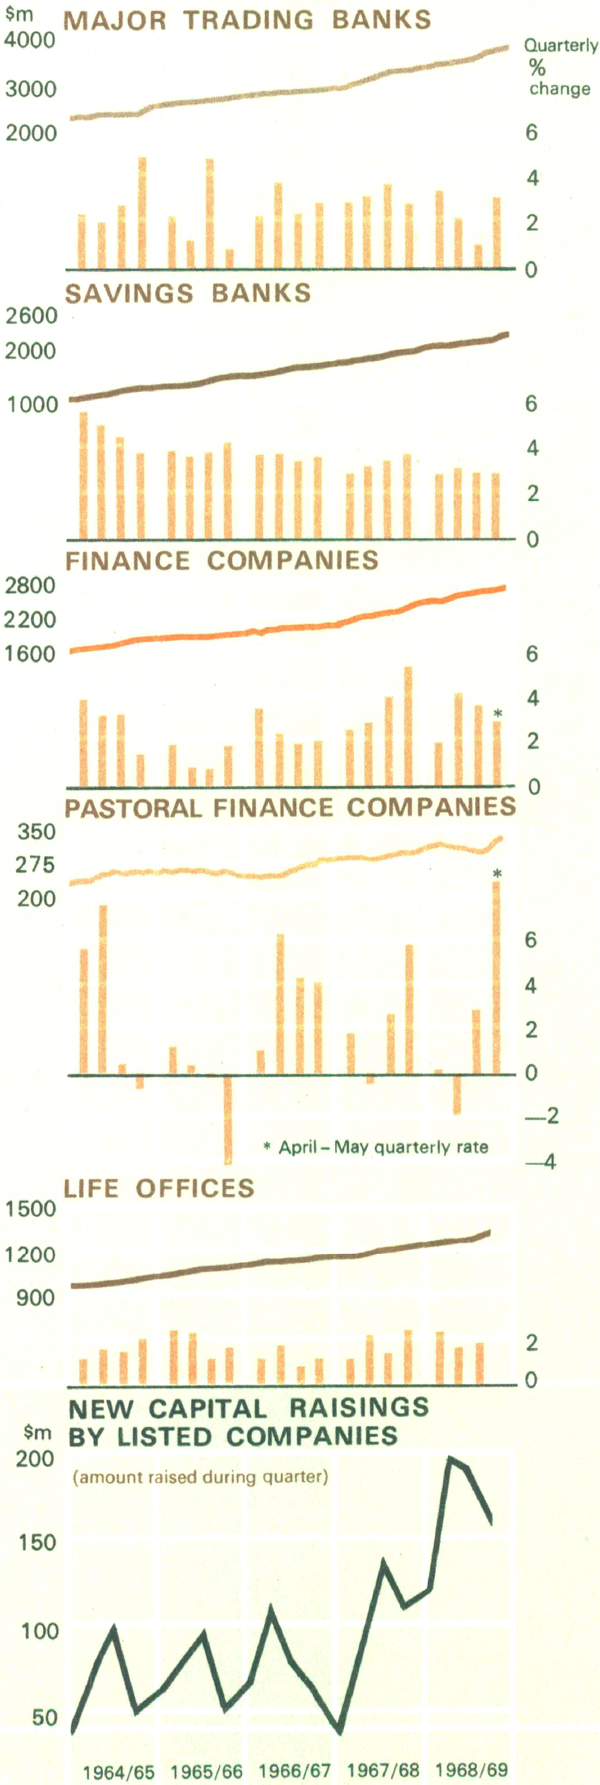
New capital raisings by listed companies through the issue of shares, debentures, notes and deposits were at a very high level in the first three quarters of 1968/69; the amount of new capital raised was 60 per cent above the unusually high level raised in the first three quarters of 1967/68. The increase in new raisings in the first half of 1968/69 was common to all major industrial categories but was greatest in commerce, where capital raisings had been low in 1967/68. In the second half of the year there appears to have been a strong expansion of capital raising by oil and mining companies. The proportion raised through shares in the first three quarters of 1968/69, 34 per cent, was above that in the same period of 1967/68. Financial institutions in Australia were more ready subscribers to new issues than they had been earlier but capital inflow was again an important factor in the high level of new raisings.
Life offices continued to expand in 1968/69 and the growth of 9 per cent in their total assets in the first three quarters of the year was faster than in the corresponding period of 1967/68. There was evidence of some change in the pattern of investment of life offices' funds in 1968/69. The proportion of total assets held in Commonwealth Government securities declined noticeably in the first three quarters of 1968/69; in part this reflected a decline in the relative attractiveness to life offices of Government securities, particularly after the removal of the tax rebate from bonds issued after November 1968. The proportionate decline in Government security holdings was partly offset by an increase in the proportion of total assets in local and semi-governmental securities and there was also an increase in the proportion of assets held in the form of corporate securities. Mortgage loans accounted for a smaller share of total assets at the end of March 1969 than a year earlier. There was a strong increase in new loans paid over by life offices in the first three quarters of 1968/69 and this was reflected in the expansion in loans outstanding. Mortgage loans for housing as a proportion of total loans outstanding continued the decline which has been evident for some years.
Estimates of borrowing and lending by permanent building societies in 1968/69 suggest a further strong growth of these institutions and an increase in their share of total housing finance. Loan approvals by permanent building societies were around 50 per cent higher than in 1967/68. In New South Wales permanent building societies now appear to be lending as much for housing as savings banks and in Western Australia about twice as much as savings banks.
Outstanding loans by finance companies continued to expand at a solid rate though the annual rate of increase over the first eleven months of 1968/69 was below that achieved in 1967/68. Outstanding balances of instalment credit for retail sales grew 12 per cent in the first eleven months of the year while other consumer and commercial loans (excluding loans at call or repayable within 90 days) rose by 17 per cent. Both these increases were about the same as in the previous year; other types of finance company lending, however, grew more slowly. The large increase in balances in respect of business equipment and plant on lease reflected a continued strong demand for this form of financing.
Rural advances by pastoral finance companies, which grew over 1967/68 — particularly in the last part of the year — declined in the early part of 1968/69. Increases in farm incomes enabled rural borrowers to repay debts and there was, in addition, an increased availability of funds from other sources. In the last months of 1968/69, however, an upward movement emerged again; the increase was strongest in New South Wales and Victoria. Clients' credit balances with pastoral finance companies, which fell very sharply over 1967/68 and the early months of 1968/69, rose strongly over the rest of the year.
Activity in the short-term money market was at a higher level in 1968/69 than in the previous year. Dealers' liabilities to clients rose strongly in the first three quarters of the year; much of this was due to increased loans from private non-bank clients but banks were also more substantial lenders to the market than in the corresponding period of 1967/68. In the last months of the year, however, there was a more than seasonal run-down in dealers' liabilities, probably due in part to some diversion of the private non-bank sector's funds into trading bank certificates of deposit, and over the year as a whole there was little change in the level of liabilities to clients. Use by dealers of last resort borrowing from the Reserve Bank was greater during 1968/69 than in the previous year.
In April 1969 it was announced that there would be modifications in the arrangements between the Reserve Bank and authorised dealer companies to allow dealers more flexibility in their operations. Dealers were given scope to handle a wider range of assets and it was decided to dispense with certain requirements which it was considered could be eliminated without prejudice to the efficient and safe operation of the market. The great bulk of dealers' funds continue to be invested in Government securities but these may now be securities maturing within five years instead of three years as formerly; the Bank now accepts only these securities as security for last resort loans to dealers. The range of assets available to dealers was also expanded to include short maturity non-bank commercial bills, as well as bank accepted or endorsed bills, and bank certificates of deposit maturing within five years; in addition a small part of dealers' funds may now be held in such other assets as they might choose. At the same time the Reserve Bank decided to withdraw, from a date to be announced, the requirement that dealers lodge “margins” of Government securities with the Reserve Bank.
At the time these changes in the arrangements between the Reserve Bank and authorised dealers were announced, it was mentioned also that, while the Bank would continue to ensure the liquidity of dealers' assets under the lender of last resort arrangements, contrary to the apparent impression of some lenders to the market the Bank does not accept, and never has accepted, responsibility for the repayment of loans to individual dealers nor for the general solvency of dealers.
In the first three quarters of the year most of the increase in dealers' portfolios was in Treasury notes. In the last quarter, however, as dealers' liabilities to clients declined from the seasonal peak, holdings of Treasury notes fell sharply to well below the level of June 1968 and bond holdings increased. The movement in 1968/69 followed a shortening in the maturity structure of dealers' portfolios during 1967/68, largely the result of uncertainty about the future course of interest rates. Dealers' holdings of commercial bills declined during the year; dealers took up some bank certificates of deposit and following the changes announced in April they included some other assets in their portfolios.
In recent years the range of financial services available to borrowers and lenders has expanded considerably, particularly with regard to such activities as arranging capital issues, underwriting, bill financing, portfolio management and unit trust promotion. Many of the specialised intermediaries recently established in this area of the financial market are associated with overseas banks or other financial institutions. In 1968/69 there was further growth in their operations.
Activity on stock exchanges was again at high levels in 1968/69. Stock exchange prices had risen spectacularly in 1967/68, increasing by about 70 per cent over the year. Share prices fell towards the end of the first quarter of 1968/69 but gradually recovered to new record levels early in 1969. In the latter part of the year, however, prices again declined and there was an overall decline of about 4 per cent during the year. As in 1967/68, mining and oil stocks accounted for much of the volatility in share prices during the year. Overseas portfolio investment has been a major factor in the stock exchange boom but some financial institutions in Australia also appear to be taking a more active interest in equity investment.
Despite the strong demand for funds, conditions in financial markets in 1968/69 were fairly easy and there was little movement in private non-bank interest rates. (See graph 13). Rates on debentures issued by the finance companies affiliated with major trading banks were virtually unchanged and there was little change in interest rates charged by life offices. The weighted average interest rate on loans to short-term money market dealers increased by a small amount over the year.
Graph 13
INTEREST RATES
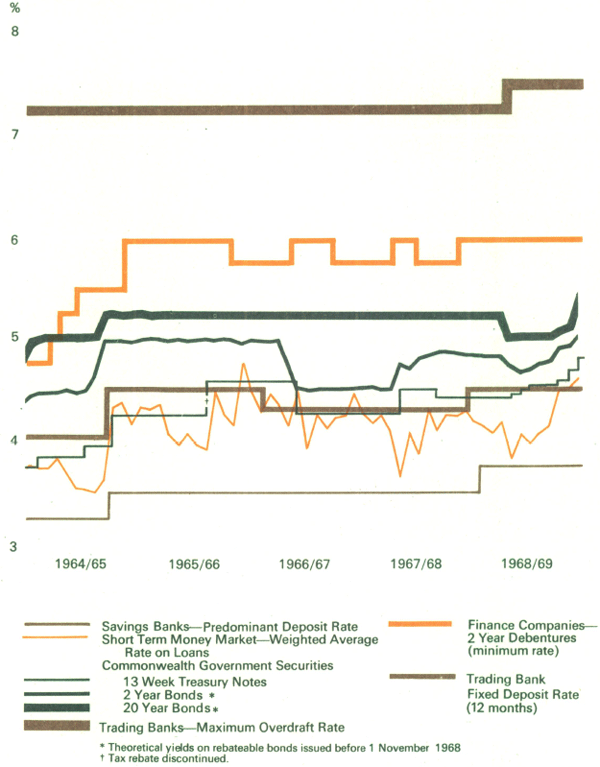
For some time Australian interest rates have been generally below those in the main overseas financial centres. Recently, this gap has widened appreciably. The greater gap between Australian and overseas interest rates, however, has not exerted strong pressure on Australian rates, either through the domestic market or through the balance of payments. To some extent, the difference between rates in Australia and overseas may be explained by expectations of higher rates of increase in domestic prices in certain overseas countries and lack of confidence about future currency values. In addition, the pressure of overseas rates on the Australian market has been lessened by restrictions on investment abroad by Australian residents and the absence of a free market in foreign exchange, by the “guidelines” control over borrowing in Australia by overseas interests and by arrangements for the financing of some of Australia's trade through bills of exchange linked to interest rates in London and New York. Another part of the explanation lies in the fact that expected returns on equity investment have been responsible for a large part of the recent capital inflow to Australia. However, Australian interest rate policy must have continuing regard to overseas rates if it is to maintain Australia's attractiveness to foreign investors and avoid an increasing burden on existing domestic controls.