RDP 2018-02: Affine Endeavour: Estimating a Joint Model of the Nominal and Real Term Structures of Interest Rates in Australia 4. Results
February 2018
- Download the Paper 1,673KB
The estimates presented below, particularly the point estimates of the expected rates and premia, are necessarily subject to a degree of uncertainty. While assessing the exact degree of model uncertainty is beyond the scope of this paper, we note that the estimates of expected rates and premia from a range of different specifications are quite similar, at least in terms of the broad trends observed over time. As such, we caution against interpreting the point estimates too precisely and rather suggest focusing on the broad trends.
4.1 Parameter Estimates and Model Fit
Table 1 contains the parameters estimates. Each column refers to the coefficients associated with one of the pricing factors, with columns 1–3 relating to the nominal factors, and 4–5 to the real factors. The implied steady-state rates of one-period inflation, nominal and real interest rates are all near their sample averages, at around 2.7 per cent, 4¾ per cent and 2 per cent, respectively.
| Parameter | Index number (i) | ||||
|---|---|---|---|---|---|
| 1 | 2 | 3 | 4 | 5 | |
| μ | 0.0028 | 0.0029 | 0.0006 | 0.0151 | 0.0088 |
| (∑)1i | 0.0091 (0.0003) |
0 | 0 | 0 | 0 |
| (∑)2i | 0.0003 (0.0004) |
0.0039 (0.0040) |
0 | 0 | 0 |
| (∑)3i | −0.0008 (0.0001) |
−0.0004 (0.0002) |
0.0010 (0.0000) |
0 | 0 |
| (∑)4i | −0.0022 (0.0018) |
0.0124 (0.0012) |
0.0000 (0.0015) |
0.0130 (0.0012) |
0 |
| (∑)5i | 0.0003 (0.0011) |
0.0062 (0.0006) |
0.0008 (0.0010) |
0.0065 (0.0008) |
0.0021 (0.0001) |
| (θ)1i | −0.0321 (0.0096) |
−0.0569 (0.0187) |
0.2452 (0.1252) |
−0.0230 (0.0199) |
−0.0303 (0.1081) |
| (θ)2i | −0.0152 (0.0042) |
−0.0303 (0.0064) |
−0.0432 (0.0834) |
−0.0173 (0.0072) |
−0.2026 (0.0459) |
| (θ)3i | 0.0075 (0.0026) |
0.0083 (0.0060) |
−0.2439 (0.03146) |
−0.0040 (0.0045) |
−0.0297 (0.0222) |
| (θ)4i | −0.1005 (0.0065) |
−0.0179 (0.00099) |
−0.3810 (0.3707) |
−0.2119 (0.0310) |
−1.0863 (0.0817) |
| (θ)5i | −0.0584 (0.0028) |
−0.0337 (0.0033) |
−0.1100 (0.2027) |
−0.1027 (0.0150) |
−0.6563 (0.0343) |
 |
0.0011 (0.0014) |
na | na | na | na |
| (J(λQ))ii | 0.0016 (0.0005) |
0.0001 (0.0000) |
−0.0569 (0.0000) |
−0.0570 (0.0000) |
−0.0571 (0.0000) |
 |
0.9386 (2.6301) |
na | na | na | na |
 |
−2.6314 (0.9978) |
−5.2186 (0.2289) |
13.0309 (11.4786) |
0.6385 (2.7922) |
−0.5257 (2.9675) |
| Measurement errors | |||||
| σmeasurement(×100) | 0.0382 (0.0005) |
na | na | na | na |
 |
0.0396 (0.0020) |
na | na | na | na |
 |
0.0036 (0.0001) |
na | na | na | na |
 |
0.0045 (0.0001) |
na | na | na | na |
 |
0.0017 (0.0002) |
na | na | na | na |
| σ cash rate | 0.0037 (0.0001) |
na | na | na | na |
| Selected additional parameters from standard representation | |||||
| ρ0 | 0.0001 | na | na | na | na |
| ρ1 | 0.2198 | 0.7252 | 1.2052 | 0.0172 | −0.0315 |
| ρ1 (× std dev of factor) | 0.0134 | 0.0084 | 0.0029 | 0.0003 | −0.0001 |
| π0 | 0.2924 | na | na | na | na |
| π1 | −1.7944 | −0.9260 | −6.3268 | −3.6458 | −20.9081 |
| π1 (× std dev of factor) | −0.1092 | −0.0107 | −0.0152 | −0.0623 | −0.0573 |
|
Notes: Standard errors in parentheses, μ is calibrated to the sample mean of the pricing factors and so no standard errors are given; μ, ∑ and θ in the top panel are under the standard representation while the other parameters are from the JSZ representation; no standard errors are given for the parameters in the bottom panel under the standard representation as they are subject to a number of complex cross-equation restrictions, as given by the mapping between the two representations – see Appendix B |
|||||
Focusing first on the parameters that drive the short-term nominal interest rate and inflation rate expressed under the standard representation (i.e. Table 1, bottom panel), ρ1 and π1, one can see that, perhaps unsurprisingly, the nominal interest rate is mainly affected by the nominal factors (factors 1–3).[17] In particular, the factors associated with the level (factor 1) and, to a lesser extent, the slope (factor 2) of the yield curve play the largest roles once we account for the relative volatility of the factors. Meanwhile, all factors are important in explaining inflation.[18]
The degree of persistence in the pricing factors is determined by the eigenvalues of the θ matrix; in a univariate model for example, an eigenvalue of 0 indicates very high persistence (in fact, a non-stationary random walk), and an eigenvalue of −1 indicates no persistence (white noise).[19] The largest eigenvalue of the θ matrix is quite close to (but below) 0, indicating that some of the factors are very persistent. This is promising as it indicates that the model is accounting for gradual trends in interest rates or inflation that may not mean-revert for many years. Moreover, it suggests that the surveys are helping to ameliorate potential small-sample issues, which often manifest as pricing factors that are too quick to mean-revert, and suggests that expected future rates at longer horizons will not simply be flat.
The estimated variance of the survey errors is much lower than in either Finlay and Chambers (2009) or Finlay and Wende (2012), where the variance was calibrated rather than estimated. As such, the model puts more weight on the surveys than was the case in these previous papers. This appears to be particularly important for long-term inflation expectations (discussed further in Section 4.2).
To check how well the model fits the data, we calculate the root mean squared error between the modelled and observed yields at various maturities (Table 2). The model fits both the nominal and real yield data quite well, with a root mean squared fitting error of around 5 basis points at the 12-month horizon (where the bond market can be relatively illiquid), and the fit generally improving for longer maturities.
| Maturity (months) | ||||
|---|---|---|---|---|
| 12 | 36 | 60 | 120 | |
| Nominal bonds | 5.3 | 3.4 | 3.4 | 2.8 |
| Real bonds | na | 7.7 | 3.2 | 1.9 |
4.2 Expected Future Rates and Risk Premia
In this section we focus on model-implied forward rates. This is because the x-year forward rate exactly represents expectations of the future short-term rate x years ahead and so is easy to interpret. By contrast, the x-year yield represents an average of expected short-term rates between now and x years ahead, which is harder to interpret.
We can use the model to decompose risk-neutral forward rates (which incorporate risk premia) into expected future short-term rates and the various risk premia. The real risk-neutral forward rate observed at time t for time t + n in the future can be written as:
where  is the expected real short-term interest rate and
  is the real term premium. The real term premium is paid to/by investors to lock in real rates for an extended period. Real term premia are generally found to be countercyclical to the business cycle and higher when there is more uncertainty regarding future growth and interest rates (e.g. Abrahams et al 2016). As specified here, the real term premium also incorporates a ‘relative liquidity premium’ to compensate investors for the fact that inflation-indexed bonds are not particularly liquid (discussed more below).
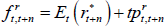
The nominal risk-neutral forward rate observed at time t for time t + n in the future is defined as:

where Et(rt+n) is the expected nominal short-term interest rate (which in turn can be decomposed as  plus expected inflation Et(πt+n)), and irpt,t + n is the inflation risk premium which is paid to/by investors to lock in an exposure to a set rate of inflation for an extended period. These premia are also generally found to be countercyclical to the business cycle and higher when there is more uncertainty regarding future inflation (e.g. Abrahams et al 2016; Buraschi and Jiltsov 2005). As defined here, and mirroring the real term premium case, the inflation risk premium incorporates a negative relative liquidity premium to account for the fact that nominal bonds are more liquid than inflation-indexed bonds. A more negative relative liquidity premium will contribute to a lower measured inflation risk premium, as can be seen from the break-even inflation rate (often used as a measure of market-implied inflation expectations):
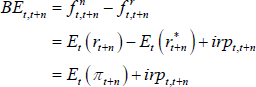
For a given level of Et(πt+n), a more negative relative liquidity premium in nominal bonds will mean that all else equal, irpt,t + n is lower and so BEt,t + n is lower.
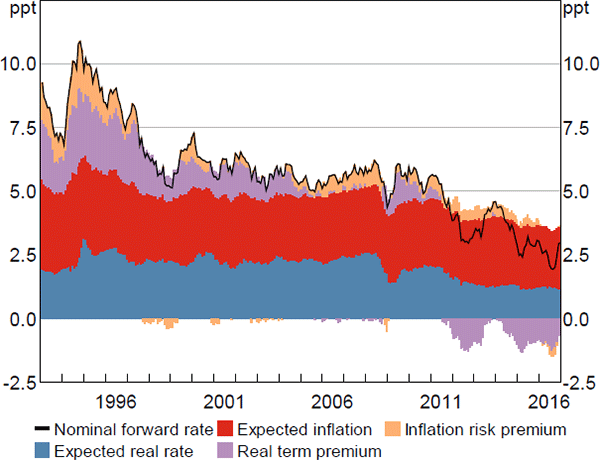
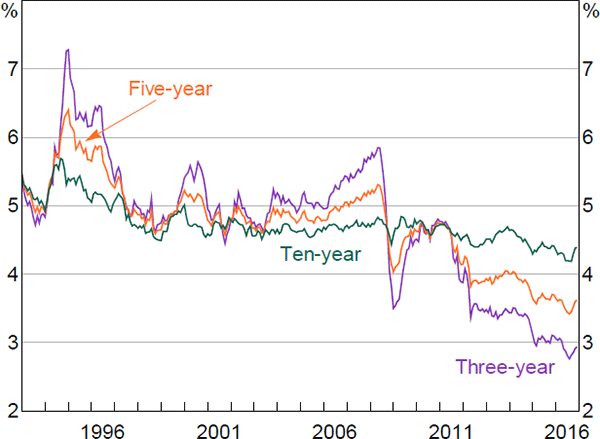
Figure 3 shows the decomposition of five-year-ahead nominal forward rates. Nominal forward rates have declined consistently over the sample period, largely reflecting declining real term premia and inflation risk premia. In comparison, expected real and inflation rates have been more stable, although have nonetheless also declined somewhat relative to the levels in the 1990s. We discuss each of these in more detail below.
Focusing first on expected short-term nominal interest rates, estimated expectations have declined since the early 1990s (Figure 4). The initial decline coincided with a shift lower in inflation, associated with the introduction of inflation targeting by the Reserve Bank, while rates declined further in the period following the global financial crisis. More broadly, expected nominal interest rates follow a generally procyclical pattern and ten-year-ahead expected rates tend to be less volatile than shorter tenor expectations, as anticipated.
The estimates follow a very similar pattern to Jennison (2017), and also to that implied by a purely nominal model that we estimated using a similar methodology.[20] This provides a good crosscheck. It also suggests that we don't lose much information when using a simpler nominal model and so it may be preferable to use such a model when we are only interested in developments in nominal rates.
Expected inflation was relatively high and volatile early in the sample, but has fallen and become more stable over time (Figure 5). In particular, inflation expectations decreased substantially after the introduction of the inflation-targeting regime in the mid 1990s, though, consistent with other analyses (e.g. Finlay and Wende 2012; Moore 2016), the results suggest that it took a number of years for expectations to become anchored around the target. The fact that inflation expectations jump prior to the introduction of the goods and services tax (GST) in July 2000 appears to, in part, reflect data issues. Specifically, there were no inflation-indexed bonds with relatively short maturities trading at this time. As such, the real yield data would not be providing any useful information to help the model evaluate the temporary nature of any increase in inflation expectations.[21] The spike in ten-year-ahead inflation expectations in 2009 is somewhat surprising, although it is borne out in the survey data.[22] The model suggests that expectations of future inflation a number of years out have declined a bit over recent years, but that the decline is modest and that expectations have remained entrenched in the target range of 2 to 3 per cent.
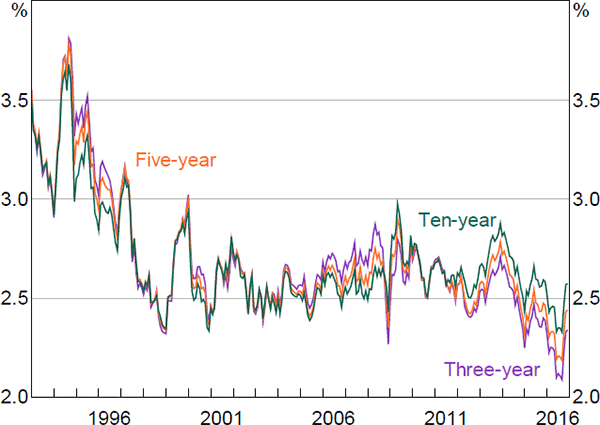
Interestingly, the estimates of expected inflation are more volatile than those from Finlay and Wende (2012), especially at long horizons. In part, this seems to reflect the fact that the model puts a greater weight on the five-year five-year forward survey data on inflation expectations, which were relatively volatile early in the sample. Nevertheless, the overall profile is similar between the two models.
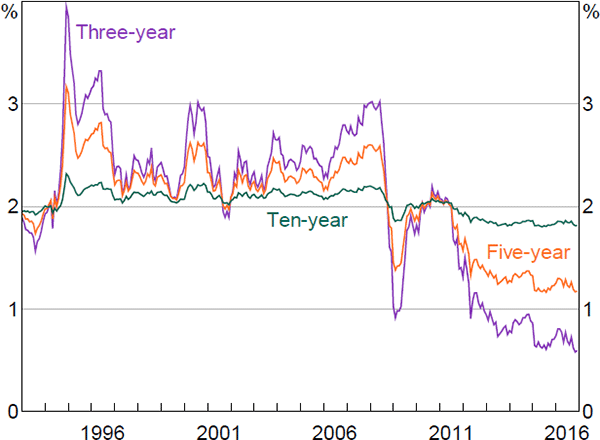
Estimates of expected future real short-term interest rates have also declined somewhat over recent years (Figure 6). For example, estimated five-year-ahead real rates have declined by around 1 percentage point since 2011, while ten-year-ahead real rates have declined by around ¼ percentage point. As these reflect expectations of real short-term interest rates in the relatively distant future, they can be interpreted as market measures of the neutral real interest rate (e.g. Christensen and Rudebusch 2017). As such, the results suggest that Australian neutral real interest rates have declined over recent years, though the decline implied by these market measures is muted relative to the decline implied by some other measures.[23]
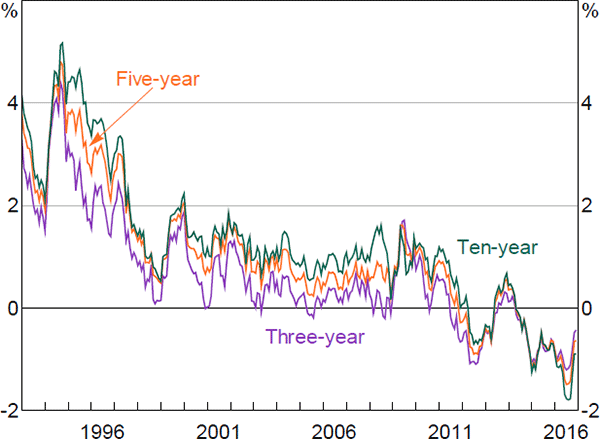
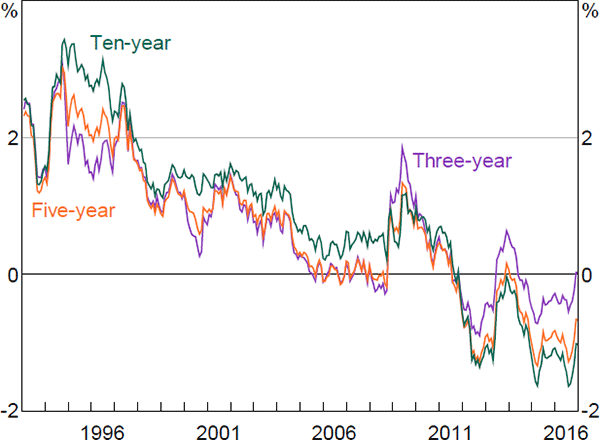
Shifting to term premia, the nominal term premia in Figure 7 (real plus inflation risk premium) declined in the early to mid 1990s, and remained low during the mid 2000s when uncertainty regarding inflation and growth, measured as the dispersion of analyst forecasts, was relatively low. This period is also referred to as the ‘Great Moderation’. The premia spike at the onset of the global financial crisis, a period of heightened economic uncertainty, and again in 2013 during the so-called ‘taper tantrum’ in the United States, when yields on US government bonds increased sharply in response to suggestions that the Federal Reserve would taper its quantitative easing program. Notwithstanding these episodes, premia have been particularly low for most of the period since the financial crisis. This could reflect spillovers from foreign central bank quantitative easing programs, which have been found to affect Australian bond markets through the so-called ‘portfolio balance’ channel (e.g. Bauer and Neely 2014; Neely 2015).
The influence of overseas developments is more evident in Figure 8, where we plot our estimates of 10-year average nominal term premia alongside two sets of estimates for the United States: one produced by the New York Federal Reserve, using the methodology laid out in Adrian et al (2013); and the other produced by the Board of Governors of the Federal Reserve System, using the methodology laid out in Kim and Wright (2005).[24] All three series follow broadly similar paths, though our estimates follow those from Kim and Wright particularly closely. The fact that our estimates of term premia for Australia are below those for the United States for at least part of the sample is somewhat surprising, though it is also the case for the estimates from Finlay and Chambers (2009) and Jennison (2017). One explanation could be the relative scarcity of AGS, particularly given there are relatively few other AAA-rated Australian dollar-denominated securities available. Another could be that the US models do not account for the zero lower bound, and this could be affecting estimated US term premia. In any case, one should not place too much weight on the precise estimated level of the series.
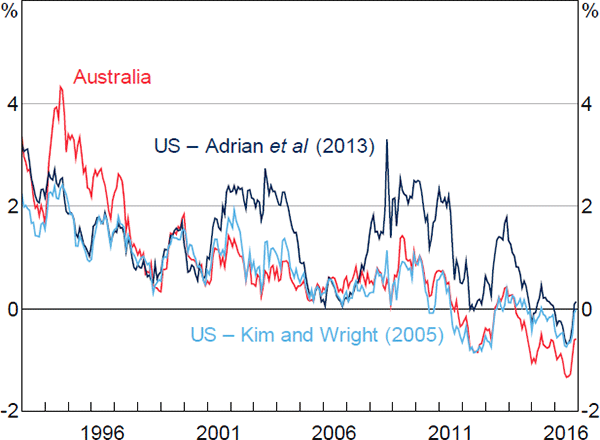
Sources: Authors' calculations; Board of Governors of the Federal Reserve System; Federal Reserve Bank of New York; Federal Reserve Bank of St. Louis
Our estimates of nominal term premia are broadly similar to those in Jennison (2017), although some differences exist: our measure spikes more sharply in 2009 during the peak of the financial crisis and in 2013 during the taper tantrum, and is slightly lower during the mid 2000s. It appears that these differences reflect the use of surveys to ameliorate the small-sample issues, rather than bootstrapping, and not the fact that we estimate a joint model of nominal and real yields instead of a purely nominal model.[25]
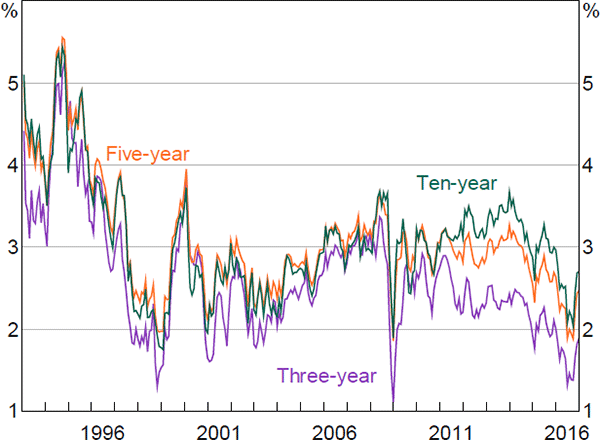
To get a better understanding of the evolution of nominal term premia, we can examine its components: the real term premium and the inflation risk premium. Real term premia declined during the late 1990s and early to mid 2000s (Figure 9), which coincided with a period of relatively strong economic growth and falling unemployment. The particularly sharp decline in real term premia in the early to mid 2000s has been documented for the United States (Abrahams et al 2016) and the United Kingdom (Joyce, Kaminska and Lildholdt 2012). Some have attributed it to a global ‘search for yield’ associated with perceptions of greater macroeconomic stability and excess liquidity (Joyce et al 2012). Real term premia also declined sharply over the early years of the financial crisis, and appear to have driven most of the decline in nominal term premia seen during this period. This is consistent with Abrahams et al (2016) finding that the Federal Reserve's quantitative easing program primarily lowered real term premia.
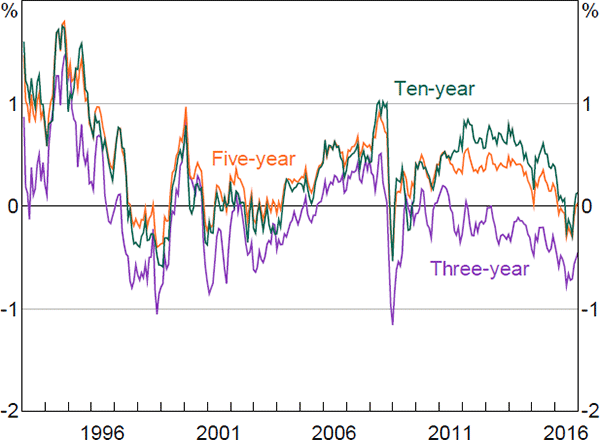
Estimated inflation risk premia (Figure 10) are reasonably similar to those estimated in Finlay and Wende (2012). Inflation risk premia declined sharply in the mid to late 1990s. This coincided with a sharp decline in survey measures of both uncertainty regarding future inflation and of expectations for the level of inflation as the Reserve Bank's inflation target gained credibility. Inflation risk premia spiked temporarily around the introduction of the GST. They were also quite volatile around the start of the global financial crisis, with three-year premia in particular first falling sharply and then rising. Christensen, Lopez and Rudebusch (2010) observe a similar phenomenon around the crisis with US data, and suggest that, similar to the discussion above, a sharp fall in the relative liquidity premium associated with nominal bonds over inflation-indexed bonds manifested in a lower inflation risk premium, which was subsequently unwound as liquidity returned to the inflation-indexed bond market. We can also see that much (although not all) of the decline and subsequent reversal in break-even inflation rates around 2016 seems to have reflected movements in inflation risk premia (Figures 10 and 11). This could reflect changes in uncertainty regarding future inflation outcomes, or potentially changes in the relative liquidity premium for inflation-indexed versus nominal bonds.
Overall, and similar to Abrahams et al (2016), our results suggest that while expectations for future short-term nominal, real and inflation rates vary over time, changes in risk premia tend to have a greater influence than changes in expectations on movements in observed yields and measures of break-even inflation, at least over short time horizons. This emphasises the importance of not taking changes in observed yields at face value when trying to infer market expectations.
Footnotes
Although the pricing factors used in the final model are generated by the Kalman filter, and therefore, in principal, can differ substantially from the original factors (including in that we no longer enforce orthogonality), in practice they are very similar to the original factors and so for ease of exposition we refer to them interchangeably. [17]
Using the logic that ‘nominal = real + inflation’, one might expect the parameters associated with the nominal factors in π1 to be positive and the parameters associated with the factors extracted from real data to be negative, similar to how one calculates break-even inflation. This is not the case, as: (i) the situation is not quite as simple as the above equation implies as we are interested in specifying the short-term inflation rate, but we are using long-term yield data that includes term and risk premia as well as expectations; (ii) the pricing factors themselves have both positive and negative loadings on the underlying yield data (see Figures 1 and 2); and (iii) the real data are first orthogonalised with respect to the nominal factors. [18]
Recall that θ is defined via ΔXt + 1 = μ + θXt + ∑εt + 1 rather than the more traditional Xt + 1 = μ + θXt + ∑εt + 1; in the latter case, the estimated values of θ would be one unit higher for all diagonal entries. [19]
Specifically, we estimated a model of nominal rates using the methodology outlined in Adrian et al (2013), but extended to include cash rate forecasts. [20]
Measures of unions' long-term inflation expectations did increase sharply around this time, so it is conceivable that the spike is not purely a statistical artefact. [21]
Specifically, surveys of five-year five-year forward inflation expectations increase relative to expectations three to four years ahead; this implies a relatively large change in quite long-term expectations. [22]
For further analysis, see McCririck and Rees (2017). [23]
The Kim and Wright (2005) methodology incorporates surveys, while the Adrian et al (2013) methodology only uses yield data. For a more detailed comparison of the models and their estimates, see Li, Meldrum and Rodriguez (2017). [24]
We estimated a purely nominal model incorporating surveys of cash rate expectations, and the estimated term premia were very similar to those produced by the joint model. [25]