RDP 2009-03: Competition Between Payment Systems: Results 5. Payment Instrument Choice and Platform Pricing
April 2009
We now turn in greater detail to the issue of how competing platforms' relative pricing to the two sides of the market is affected by which side holds the choice of payment instrument at the moment of sale. We focus on this for the case where platforms charge both sides of the market on a per-transaction basis, as in our PTP model. An attractive feature of this model is that – at least whenever there are no per-cardholder costs to platforms (g = 0) – the only asymmetry between the merchant and consumer sides relates to who holds this final choice of instrument. Hence, any tilting of platforms' pricing for or against consumers in this setting can be safely attributed purely to this factor.
In our basic PTP model it is consumers who have the final choice of payment instrument at the moment of sale. In principle, this might push competing platforms' pricing to the two sides of the market either way. On the one hand, it could drive down each platform's relative pricing to consumers, as platforms compete to persuade consumers to direct transactions to them rather than a rival. Equally, however, it could lead platforms to tilt their relative pricing in favour of merchants, to minimise the impact on their profits from merchants seeking to influence consumers' payment choices via steering.
The results for Scenario 1 in Table 1 show that, for our PTP model with no per-cardholder or per-transaction costs to platforms (g = c = 0), it is the latter effect which wins out – with consumers being charged more per transaction than merchants (0.314 versus 0.262). This phenomenon, whereby (symmetric) competing platforms price less attractively to the side which holds the ultimate choice of instrument, was previously observed (in the context of network routing rules) by Hermalin and Katz (2006).[18] We refer to it henceforth as the Hermalin and Katz phenomenon.
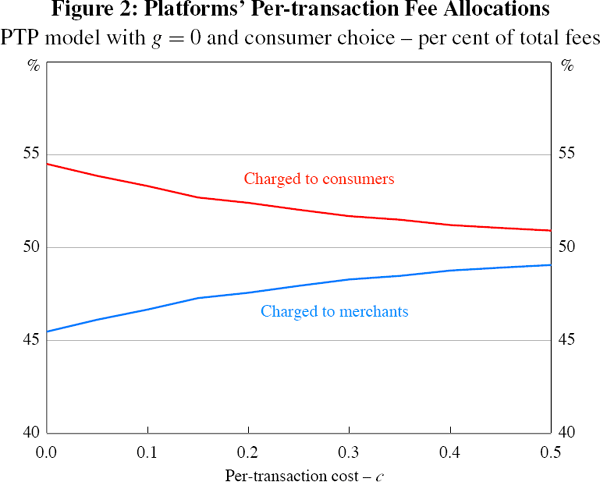
Hermalin and Katz also observed that the strength of their phenomenon declines as platforms' per-transaction costs (c) rise. An illustration of this can be seen in our results, by comparing the PTP model results for Scenarios 1 and 2 in Table 1. In Scenario 2, while a higher c (0.5 versus 0) results in platforms charging higher per-transaction prices to both sides, the difference in fm values is greater than it is for fc,*. The upshot is that merchants must bear 49.2 per cent of platforms' total per-transaction fees in Scenario 2, compared with only 45.5 per cent in Scenario 1. More generally, this further finding of Hermalin and Katz can be replicated using our PTP model by simulating the model for a range of c values. Figure 2 shows platforms' allocations of their total per-transaction fees between the two sides of the market as c varies, clearly displaying the expected monotonic downward trend in the consumer share of platforms' total fees.[19]
It is worth noting a simple but important point about the source of the tilting we observe in platforms' pricing, in favour of merchants, in our PTP model with g = 0. We noted earlier that platforms might be motivated to offer such favourable pricing to merchants to discourage them from steering consumers. It should be emphasised, however, that the key to merchants receiving preferential pricing is not their scope to steer per se, but their scope to do so in the presence of competition between platforms. With such competition, the threat of steering creates a risk for each platform, lest they lose transactions to their rival as a result of merchant steering. It is this possibility of lost profit which generates downward pressure on each platform's relative pricing to merchants as a bloc. By contrast, were both platforms operated by a monopoly provider of card payment services, any steering by merchants, to the extent that it simply shifted card payments between platforms, would be of no concern to the monopolist. Hence, while such steering might also see a small number of card payments lost to cash, the pressure on a monopolist to hold down prices to merchants, due to the threat of steering, would be much weaker than in the duopoly case. This can be formally confirmed by comparing the results for our PTP model for Scenarios 1 and 2 under monopoly (Table 2) with those for the duopoly case (Table 1).
| Variable | Scenario 1 | Scenario 2 | Scenario 3 | ||||||||
|---|---|---|---|---|---|---|---|---|---|---|---|
| g = c = 0 | g = 0, c = 0.5 | g = 0.2, c = 0 | |||||||||
| CR | ECR | PTP | CR | ECR | PTP | CR | ECR | PTP | |||
| Platform fees | |||||||||||
 |
0.375 | 0.375 | – | 0.324 | 0.324 | – | 0.473 | 0.471 | – | ||
 |
0.500 | 0.500 | 0.370 | 0.593 | 0.593 | 0.522 | 0.593 | 0.593 | 0.620 | ||
 |
– | 2.000 | – | – | 1.310 | – | – | 2.892 | – | ||
 |
0.250 | 0.250 | 0.432 | 0.453 | 0.453 | 0.538 | 0.203 | 0.205 | 0.294 | ||
| Consumer market fractions | |||||||||||
 |
0.250 | 0.250 | 0.137 | 0.352 | 0.352 | 0.272 | 0.352 | 0.352 | 0.384 | ||
 |
0.375 | 0.375 | 0.233 | 0.324 | 0.324 | 0.250 | 0.324 | 0.324 | 0.236 | ||
 |
0.000 | 0.000 | 0.198 | 0.000 | 0.000 | 0.114 | 0.000 | 0.000 | 0.072 | ||
| Merchant market fractions | |||||||||||
 |
0.063 | 0.063 | 0.187 | 0.206 | 0.205 | 0.289 | 0.041 | 0.042 | 0.086 | ||
 |
0.188 | 0.188 | 0.320 | 0.248 | 0.248 | 0.282 | 0.162 | 0.163 | 0.266 | ||
 |
0.563 | 0.563 | 0.174 | 0.299 | 0.300 | 0.146 | 0.635 | 0.632 | 0.384 | ||
| Other | |||||||||||
| Πi | 0.211 | 0.211 | 0.222 | 0.097 | 0.097 | 0.105 | 0.141 | 0.141 | 0.124 | ||
| Voli | 0.281 | 0.281 | 0.277 | 0.177 | 0.178 | 0.188 | 0.258 | 0.258 | 0.219 | ||
| + |
0.750 | 0.750 | 0.802 | 1.047 | 1.045 | 1.060 | 0.797 | 0.798 | 0.914 | ||
| AvgPPTi | 0.750 | 0.750 | 0.802 | 1.047 | 1.045 | 1.060 | 0.797 | 0.798 | 0.914 | ||
| / AvgPPTi |
0.333 | 0.333 | 0.539 | 0.433 | 0.433 | 0.508 | 0.255 | 0.257 | 0.322 | ||
| Notes: CR denote the Chakravorti and Roson model; ECR denotes the Extended Chakravorti and Roson model; and PTP denotes the Per-transaction Pricing model. For simplicity, results are shown in units such that C and M both equal 1, and the common value of τ and μ is also 1. Voli denotes the volume of transactions that take place on platform i, while AvgPPTi denotes the average price per transaction on platform i. Notation for all other variables is as in Gardner and Stone (2009a) – see also Appendix A | |||||||||||
In Scenario 1 we see that, when a monopoly owner operates both platforms, the relative pricing to merchants versus consumers is reversed, with consumers now receiving the (relatively) more favourable deal (fc,* = 0.370 versus fm = 0.432).[20] The same reversal is evident in the results for Scenario 2 – although, as in the duopoly case, the effect of c being higher is to mute the extent of the tilting of platforms' prices in favour of consumers. Overall, for our PTP model, possessing the final choice of payment instrument thus generates a benefit even ex ante for consumers in the monopoly case – unlike in the duopoly case – in terms of the pricing they receive from platforms compared with merchants.
Returning to the case of competing platforms, our results thus far have merely confirmed earlier findings of Hermalin and Katz (2006). We turn now to the task of trying to extend these findings, using our basic PTP model and some natural generalisations of it. One such possible extension is to ask: how does the strength (or even the direction) of the Hermalin and Katz phenomenon vary as platforms' per-subscriber costs of signing up new cardholders, gi Ξ gj Ξ g, rise?
This is not as straightforward as for the case of increasing c. Unlike there, a non-zero value for g in our PTP model creates an inherent asymmetry between the two sides of the market. Hence, we cannot simply simulate the model for a range of g values and then study how platforms' relative pricing to consumers and merchants changes over this range. Rather, to isolate the effect on platforms' relative pricing of which side has the choice of payment instrument it is necessary to construct a new model, identical to our basic PTP model in every respect except that the choice of instrument is instead taken to lie with merchants.[21] It is then possible to study how changes in g affect the Hermalin and Katz phenomenon by:
- simulating both our basic PTP model and this new variant of it for a range of g values; and
- for each g value comparing how platforms' relative pricing to consumers and merchants differs between the two models.
The results are shown in Figure 3. The top panel shows competing (symmetric) platforms' per-transaction prices to both consumers and merchants in the two models, as g varies. The bottom panel then shows these prices as a proportion of platforms' total per-transaction fees (so as to abstract from the increase in these total fees which accompanies an increase in g in both models).
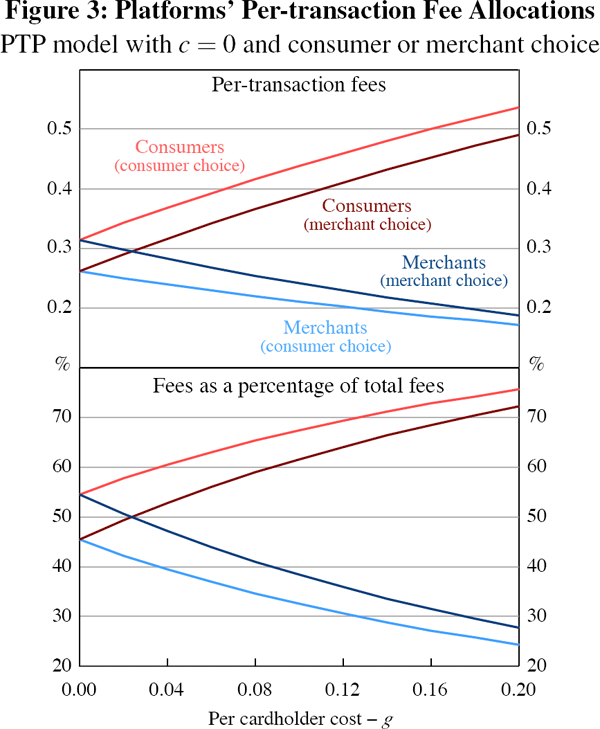
Focusing first on the bottom panel of Figure 3, the upward slopes of the lines showing the consumer shares of platforms' total fees indicate that, in both models, the direct effect of a rise in g is to tilt competing platforms' pricing in favour of merchants and against consumers. However, of greater present interest is that the gap between the two consumer lines gradually decreases, as g increases. It is this gap which represents the effect on platforms' relative pricing due purely to which side of the market holds the final choice of payment instrument.
We see that as g rises the strength of Hermalin and Katz's phenomenon, whereby platforms price less favourably to whichever side holds the choice of instrument, gradually declines (just as happened with a rise in c). Indeed, our results show that this weakening of the phenomenon, as g rises, occurs not just in proportional terms (bottom panel) but even in absolute terms (top panel). For merchants it is clear in the top panel that this absolute difference between the prices charged to them by platforms, depending on who holds the choice of payment instrument, decreases in our PTP framework as g rises. Although it does not show through as strongly, this pricing gap also declines in absolute terms for consumers (falling from 0.052 when g = 0 to 0.046 when g = 0.2).
Finally, we would also like to investigate how, in a world of per-transaction pricing, the strength (or even direction) of Hermalin and Katz's phenomenon varies as a function of consumers' innate propensity to single-home. To address this issue we take up the option flagged in Section 4.2 and incorporate into our PTP model a new parameter κ – representing the disutility to consumers from holding more than one card. A higher value for κ then corresponds to a greater innate propensity on the part of consumers to single-home, independent of any price-related incentives.
We then consider two variants of this ‘PTP model with κ’ – one with consumer choice of the payment instrument and the other with merchant choice – and compare how competing platforms' pricing to the two sides of the market differs across the two models, for different values of κ.[22] As in the case of varying g, this approach allows us to isolate how the nature of the Hermalin and Katz phenomenon varies, as consumers' innate propensity to single-home increases.
Doing this in the case of c = 0 and g = 0 we find that, for small κ values up to a threshold of around 0.035, the situation is complicated by the apparent existence of multiple feasible Nash equilibria in the model with consumer choice. Understanding the factors generating this non-uniqueness of potential duopoly pricing outcomes, and how it might be resolved in practice by competing platforms, would be interesting. However, it would take us beyond our current focus on the Hermalin and Katz phenomenon, so we do not pursue it further in this paper. Rather, we focus on platforms' pricing behaviour in the two models for κ values above this threshold, for which uniqueness of the Nash equilibrium, under duopoly, holds in both.
For such κ the direction of the Hermalin and Katz phenomenon remains invariant – as usual, biasing platforms' pricing against the side with the final choice of payment instrument – but its strength once again declines as κ increases. This is evident in the narrowing gap between (say) the two consumer lines in Figure 4.[23] It accords with the intuition that, as consumers' propensity to single-home rises, the competitive pressure on platforms to forestall ‘steering’ by whichever side does not hold the choice of instrument, by pricing attractively to that side, diminishes.[24]
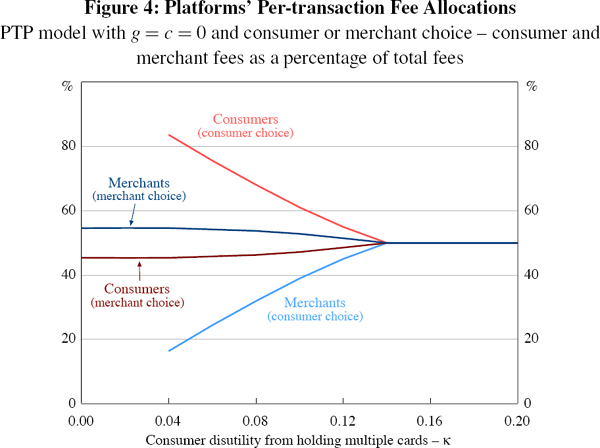
This decline in the strength of the Hermalin and Katz phenomenon continues until competing platforms' preferred pricing, in both variants of the model with κ, makes multi-homing unpalatable to all consumers (κ ≥ 0.136). Consumers and merchants are then charged equally in both models – at fee levels which are the same across the two models and invariant to further increases in κ.[25]
Finally, the results shown in Figure 4 also confirm the claim made at the end of Section 4.4: namely that, even when platforms' pricing is purely per-transaction, a positive link does not necessarily hold between the propensity to single-home on the side without the choice of instrument and the relative attractiveness of platforms' pricing to that side. This is evident in the results for the PTP model with merchant choice. As κ rises in this model, consumers become more inclined to single-home, yet the fraction of platforms' total fees which they must bear slowly increases rather than falls – indicating a negative, not positive, link in this case.
Footnotes
Our PTP model is identical to the model used by Hermalin and Katz, except that it allows in principle for a cost (g) to platforms, for signing up subscribers, which is per-subscriber not per-transaction. In the case where g = 0 the two models are equivalent. [18]
Figure 2 shows (symmetric) platforms' proportional allocations of their total per-transaction fees across the two sides of the market, in our PTP model, as c increases. Part of the decline observable in Figure 2 is therefore due simply to the rise in platforms' total per-transaction fees which an increase in c causes. Part is also due, however, to the fact that, even in absolute terms, the gap between platforms' pricing to the two sides also narrows as c rises. [19]
The total price level, fc,* + fm, is also higher under monopoly than under duopoly, as expected. [20]
The key features of such a model are described briefly in Appendix C. [21]
Once again, the key features of these two further variants of our basic PTP model are discussed briefly in Appendix C. Detailed derivations of the geometric frameworks describing the decisions of consumers and merchants in each of these generalised models are provided in Gardner and Stone (2009b). [22]
It should, however, be noted that for the model with consumer choice, the family of solutions for different κ shown in Figure 4 does not extend smoothly and monotonically back to a solution at κ = 0. For κ = 0 the only Nash equilibrium solution is the one to our basic PTP model, identified in Section 4, in which consumers' share of platforms' total fees is equal to 54.5 per cent and merchants' share to 45.5 per cent. To get from this unique solution at κ = 0 to the solutions shown in Figure 4 would seem to require some strengthening, rather than weakening, of the Hermalin and Katz phenomenon as κ rises, for some range of small κ values. However, as noted, understanding what might be driving this contrasting behaviour, or what would actually eventuate in our consumer choice PTP model for such κ, is beyond the scope of this paper. [23]
In the case where consumers choose, this reflects the fact that as the number of consumers holding multiple cards falls, the scope for merchants to attempt to steer consumers' payment choices, and hence their incentive to do so, also clearly falls. Where merchants choose, it instead reflects the fact that – at least when consumers' per-transaction benefits are uniformly and independently distributed – the number of consumers inclined to ‘steer’ merchants, as a proportion of all consumers, declines as κ rises, in line with the decline in the number of consumers who would even contemplate holding both platforms' cards absent any steering considerations. [24]
For reasons which emerge from the detailed discussion in Appendix B, these model solutions for large κ in fact coincide not only with each other but also with that for the CR model, for g = c = 0, under duopoly (given in Table 1). [25]