Reserve Bank of Australia Annual Report – 1986 Economic Developments[*][†]
The International Economy
Economic activity in the industrial economies increased moderately in 1985/86 although, in a number of major countries, growth faltered in the early part of 1986. At the same time, inflation declined noticeably, assisted by a sharp fall in the price of oil and some other commodities. Unemployment continued at high levels. There were persistent imbalances on current account among the major countries and substantial movements in exchange rates during the year.(8)
Economic policies
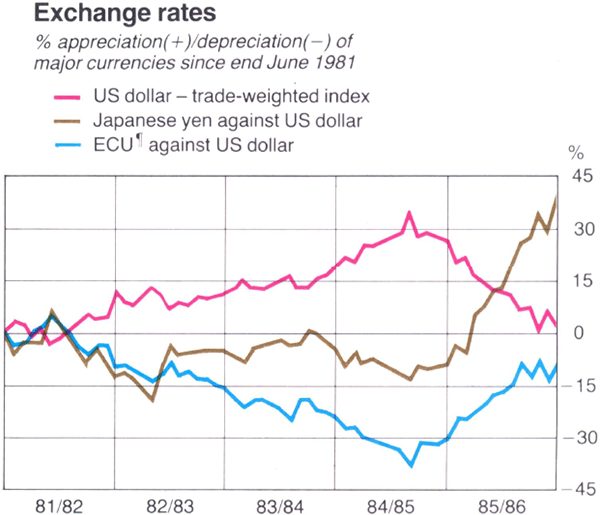
Progress was made towards greater co-ordination of economic policies among industrial countries. The G-5 countries — the United States, Japan, West Germany, the United Kingdom and France — agreed in September 1985 to implement policies aimed at easing imbalances in the international economy and sustaining the expansion in economic activity. This involved adjustments to exchange rates and to domestic stabilisation policies. In particular, the Group agreed to co-operate to encourage an orderly appreciation of the Yen and major European currencies against the U.S. dollar.
In the month following the September meeting, the trade-weighted index of the U.S. dollar fell by 5½ per cent. It continued on a generally downward trend and by end June 1986 was almost 19 per cent lower than a year earlier. Over the same period, the dollar depreciated by about 34 per cent against the Yen and by about 28 per cent against the Deutschemark. Currencies of the European Monetary System were also re-aligned during the year, with the French Franc devaluing by 3 per cent against the central rate, while the Deutschemark and the Dutch Guilder were each revalued by 3 per cent.
Modest steps were taken in the direction of lessening the divergence in fiscal policies among major countries. In Japan this involved a small fiscal stimulus. In contrast, the adoption of the Gramm-Rudman-Hollings Act in the United States offered the prospect of a substantial tightening in U.S. fiscal policy over a number of years. The Act, however, is being amended following legal challenge.
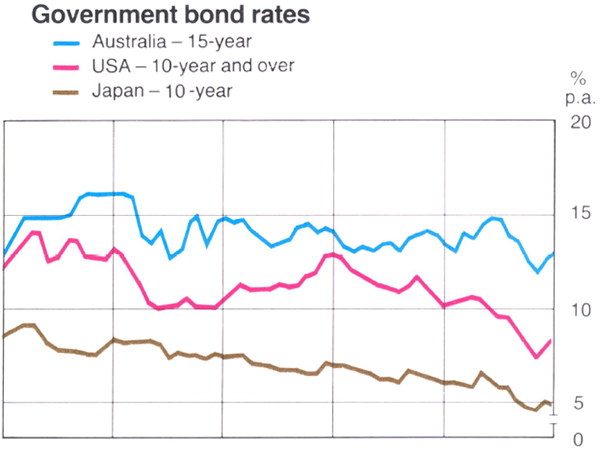
Co-ordination of monetary policies among the major countries was evident early in 1986 when central banks in the United States, Japan and several European countries reduced their discount rates in concert. These reductions reinforced the tendency in most of these countries to lower interest rates which had begun in the second half of 1985. In the United States, long-term interest rates had been falling for some time. Falls in short-term rates in most other major countries began in early 1986.
In mid 1986, heads of government of the seven major industrial countries and representatives of the European Economic Community met in Tokyo for the Twelfth Economic Summit. While reaffirming the 1983 Williamsburg Summit commitment to intervene in exchange markets when it would be helpful to do so, the Declaration from the meeting recommended that remedial efforts to address economic imbalances in the major economies should focus first and foremost on underlying policy fundamentals. In this context, a new Group of 7 Finance Ministers was formed by adding Italy and Canada to the G-5 countries.
Economic conditions
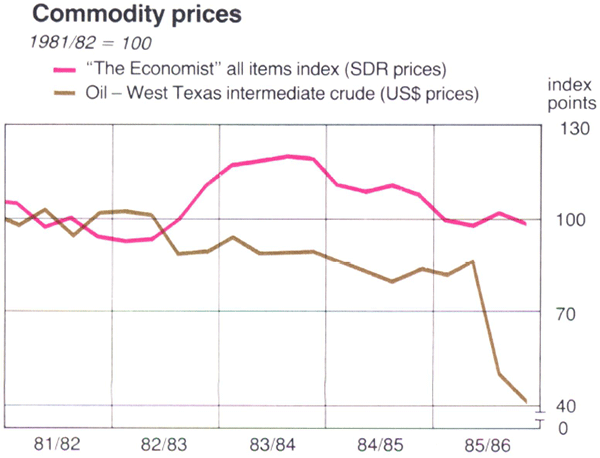
Prospects for inflation and growth in industrial economies were improved by the collapse of oil prices in the early months of 1986. After trading at around US$28 per barrel for much of 1985, the price of West Texas Intermediate crude fell sharply, with sales reported at prices below US$10 per barrel; prices fluctuated between about US$12 and US$17 per barrel during the closing months of the financial year.
Prices of many other commodities were also weak during 1985/86. In keeping with the lower price of oil, prices of energy-related goods weakened significantly. Prices of agricultural commodities, particularly wheat, were adversely affected by high levels of stocks in the European Economic Community and the United States and the potential effects of the U.S. Farm Bill. The commodity price index published by “The Economist” (measured in SDR terms) showed a net fall of about 10 per cent over the course of 1985/86.
8 International Economic Conditions
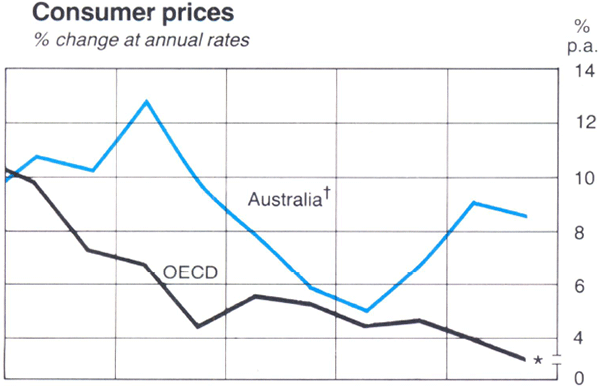
Consumer prices rose by less than in the previous year in nearly all the major countries. In the twelve months to May 1986, consumer prices in the OECD area rose by 2.6 per cent. In the United States, they rose by around 1½ per cent in the same period, in Japan by a little over 1 per cent and in West Germany they fell a little.
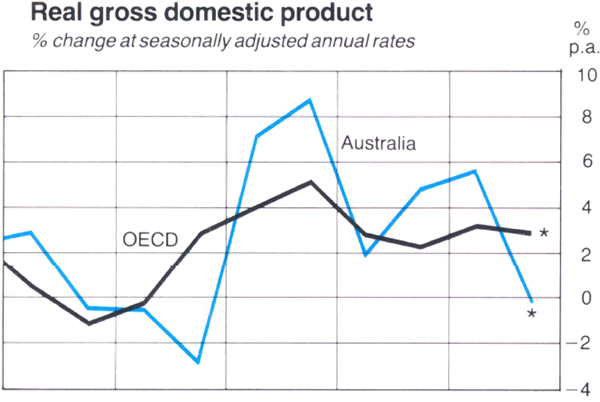
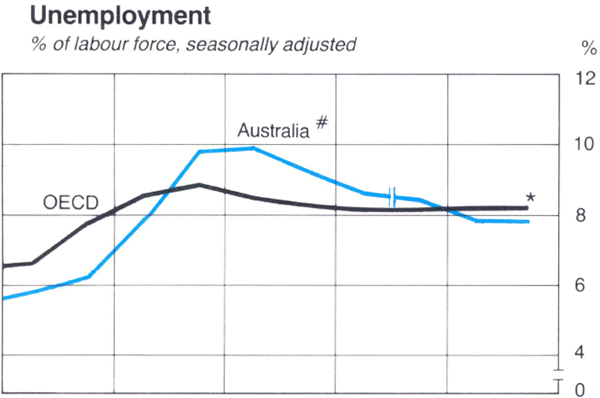
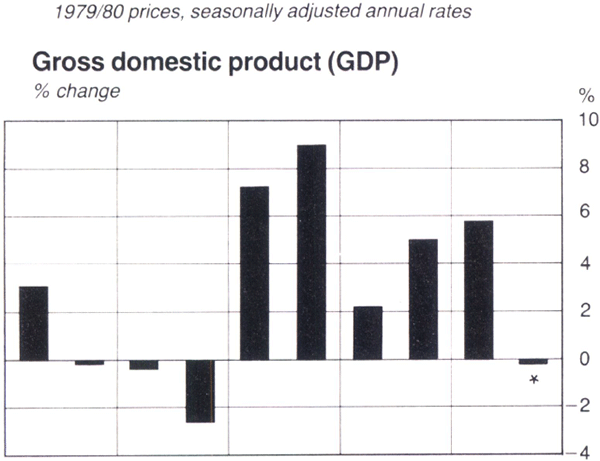
Growth of GDP in the OECD area is estimated to have slowed to around 3 per cent in 1985/86, from 3.4 per cent in 1984/85. Little progress was made in reducing unemployment. Employment growth in Europe was modest, but still higher than in 1984/85. In the United States, the unemployment rate fell in the first half of the year but then rose. In Japan, unemployment rose to record levels. In the United Kingdom there was further deterioration in the labour market, particularly in the second half of the year.
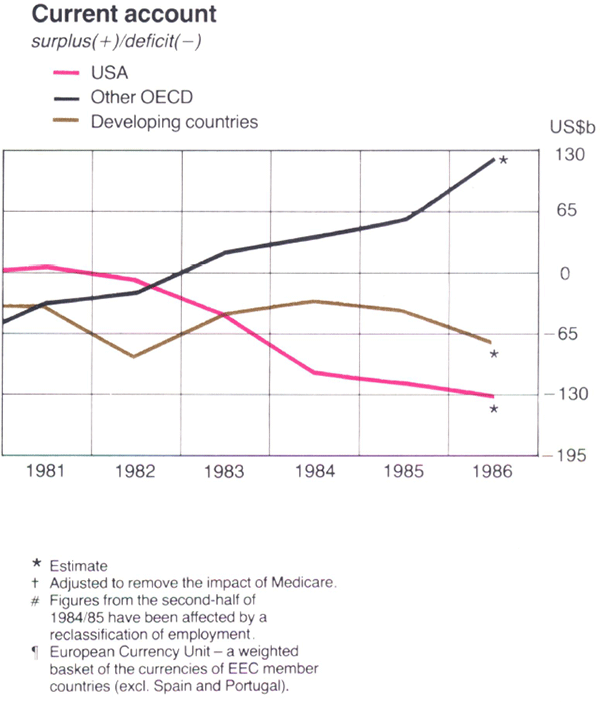
Severe imbalances in the external accounts of the major economies remained an important problem in 1985/86. The United States' current account deficit widened markedly during the year, while current account surpluses rose in Japan and West Germany.
Continued growth in major economies, the weaker U.S. dollar, and generally lower interest rates improved the outlook for many large debtor countries; lower oil prices also helped most, though they worsened the positions of oil exporters such as Mexico, Venezuela and Nigeria. At the annual meetings of the International Monetary Fund and the World Bank in early October 1985, U.S. Treasury Secretary Baker proposed a plan involving an increase of US$20 billion in lending by commercial banks to major debtor countries and a significant increase in lending by the World Bank. These measures were to be in support of comprehensive growth-oriented macroeconomic and structural policies in debtor countries.
International capital markets
There was a substantial increase in gross funds raised on international capital markets in 1985/86. Of the total issue of US$302 billion, Eurobonds accounted for a record US$154 billion. Bank lending through syndicated loans and back-up facilities, once the principal source of finance in international capital markets, accounted for only 37 per cent of the total. Bond issues denominated in Australian dollars were a fast growing, although still small, section of the international capital markets.
With interest rates generally declining there was strong demand by investors for fixed-interest securities in preference to floating-rate notes. The decline in rates also encouraged borrowers to refinance existing loans, with the result that the increase in net funds raised was less marked than the increase in gross raisings.
Economic Conditions in Australia
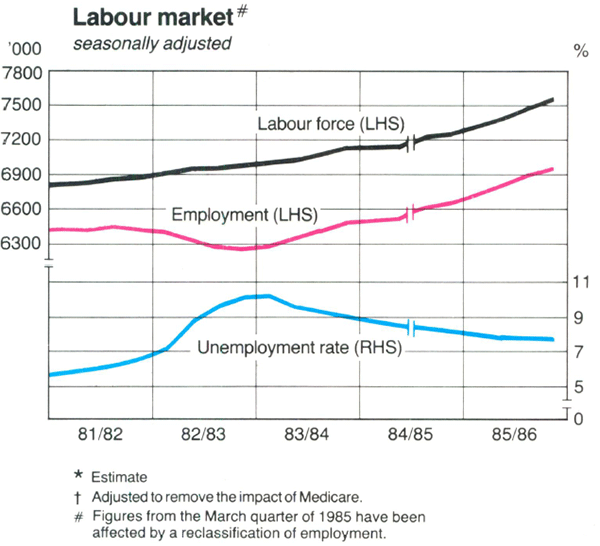
The Australian economy grew strongly early in 1985/86 but slowed noticeably as the year progressed. Employment increased markedly. The fall in the measured rate of unemployment was dampened, however, by a large rise in the labour force.
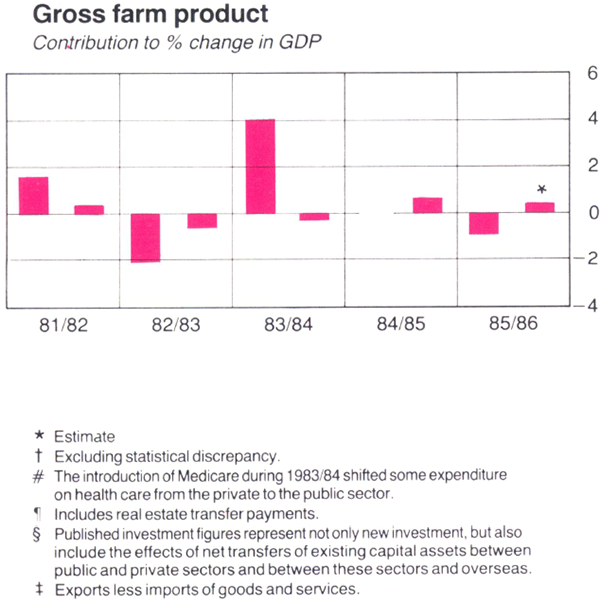
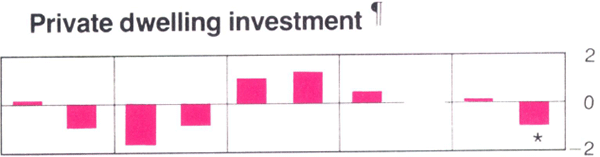
The slowing of economic activity reflected weaker domestic demand. Each of the major components of private spending weakened as the year progressed. There were other problems. Farm incomes were squeezed by rising costs and falling prices and, associated with a substantial fall in Australia's terms of trade, the current account deficit widened significantly.
Tight financial conditions saw interest rates rise to high levels in the middle of 1985/86 but, subsequently, most declined to below rates recorded at the beginning of the year. Largely reflecting the working through of price rises from the fall in the Australian dollar in 1985, the rate of inflation was higher than in 1984/85. Although inflation fell towards the end of the year, it remained well above rates in most other developed economies.
Expenditure and product
Gross national expenditure, in real terms, is estimated to have increased by substantially less than in 1984/85. Due to a sizable contribution from the external sector, however, real non-farm product appears to have grown by around 4½ per cent, about the same rate as in 1984/85. Growth in the volume of exports was strong; the volume of imports showed only modest growth. Farm product declined.(9)
9 Production and Spending
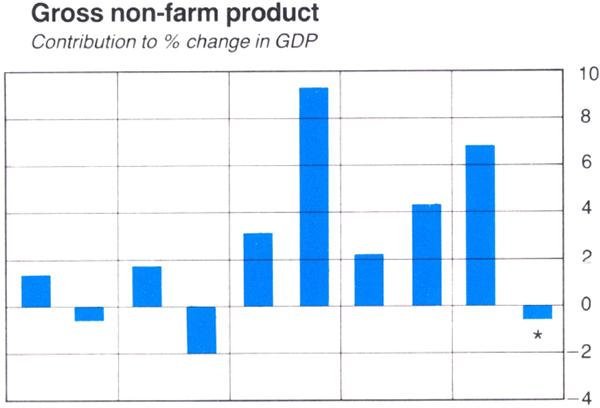
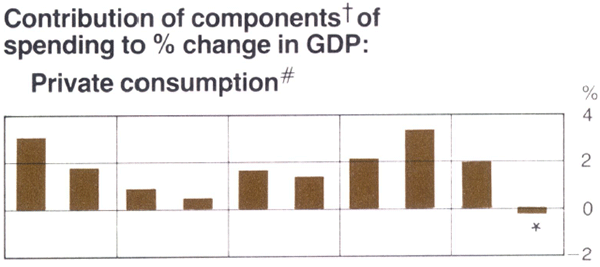
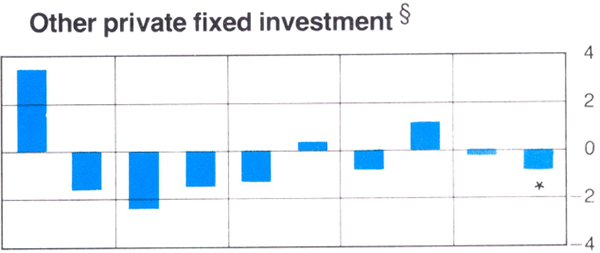
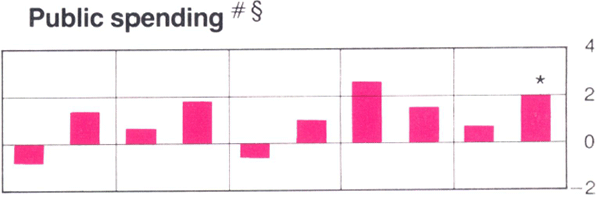
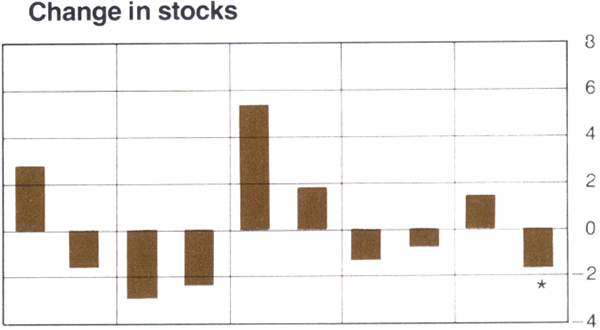
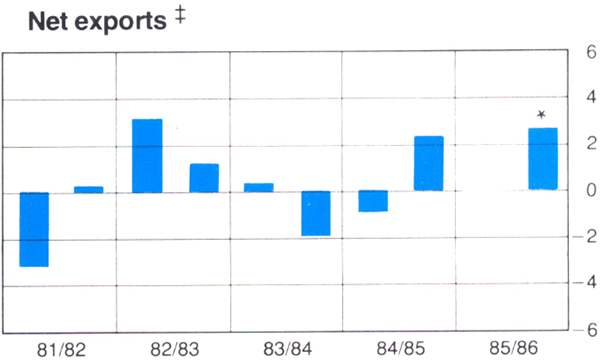
Growth in activity was stronger in the first half of the year than in the second. Private consumption and government spending both contributed to the rise, while business investment declined slightly. In this period, imports and exports grew at about the same rate.
In the second half of the year, private demand declined. Private consumption and investment in dwellings fell. While business investment, in aggregate, was weak in this period, outlays on construction remained buoyant. Spending by governments and public authorities continued to grow. Falling oil prices led to a fall in energy-based exports and, combined with weak demand for commodities generally, led to little growth in export volumes overall in the second half of 1985/86. But import volumes fell, with the result that the external sector contributed to economic growth in this period.
Labour market
The labour market was buoyant in 1985/86. This buoyancy attracted new workers into the labour force. The rate of unemployment nevertheless declined from 8.4 per cent in June 1985 to 7.7 per cent in the middle of the financial year. After increasing slightly early in 1986, it again declined to 7.6 per cent in June.(10)
Prices and wages
The fall in the Australian dollar in 1985 added to inflation but, towards the end of the year, falling oil prices exerted a moderating influence. On a twelve-months-ended basis, the rate of increase in the consumer price index reached a peak of 9.2 per cent in the March quarter, before declining to 8.4 per cent in the June quarter.
In September 1985, the Commonwealth Government and the Australian Council of Trade Unions agreed on a continuation of the Prices and Incomes Accord for a further two years. The agreement was entered into on the basis that wage rates would be fully adjusted in accordance with prices, with the exception of the wage rise expected in the first half of 1986 which, it was agreed, should be discounted by up to 2 percentage points for the direct effects of the depreciation of the Australian dollar. In addition, it was agreed that there should be moderation in the national productivity case, and that the productivity award should be implemented over time.
10 Prices, Incomes and The Labour Market
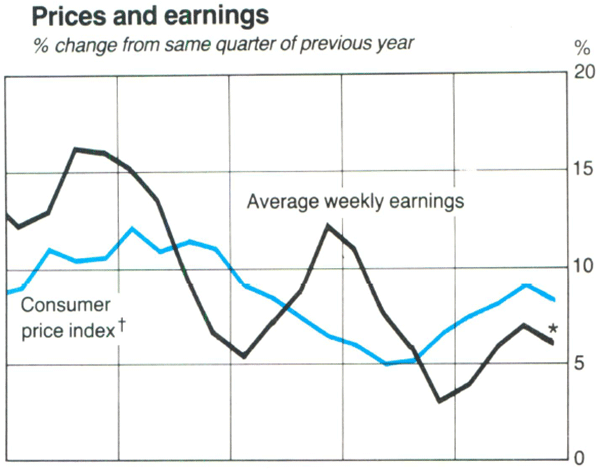
The National Wage Case decision in November 1985 reflected these arrangements; awards were increased by 3.8 per cent. After a prolonged hearing, the decision scheduled for April 1986 was not handed down until late in June. In that decision, award wages were increased by 2.3 per cent; this incorporated a discount of 2 percentage points as had been proposed in the re-negotiated Accord. The Commission decided not to impose by arbitration any occupational superannuation contributions on employers over the next two years. It did, however, agree to ratify agreements relating to employer contributions to improve superannuation schemes, if reached by consent.
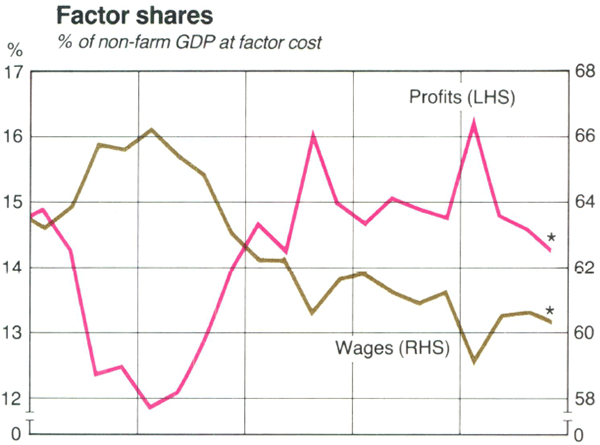
Earnings grew at a rate slightly above that of award wages throughout the year; there was no evidence of a major break-out in wages. In 1985/86 real unit labour costs fell slightly following falls in each of the previous two years. Unit labour costs are a measure of the total cost, per unit of output, of employing labour. The measure includes the effects of real wages, productivity and “on-costs”, such as superannuation, workers' compensation, payroll taxes and other wage supplements. The fall in 1985/86 reflected stronger growth in prices than in earnings and a modest rise in productivity; these factors more than offset an apparent rise in labour “on-costs” during the year. The gross operating surplus of companies and financial enterprises showed little change as a share of non-farm GDP in 1985/86.
Housing
Between the start of the financial year and March 1986 new lending for housing fell sharply. Market interest rates were above the interest rate ceilings set on housing loans from traditional housing lenders under formal or informal arrangements. Housing lenders found it difficult to compete for funds to lend within these ceilings. The supply of funds available for housing fell sharply in the December and March quarters and housing activity slowed noticeably from the December quarter. Commencements of private dwellings in the March quarter 1986 were about 14 per cent lower than in the June quarter 1985, while local government building permits declined even more sharply.(11)
Following the introduction in April of the Commonwealth Government's housing assistance package, new lending for housing rose rapidly.
11 Housing Finance and Activity
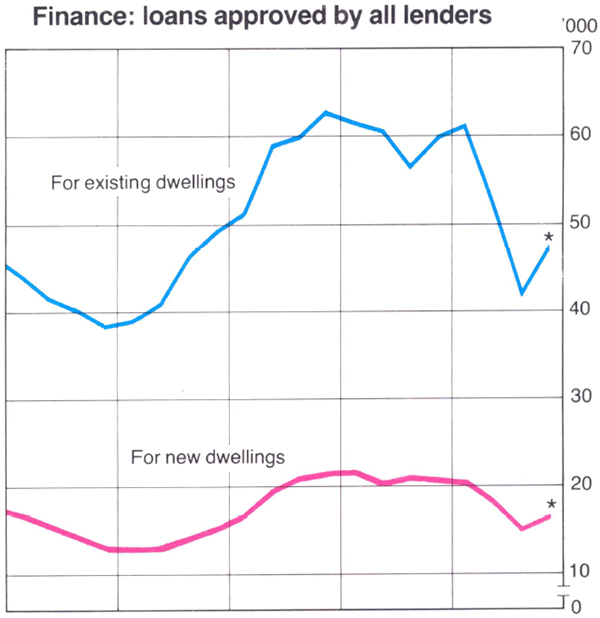
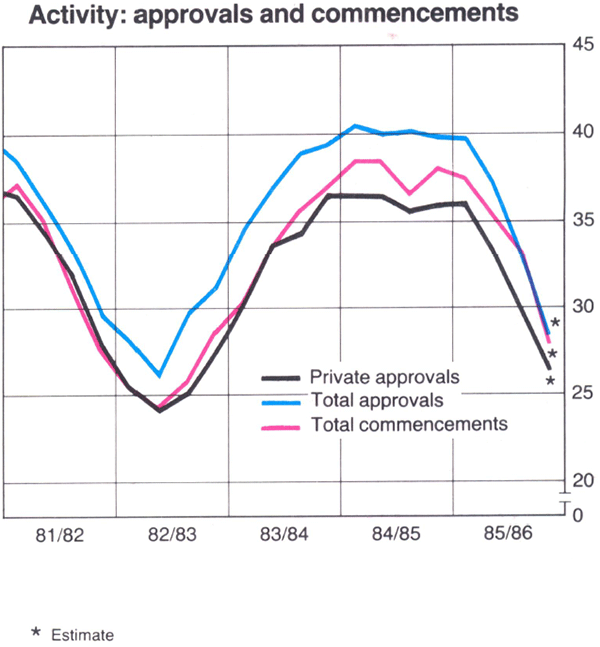
However, increased finance had not fed through to a rise in housing activity by the end of the financial year.
Rural sector
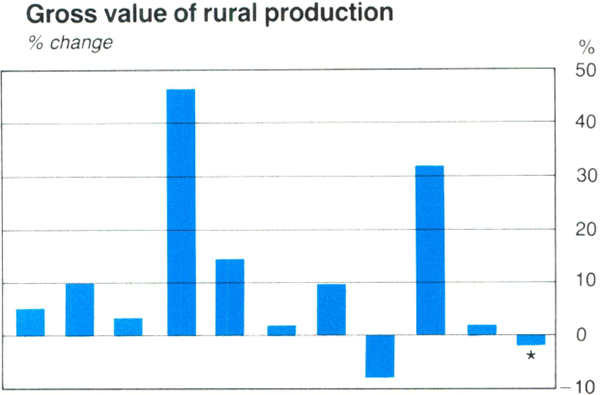
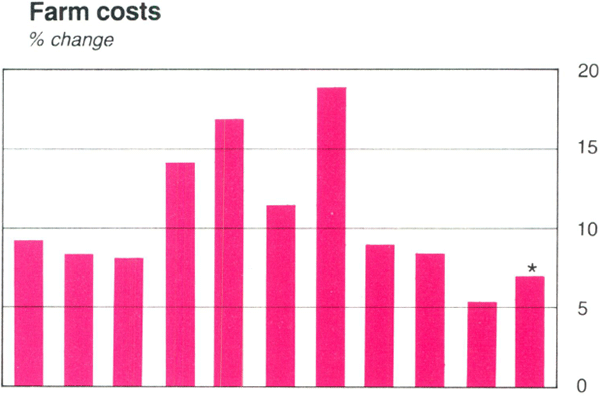
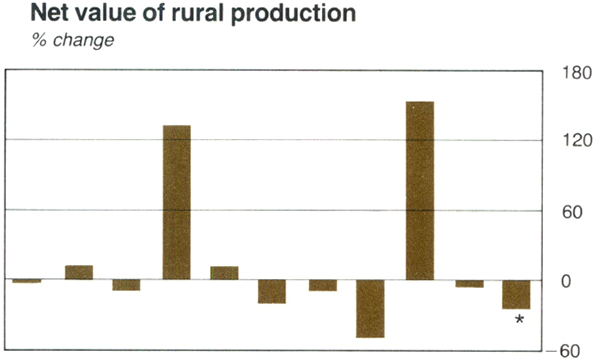
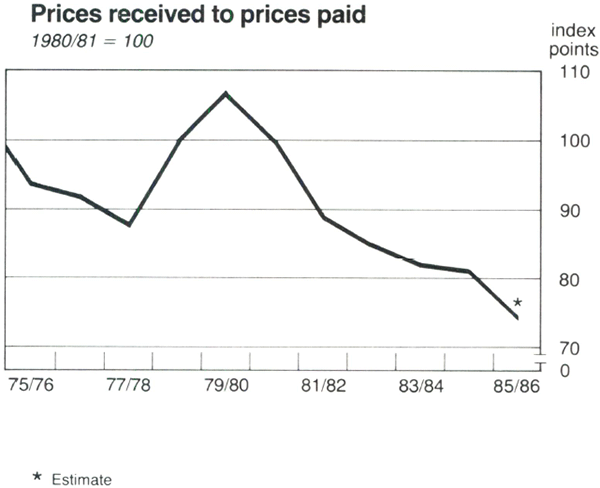
Conditions in the rural sector worsened in 1985/86. Weak prices for agricultural commodities and increasing costs placed a strain on farm incomes. The net value of rural production was estimated to have declined by about 24 per cent in 1985/86. The fall in farm incomes occurred in all major rural industries, though it was most marked for wheat and other crops; the fall in income for beef farmers was smaller than in other rural industries.
Largely because of subsidised competition from the European Community and the effects of the U.S. Farm Bill, prices for agricultural commodities seem likely to remain low.(12)
Balance of payments
Australia's current account was in overall deficit of $14.3 billion in 1985/86. This was about $3½ billion higher than the deficit in 1984/85 and over 6 per cent of GDP It was also considerably larger than expected when the Commonwealth Government framed its Budget in August 1985.
The current account outcome was shaped by several factors. The depreciation of the Australian dollar during 1985 increased both export and import prices and contributed to a widening current account deficit measured in domestic currency. Depressed world prices for many of Australia's exports, however, partly offset the boost to export values provided by depreciation. With import prices rising strongly, Australia's terms of trade declined by around 15 per cent between early 1985 and the June quarter 1986. Another important factor was the growing cost of servicing Australia's overseas debt. Gross interest payments on external debt rose in 1985/86 to nearly 17 per cent of export earnings, compared with 15½ per cent in 1984/85 and less than 4 per cent in 1975/76.
The volume of exports of goods and services increased by around 7½ per cent in 1985/86, compared with a rise of about 14 per cent in the previous year. The largest increases in rural exports were in beef and wool. Following the fall in the price of oil, non-rural exports fell away in the first half of 1986; exports of oil, which had grown strongly in the second half of 1985, declined particularly sharply.
12 Rural Sector
13 Balance of Payments and External Debt
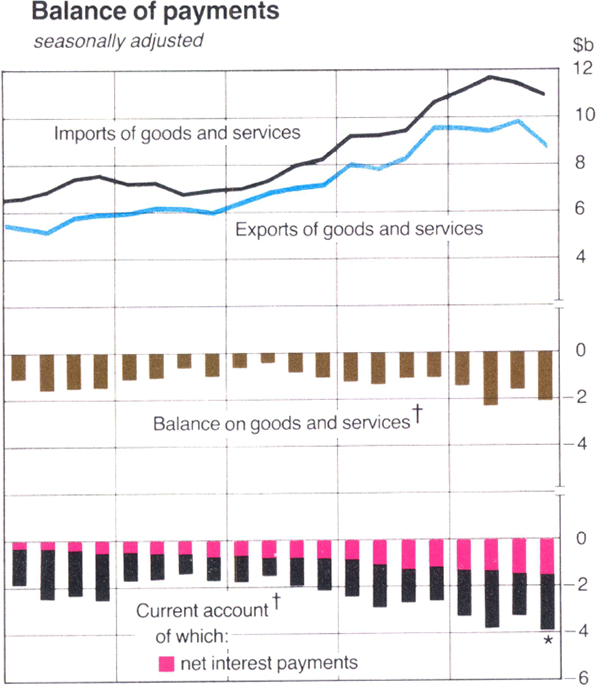
The volume of imports of goods and services rose solidly in the first half of 1985/86, with particularly strong growth in imports of capital goods. This trend was reversed in the second half of the year when the volume of imports fell as the effects of a slowing domestic economy and the depreciation of 1985 were felt. There was little net growth in import volumes for the year. The value of imports nevertheless rose by around 17 per cent, reflecting higher import prices resulting from the earlier depreciation of the Australian dollar.
Despite the improvement in net trade volumes, the deterioration in Australia's terms of trade led to a further widening in the dollar value of the deficit on trade in goods and services.(13)
Capital inflow in 1985/86 was predominantly in forms that added to Australia's external debt. Net general government borrowing totalled $2.6 billion, of which about $1.5 billion was denominated in Australian dollars. Overseas borrowings by State and Commonwealth instrumentalities were around $1.3 billion in 1985/86. Non-official net capital inflow totalled about $10 billion, of which net identified borrowings accounted for about $7 billion.
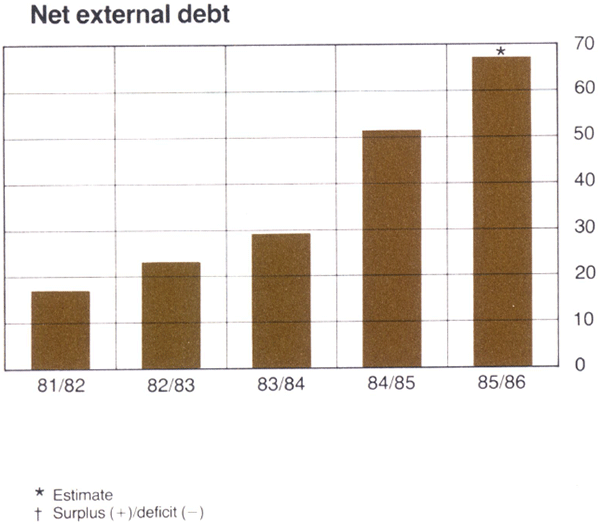
Australia's international reserves, valued in Australian dollars, stood at $13.0 billion in June 1986, a fall of $0.5 billion over the year. In SDR terms, reserves fell from SDR 9.0 billion at end June 1985 to SDR 7.5 billion at end June 1986. Non-official lending abroad (non-official holdings of foreign financial assets) was about $7 billion, giving a total of around $20 billion of gross external assets for Australia. Australia's gross external debt is estimated to have increased to almost $88 billion (equivalent to 38 per cent of GDP) by June 1986 compared with $69 billion (33 per cent of GDP) at June 1985. External indebtedness of the Commonwealth and of instrumentalities each represented around 20 per cent of the total, with private debt accounting for 60 per cent. Net external debt was estimated at around $68 billion (29 per cent of GDP) at June 1986, compared with $51 billion (25 per cent of GDP) at the end of 1984/85.
Footnotes
Half-yearly reviews of economic and financial conditions in Australia appeared in the September 1985 and March 1986 issues of the Bank's Bulletin. A review of external conditions appeared in the July 1986 issue. [*]
Figures in this chapter include estimates based on data available at the time of writing. [†]