
RDP 2026-03: Shock-percentile Restrictions for SVARs 3. Data
June 2026
- Download the Paper 3,250KB
We use two datasets in our analysis: repo transactions and the daily Beta SOFIA time series data. The first dataset is transaction-level data from the Australian repo market covering the period of Beta SOFIA calculation (4 January 2022 to 31 March 2025), collected by the ASX for clearing purposes. Each transaction record includes the transaction date, settlement date and maturity, buyer and seller identifiers, transaction volume, collateral used, and repo rate, among many other fields. Because our data is based on the ASX's clearing service, buyer and seller identifiers reflect the clearing agents, who may be acting either on their own behalf or on behalf of their clients.
The second dataset is a time series of daily Beta SOFIA rates. Since the transaction-level data underpins the time series published by the ASX, we replicate the construction of Beta SOFIA to generate synthetic SOFIA series for our analysis.[4] This enables us to add time series variables, including noise and liquidity measures.
3.1 Time series data
The time series dataset comprises 803 daily observations and contains daily Beta SOFIA rates and daily measures of market characteristics (e.g. volumes, liquidity, market concentration), computed from transaction-level data. Table 1 presents descriptive statistics on the time series variables and Table A2 defines the variables.
We identify related-party transactions as those in which the same legal entity appears on both the buyer and seller sides of a transaction. A key challenge in measuring related-party activity is that current reporting conventions do not distinguish between transactions executed by clearing agents on their own behalf and those conducted on behalf of clients. As a result, the method may overstate the true number of related-party transactions. The current dataset already includes a flag to reporting dealers to identify whether the transaction is made on own behalf or on client's behalf. However, this field is not mandatory and mostly left blank. Introducing a mandatory requirement to complete this field would enhance the quality and integrity of the data.
| Mean | Standard deviation |
Min | Percentile | Max | |||
|---|---|---|---|---|---|---|---|
| 25th | 50th | 75th | |||||
| Noise (bps) | 0.45 | 0.62 | 0 | 0.15 | 0.34 | 0.56 | 9.67 |
| No of related-party transactions | 8.02 | 7.63 | 0 | 2 | 6 | 12 | 63 |
| Herfindahl-Hirschmann Index (0–1) | 0.033 | 0.3 | 0.1 | 0.023 | 0.029 | 0.036 | 0.505 |
| Bid-ask 3-year (bps) | 1.17 | 0.30 | 0.73 | 0.98 | 1.03 | 1.5 | 3 |
| Hui-Huebel ratio | 0.024 | 0.039 | 0 | 0.011 | 0.018 | 0.025 | 0.884 |
| Amihud ratio | 3.91 | 32.58 | 0 | 0.04 | 0.12 | 0.36 | 857 |
| Market volume (log $) | 22.20 | 0.58 | 15.63 | 21.86 | 22.21 | 22.61 | 23.26 |
| No of trades | 66.22 | 26.46 | 2 | 50 | 59 | 74 | 207 |
| No of counterparties | 24.4 | 4.76 | 2 | 21 | 24 | 28 | 36 |
| Observations | 803 | ||||||
|
Sources: ASX; Authors' calculations: Bloomberg |
|||||||
Based on the current definition, the average number of related-party transactions per day is 8.5, with a maximum of 63. Figure 1 plots the number of related-party transactions over time, and their share of trading volume.
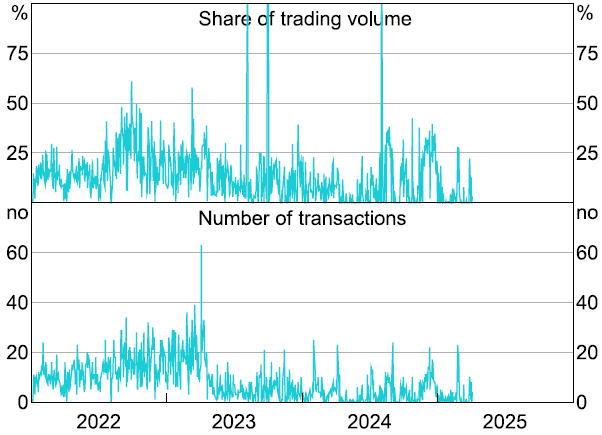
Note: Related party is defined as two affiliates of the same institution.
Sources: ASX; Authors' calculations.
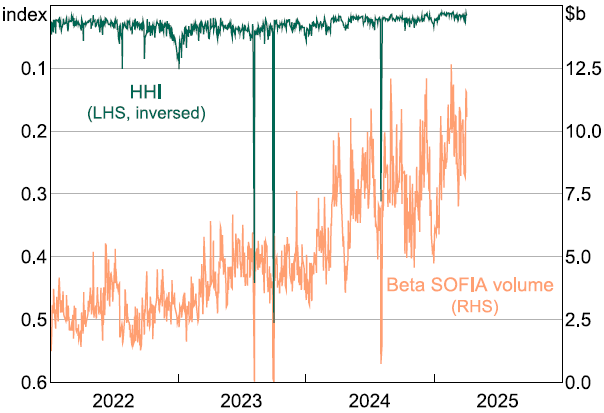
Market concentration is proxied by the Herfindahl-Hirschman Index (HHI), scaled from 0 to 100. Values between 0 and 20 generally indicate a competitive market with many active participants, while higher values reflect increasing concentration (Figure 2). The mean HHI is 0.033, with a minimum of 0.1 (corresponding to 33 counterparties trading on this day) and maximum of 0.505 (when only 2 counterparties were active). Figure 2 overlays the HHI measure with related daily Beta SOFIA volume, using an inverse scale for the HHI. It shows that HHI spikes on days with low transaction volume, suggesting a link between market depth and concentration.
Sources: ASX; Authors' calculations.
Liquidity conditions in the repo market are captured using three proxies: the bid-ask spread on the 3-year Australian government bond (mean = 1.17 basis points)[5], the Hui-Huebel ratio (mean = 0.024), and the Amihud illiquidity ratio (mean = 3.91). Hui-Hebel and Amihud illiquidity ratios measure price movements in relation to market transaction volume, see Table A2 for their empirical definitions. The intuition behind them is that large price movements over small transaction volumes demonstrate illiquidity. The log of total eligible market volume has a mean of 22.2, equivalent to approximately $5 billion, indicating a relatively deep underlying market for Beta SOFIA-setting transactions.
3.2 Transaction-level data
The transaction-level dataset comprises 55,498 observations and contains transaction-level estimates of Beta SOFIA noise and transaction characteristics (e.g. related-party indicators, buyer and seller identifiers, market share of each transaction relative to daily volume, and transaction volume). Table 2 summarises the main transaction-level variables.
| Mean | Standard deviation |
Min | Percentile | Max | |||
|---|---|---|---|---|---|---|---|
| 25th | 50th | 75th | |||||
| Noise (bps) | 1.49 | 2.34 | 0.01 | 0.49 | 0.98 | 1.77 | 298.35 |
| Related-party dummy | 0.117 | 0.321 | 0 | 0 | 0 | 0 | 1 |
| Market share (0–1) | 0.015 | 0.02 | 0 | 0.003 | 0.01 | 0.02 | 0.59 |
| Transaction volume ($m) | 79.1 | 92.2 | 0.0002 | 17.4 | 49.2 | 105 | 1,200 |
| Observations | 55,498 | ||||||
|
Sources: ASX; Authors' calculations. |
|||||||
Related-party transactions account for approximately 11.7 per cent of all repo trades in the sample. While this is a relatively high share, it likely overstates the true extent of related-party activity due to limitations in reporting convention, as discussed previously. Average market share, calculated as the transaction's volume divided by the total Beta SOFIA-eligible market volume on that day, is 1.5 per cent, but this varies substantially across observations, reaching as high as 59 per cent – suggesting that on some days, a single transaction could materially influence the Beta SOFIA rate.[6] The log transaction volume of the first repo leg averages $79 million per trade, and spans a wide range from $2,500 to nearly $1.2 billion.
Footnotes
There are minor differences in the number of eligible trades and volume. To ensure our results are consistent we use the replicated version of Beta SOFIA in our analysis. [4]
We use the bid-ask in the sovereign bond market as a proxy to the bid-ask spread in the repo market. [5]
Expert judgement is useful on days of high market share concentration and low transaction volume. [6]