
RDP 2026-03: Designing an Efficient Reference Rate: Lessons from SOFIA Appendix A: Supplementary Information
June 2026
- Download the Paper 3,250KB
| Reference rate | Threshold for expert judgement | Related-party transactions |
|---|---|---|
| BBSW (Australia) | Yes – $100 million, three trades and four counterparties | No |
| AONIA (Australia) | Yes – $500 million, three trades and four counterparties | No |
| SOFR (US) | No | No |
| SONIA (UK) | Yes – the volume of SONIA-eligible transactions is < 70% of the mean of the previous five business days for which SONIA has been calculated in line with the statement of methodology | No |
| €STR (euro area) | Yes – the number of reporting banks is less than twenty; or five banks account for 75% or more of total transaction volumes | No |
| SARON (Switzerland) | No | No |
| TONAR (Japan) | No | No |
| CORRA (Canada) | Yes – if the trimmed volume is below C$3 billion | No |
|
Sources: ASX; Bank of Canada; Bank of England; Bank of Japan; European Central Bank; Federal Reserve Bank of New York; Reserve Bank of Australia; Swiss National Bank. |
||
| Variable | Description |
|---|---|
| Time series | |
| Noise (per cent) | Absolute value of estimated noise term; SOFIA – efficient rate |
| No of related-party transactions | Number of related-party transactions |
| HHI (values between 0 to 100) | Herfindahl-Hirschmann Index; sum of (transaction volume / market volume)2 × 100 |
| Bid-ask 3-year (per cent) | Bid-ask spread of 3-year Australian Government securities |
| Hui-Huebel ratio | Hui-Huebel liquidity ratio; (SOFIAMax – SOFIAMin) / SOFIAVolume |
| Amihud ratio | Absolute value of Amihud illiquidity ratio; ((SOFIA – L.SOFIA) / SOFIAVolume) × 100 |
| Market volume (log) | Sum of all SOFIA-eligible transaction volume |
| Panel data | |
| Noise (per cent) | Absolute value of estimated noise term; transaction rate – efficient rate |
| Related-party dummy | Dummy variable that takes the value 1 if transaction is between related parties |
| Market share (values between 0 and 1) | Transaction volume / total SOFIA-eligible market volume |
| Transaction volume (log) | Log dollar amount of haircut-adjusted transaction size |
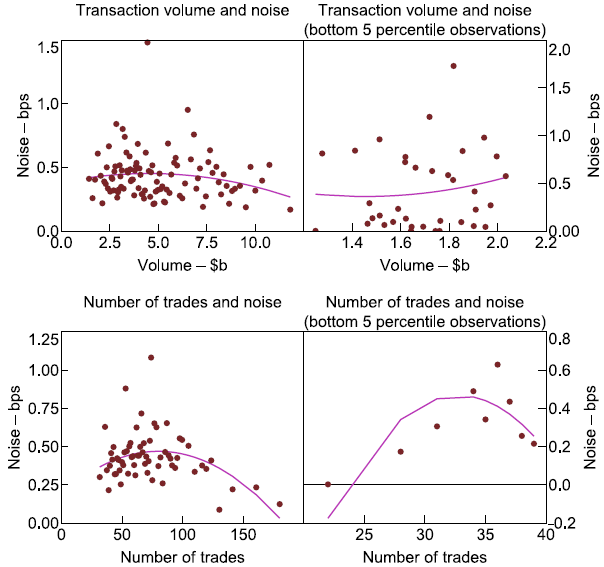
Figure A1: Binned Scatter Plot after New Treatment of Holidays
Sources: ASX; Authors' calculations.