RDP 2017-02: Anticipatory Monetary Policy and the ‘Price Puzzle’ 1. Introduction
May 2017
Vector autoregressions (VARs) often find that inflation increases in response to a tightening in monetary policy, although mainstream macroeconomics predicts the opposite. This ‘price puzzle’ is commonly thought to reflect interest rates being tightened in anticipation of future inflation, reflecting information possessed by policymakers beyond that contained in the model. An influential paper by Romer and Romer (2004) successfully removes the price puzzle from US data by purging the policy interest rate of any systematic responses to central bank forecasts. Cloyne and Hürtgen (2016) also use this approach to eliminate the price puzzle for the United Kingdom. We apply the same approach to Australian data and find that our estimation fails to remove the price puzzle. Under a wide range of specifications, higher interest rates are estimated to lead to higher inflation. These results are difficult to explain. We think this raises important questions about the reliability of VARs for the analysis of monetary policy.
1.1 Documenting the Price Puzzle
We begin with an Australian illustration of the price puzzle. We estimate a recursive VAR that is similar, in terms of variables and lag structure, to models used in previous Reserve Bank research (Brischetto and Voss 1999; Berkelmans 2005; Lawson and Rees 2008; Jääskelä and Jennings 2010; Jacobs and Rayner 2012). Variables include: US real GDP, commodity prices, real GDP, underlying inflation, the cash rate, and the real exchange rate (real TWI), in that order. Appendix A provides further details about the variables and model specification.
Figure 1 shows the responses of real GDP, underlying inflation and the price level (i.e. the cumulated response of inflation) to a 1 percentage point shock to the cash rate. Output declines, as would be expected. However, inflation responds perversely, rising by 0.1 percentage point (at a quarterly rate) one quarter after the shock and remaining there for the next year or so. The price level is permanently higher. This is known as the price puzzle. All responses are statistically significant at a 10 per cent level, with the 90 per cent confidence intervals calculated by repeated resampling from the asymptotic distribution of the parameters (1,000 times).
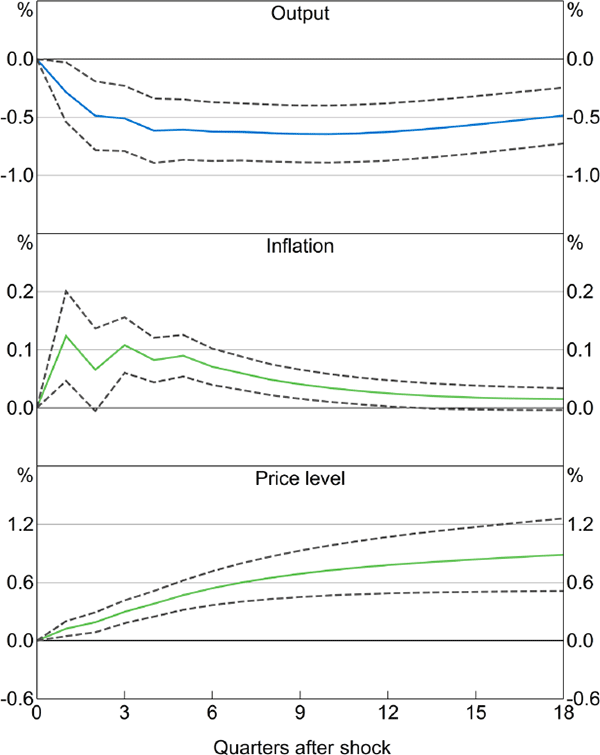
Notes: Price level is the cumulated response of underlying inflation to the monetary policy shock; confidence bands indicate 90 per cent intervals; sample period is 1990:Q2–2015:Q4
Sources: ABS; Authors' calculations
Results like these are common in the international literature. In a survey of 70 studies using VARs spanning 31 countries, Rusnak, Havranek and Horvath (2013) found that half showed a price puzzle. They note that this likely understates the pervasiveness of the result, since studies finding a price puzzle are less likely to get published in academic journals. Examples of price puzzles in Australian VARs include Phan (2014, p 387), Beechey and Österholm (2008, p 455) and, arguably, Suzuki (2004, p 150). Several of the RBA papers cited above also show price puzzles, which is unsurprising, given that the specifications are often similar to the one used in Figure 1.
The price puzzle is generally thought to reflect central banks setting monetary policy in a forward-looking way, using information beyond that contained in the VAR. For example, if the central bank correctly anticipates an imminent increase in inflation, following a pick-up in leading indicators, its pre-emptive rate rise will be followed by a period of higher inflation, leading the VAR to attribute that inflation to the rate rise. Similar logic also implies that the estimated response of output will be biased towards zero due to anticipatory policy.
Support for this interpretation comes from a decomposition of the price puzzle. Figure 2 decomposes the inflation response from Figure 1 into the direct effects of interest rates on inflation (blue bars), along with the indirect effects operating through the Phillips curve (maroon bars) and exchange rate (pink bars).[1] These contributions are calculated by setting relevant coefficients in the inflation equation equal to zero, after estimation. For example, the ‘direct effect’ of interest rates is the difference between the overall inflation response and the response when the coefficients on the cash rate in the inflation equation are set to zero. Similarly, the ‘Phillips curve’ and ‘exchange rate’ contributions are the difference between the overall response and the response once we set to zero the coefficients on real GDP and the real TWI, respectively. The components do not sum to the total because of interaction effects (grey bars). Figure 2 shows that the price puzzle in a recursive VAR does not arise because of problems estimating the Phillips curve or exchange rate channels of monetary policy, since these channels exert a deflationary influence. Rather, the price puzzle stems from the coefficients on the policy interest rate in the inflation equation. These coefficients are large, statistically significant and ‘incorrectly’ signed. The effect essentially occurs with a one-quarter lag, which rules out interpretations implying delayed or gradual responses.
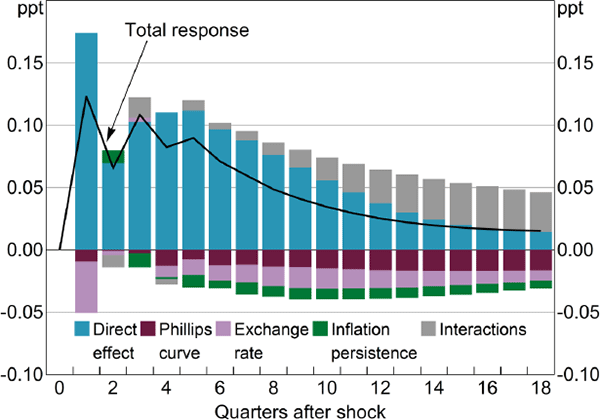
Notes: Total response of underlying inflation to a 1 percentage point contractionary monetary policy shock, as in middle panel of Figure 1; sample period is 1990:Q2–2015:Q4
Sources: ABS; Authors' calculations
An implication of Figure 2 is that it is not necessary to estimate a VAR or other system to generate a price puzzle. It arises from estimating a single equation. The recursive inflation equation, by itself, implies that an increase in the cash rate of 1 percentage point increases inflation by 0.18 percentage points in the following quarter (with a standard error of 0.064), holding other variables constant.[2] The other variables and equations in the VAR add some momentum, but do not change the character of the response.
To see more clearly how anticipatory monetary policy can generate a price puzzle, assume that the ‘true model’ of inflation takes the following form,


where πt is the inflation rate in period t, rt is the cash rate announced in period t, Xt − 1 is a determinant of inflation observed by the econometrician (e.g. the exchange rate or the unemployment rate), Zt − 1 is another variable that helps the central bank predict inflation (e.g. oil prices or wages), and εt and et are error terms. For simplicity, assume that the transmission from the cash rate to inflation occurs through X but not Z.
The key parameter of interest is βθ, which measures the effect on inflation next period due to a unit change in the cash rate this period. However, rather than estimating Equations (1) and (2), the econometrician estimates a reduced-form equation that incorrectly omits the Zt − 1 variable,

where νt ≡ γZt−1 +
(εt+βet−1) is a composite
error term. The least squares estimator  will be
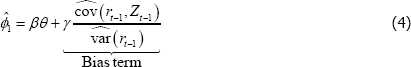
will be a
biased estimator of the true effect of policy on inflation, βθ, if both of
the following hold:
- cov(rt−1,Zt−1) ≠ 0. Policy responds to a wider range of inflation indicators than those included in the VAR.
- γ ≠ 0. These variables have additional predictive power for future inflation.
As can be seen from the discussion of the outlook presented in the Statement on Monetary Policy, the RBA's inflation forecasts are informed by a wider range of indicators than appear in VARs. For example, liaison with resource firms provided the Bank with ‘quite accurate information about the timing and magnitude of the downturn in mining investment that significantly improved our forecasts’ (Heath 2015). A priori, it is unclear whether the forecasts have explanatory power for future inflation above and beyond that contained in a VAR, although the finding that RBA forecasts of inflation have been more accurate than alternative forecasts suggests that this is likely (Tulip and Wallace 2012, Section 4.3).
The sign of the bias is likely to be positive if the above conditions hold and if interest rates respond positively to the inflation outlook, which is the typical response for an inflation-targeting central bank such as the RBA. In Section 2.1, we provide empirical evidence that the RBA responds in this way to the inflation forecast. This bias is the most common explanation put forward for the existence of the price puzzle.
A positive effect of interest rates on inflation is generally regarded as implausible, although there are some exceptions to the consensus, which we discuss in Section 4. In particular, this result appears to be inconsistent with the largest (and hence the easiest to interpret) movements in the data. Periods of unusually tight monetary policy, such as in Australia in 1989–90, the United States in 1979–82 or the United Kingdom in 1979–82, were followed by declining output, then large falls in inflation. These episodes convinced many observers that monetary policy has a strong effect on inflation. A second reason is that the price puzzle seems to be inconsistent with the stationarity of interest rates and inflation. Central banks say they respond to accelerating inflation by raising nominal interest rates. But if inflation responded positively to changes in interest rates, tighter policy would amplify the inflation, resulting in instability of nominal interest rates and inflation. However, interest rates and inflation have been stable, especially under the current policy of inflation targeting. Finally, mainstream macroeconomic theories and textbooks (e.g. Woodford 2003; Galí 2008; Mankiw 2015) imply higher interest rates would lower inflation.
Following Sims (1992), it has been common to control for commodity prices in VARs. An increase in commodity prices often leads to increases in both inflation and interest rates and hence gives rise to a positive correlation between these variables. That is, commodity prices are an important element of Z in Equation (1). However, the responses shown in Figure 1 come from a VAR that already includes commodity prices, and we measure inflation with the trimmed mean, on which commodity prices have little direct effect. Approximately half the estimates in the survey by Rusnak et al (2013) allow for commodity prices, and of these, half still report a price puzzle. This may reflect sensitivity of the results to the precise measure of commodity prices, and in particular, whether they include oil prices. Or, more likely, it may be that commodity prices are just one component of the inflation forecast and hence do not fully control for forward-looking policy.
Another approach to the price puzzle has been to estimate a factor-augmented VAR (FAVAR), where a large number of possibly relevant macroeconomic and financial series are summarised by principle components. Bernanke, Boivin and Eliasz (2005) show that a FAVAR removes the price puzzle from US data. On a conceptual level, FAVARs are similar to controlling for central bank forecasts, in that they summarise and apply a wide range of data. However, FAVARs have greater data requirements and are harder to interpret. On a practical level, including the first and second principal components from Gerard and Nimark (2008) in the VAR in Section 1 fails to remove the price puzzle (for results, see Appendix B).
The remainder of the paper proceeds as follows. In Section 2, we discuss Romer and Romer's (2004) approach to addressing the price puzzle along with the methodology used in our paper and our baseline estimates. Section 3 examines the robustness of our baseline estimates to using alternative specifications and data. Section 4 provides some interpretations of our results. Section 5 contrasts our findings with those from large-scale structural econometric models. Section 6 offers some concluding remarks.
Footnotes
Other variables in the VAR, namely US GDP and commodity prices, are assumed to be unaffected by Australian interest rates. These and other specification details are discussed in Appendix A. [1]
The recursive inflation equation includes contemporaneous observations of US real GDP, commodity prices and real GDP but only lagged observations on the cash rate and the real exchange rate. To examine the stability of the price puzzle, we estimated the recursive inflation equation over an eight-year rolling window. These rolling regressions revealed that the ‘wrong’ sign on the first lag of the cash rate is primarily a feature of the second half of our sample period (i.e. from the late 1990s onwards). In the early 1990s, the coefficient on the first lag of the cash rate is close to zero. [2]