RDP 2015-15: Household Economic Inequality in Australia Appendix A: Imputed Rent and the Distributions of Household Expenditure and Income
December 2015 – ISSN 1448-5109 (Online)
- Download the Paper 4.72MB
To understand how the addition of imputed rent affects the measured distributions of consumption and income it helps to consider some simple accounting exercises.
Suppose a renter has the following single period budget constraint:
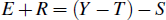
Where total expenditure consists of non-housing expenditure (E) and expenditure on housing services which, for the renter, is simply the value of market rent paid (R). The total resources available each period consist of non-housing income (Y), such as wages and salaries, less net government taxes (T) and saving (S).
A home owner has a corresponding budget constraint:
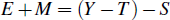
This expression is essentially the same as that of the renter, except that the housing expenditure of the home owner is given by mortgage interest payments (and other costs of maintaining a home) (M). Now suppose we add gross imputed rent (IR) to both sides of the home owner's budget constraint (and just move mortgage interest payments to the right of the constraint):

Now the home owner spends an amount equal to gross imputed rent on housing services and earns ‘housing income’ measured by net imputed rent (which is just gross imputed rent less mortgage interest payments) (NIR = IR−M). The addition of gross imputed rent to both sides of the household budget constraint does not affect aggregate household saving. But it affects the distribution of both spending and income if home owners are not identical to renters.[21]
In essence, we add net imputed rent to non-housing expenditure when we redefine household ‘expenditure’ as ‘consumption’. In other words, we replace mortgage interest payments (and associated housing costs, such as maintenance) with gross imputed rent. This causes measured inequality to fall because it affects low-spending households by more than high-spending households.
To demonstrate how consumption and expenditure inequality can follow different trends over time, consider the following simple decomposition.
Suppose that the level of imputed rent (IR) is simply given by the imputed rental yield (r) multiplied by the housing price (HP):

Correspondingly, the level of mortgage interest payments (M) is equal to the mortgage interest rate (i) multiplied by the outstanding stock of mortgage debt (D):

It follows that we can write net imputed rent (as a share of income) as:

This decomposition shows that the distribution of net imputed rent (relative to total income) is a function of the distribution of three factors:
- The ‘spread’ between the imputed rental yield and the mortgage interest rate (r−i)
- The housing debt-to-price (or ‘leverage’) ratio (D/HP)
- The house price-to-income ratio (HP/(Y +NIR)).
Changes in any of these factors can drive differential changes in measures of inequality based on consumption and expenditure over time. Furthermore, they drive changes in measures of income, depending on whether the estimates adjust for net imputed rent or not.
Footnote
We could also write down the budget constraint for a housing investor but it does not affect the overall story. [21]