RDP 2015-11: Unprecedented Changes in the Terms of Trade 5. Results
August 2015 – ISSN 1448-5109 (Online)
- Download the Paper 1.15MB
5.1 Structural Parameters and Date Breaks
Table 3 summarises the estimates of key structural parameters. We consign the estimates of the parameters of the exogenous process to Appendix C.
| Parameter | Prior distribution | Posterior distribution | ||||||
|---|---|---|---|---|---|---|---|---|
| Shape | Mean | Std dev | Mode | Mean | 5% | 95% | ||
| Commodity prices | ||||||||
| Δκ | Uniform | [−0.2 5, 3.50] | 0.42 | 0.41 | 0.32 | 0.49 | ||
| σκ | Inv gamma | 0.1 | 2 | 0.05 | 0.05 | 0.03 | 0.07 | |
 |
Inv gamma | 0.1 | 2 | 0.11 | 0.12 | 0.09 | 0.15 | |
| ρκ | Beta | 0.5 | 0.5 | 0.90 | 0.89 | 0.84 | 0.94 | |
| Monetary policy rule | ||||||||
| ρR | Beta | 0.5 | 0.2 | 0.88 | 0.88 | 0.85 | 0.91 | |
| ϕπ | Normal | 1.5 | 0.5 | 2.24 | 2.30 | 1.80 | 2.84 | |
| ϕy | Normal | 0.3 | 0.2 | 0.34 | 0.37 | 0.14 | 0.61 | |
| Frictions | ||||||||
| h | Beta | 0.5 | 0.2 | 0.66 | 0.66 | 0.55 | 0.78 | |
| ϒ′′ | Normal | 2 | 1 | 2.89 | 3.13 | 2.03 | 4.36 | |
| SlopeN | Gamma | 5 | 3 | 2.68 | 2.93 | 2.03 | 4.08 | |
| SlopeH | Gamma | 5 | 3 | 13.41 | 13.99 | 9.57 | 19.30 | |
| SlopeF | Gamma | 5 | 3 | 1.05 | 1.38 | 0.61 | 2.46 | |
| Log marginal density: 3,589.6 | ||||||||
| Notes: SlopeN = 100(θN − 1)/ψN, SlopeH = 100(θH − 1)/ψH, SlopeF = 100(θF − 1)/ψF | ||||||||
In estimation we allow for breaks in κ and σκ because we want to allow the model to fit the data without necessarily having to resort to a change in κ. As it turns out, the data strongly prefer a specification in which κ and σκ both increase. The left panel of Figure 4 shows the posterior distribution of Δκ. The long-run level of commodity prices is estimated to have increased by 42 per cent, with a distribution that ranges between 30 and 50 per cent. The posterior distribution substantially shrinks the uncertainty relative to our uninformative prior on Δκ and the density is bounded well away from zero.
At the same time, the estimates point to a significant increase in the volatility
of shocks to commodity prices. At the mode, the standard deviation of shocks
to commodity prices has more than doubled. The right panel of
Figure 4 shows the posterior distribution
of the ratio of the standard deviations of shocks to commodity prices in the two
regimes, that is  . The distribution has no mass at unity or
values below. Thus, there is no likelihood that the volatility of commodity
price shocks has fallen or stayed the same.
. The distribution has no mass at unity or
values below. Thus, there is no likelihood that the volatility of commodity
price shocks has fallen or stayed the same.
The monetary policy rule, habits and investment adjustment costs parameters are in line with other estimated small open economy models (Jääskelä and Nimark 2011; Adolfson et al 2013). Like Rabanal (2009) and Rees, Smith and Hall (2015), we find heterogeneity in the degree of price stickiness across sectors. At the mode, the slope of the Phillips curve in the tradeable sector is five times steeper than in the non-tradeable sector, which is in turn steeper than in the importing goods-producing sector.
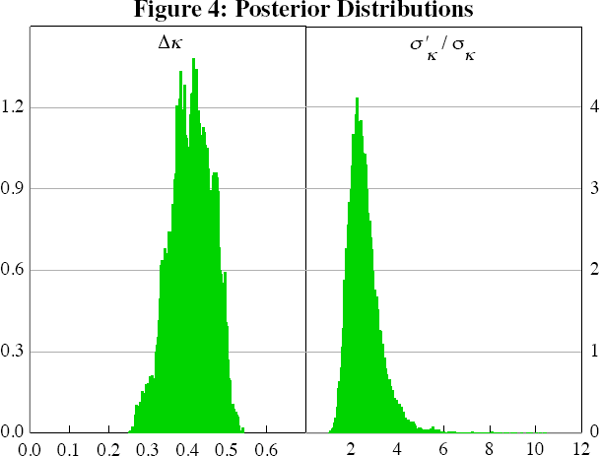
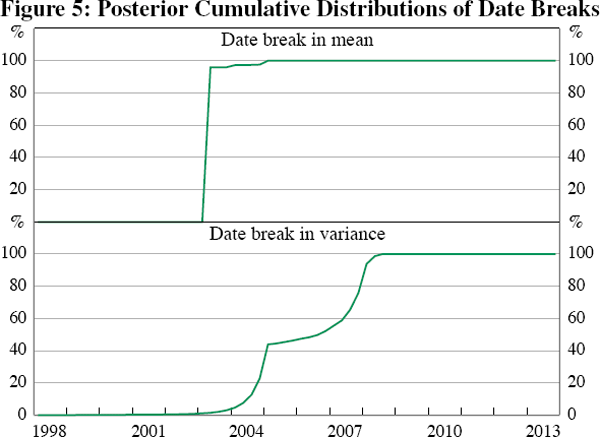
Figure 5 shows the cumulative posterior densities of Tκ, the date break in the unconditional mean of commodity prices, and Tσκ, the date break of the variance. The data strongly prefer 2003:Q2 for the timing of the date break in the unconditional mean. The probability that the break occurred in this quarter is around 95 per cent. This date is close to that identified by Gruen (2011), who places the start of boom in 2002:Q2. Single-equation Bai and Perron (1998) tests place the date break in κ a quarter later then suggested by our model, that is 2003:Q3.
The date break in volatility, Tσκ, shown in the bottom panel of Figure 5, is estimated to have occurred after the increase in the unconditional mean. Its posterior density, however, is bi-modal. It peaks in 2005:Q2 and then again in 2008:Q2.
The last row of Table 3 reports the log marginal density of the model. We use this metric to compare the overall fit of the model against an alternative model in which we restrict the mean of commodity prices and the variance of commodity price shocks to be constant across the entire sample.[12] The log marginal density of this alternative ‘no-breaks’ model is 3,540.3, implying a log Bayes factor of 49.3. This is decisive evidence in favour of a model that allows for structural breaks in the mean and variance of commodity prices.[13]
5.2 Estimated Transitional Dynamics
To get a sense of the magnitudes involved, we compute the transitional dynamics implied by the posterior distribution of Δκ for commodity prices and other selected variables. To construct these, we sample 75 draws from the joint posterior distribution of date breaks and structural parameters. For each draw, we compute the non-stochastic transition path. This is the path the economy would have followed if there were no shocks other than a change in long-run commodity prices of size Δκ occurring at Tκ.
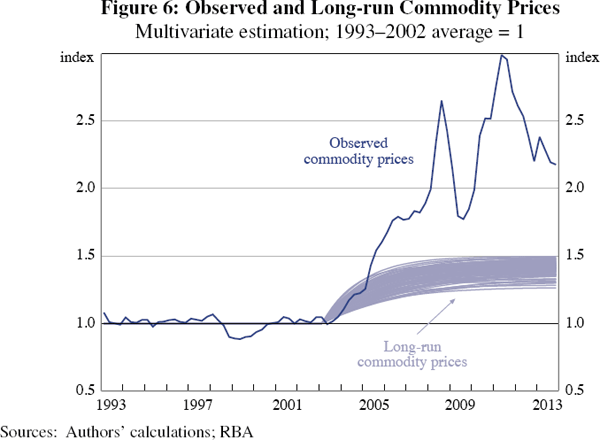
Figure 6 plots observed commodity prices and their estimated long-run level. Actual commodity prices were close to their estimated long-run level until 2005. After that, increases in commodity prices were mostly driven by a succession of large, but ultimately temporary, shocks. This result accords with the evidence in Plumb, Kent and Bishop (2013) that during this period the commodity price forecasts of Australian firms and policymakers were consistently lower than actual commodity price outcomes. If the increase in commodity prices was expected to be largely permanent with only small transitory deviations around its new, higher, level we would not expect to see such persistent forecast errors. Of course, the estimation was free to capture all of the increase in commodity prices after 2003 with an increase in the volatility of shocks to commodity prices. But it chose to explain some of the increase with a permanent change of the long-run level of commodity prices.
Next, we examine the implications of our model for other macroeconomic variables. Figure 7 shows the estimated transitional dynamics of the ratio of the price of non-tradeable goods to consumer goods, net exports to GDP, the real exchange rate and investment growth.[14]
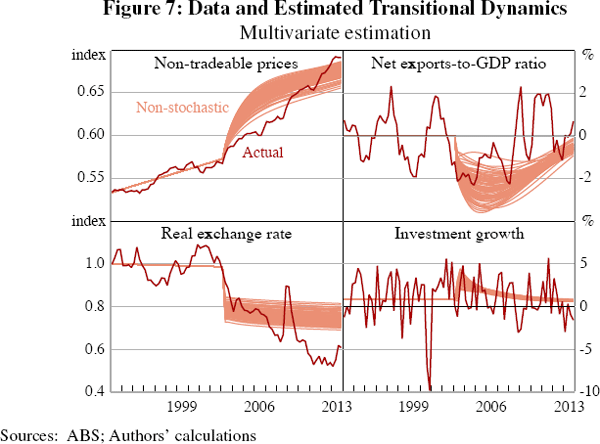
The top left panel of Figure 7 plots the observed relative price of non-tradeable goods and the posterior distribution of the transition induced by the estimated change in long-run commodity prices. Because of the wedge between non-tradeable inflation and consumer price inflation this relative price trends at a rate that is the same on both balanced growth paths. An increase in long-run commodity prices increases this wedge temporarily along the transition to a new balanced growth path. According to our model, the increase in the relative price of non-tradeable goods over recent years is largely explained by the shift in the long-run level of the terms of trade.
The top right panel of Figure 7 shows that an increase in the long-run commodity prices leads initially to a persistent increase in the trade deficit. This is explained in part by an increase in consumption, due to higher permanent income, and in part by an increase in investment as the productive capacity of the commodity sector expands, shown in the bottom right panel. Once again, the magnitude of these movements appears reasonable compared to the actual behaviour of these series, although they are of course also influenced by other demand, supply and commodity price shocks.
The bottom left panel indicates that the estimated increase in long-run commodity prices leads to a permanent 30 per cent appreciation of the real exchange rate. The actual appreciation of the real exchange rate over our sample was larger than this, reflecting the additional contribution of positive temporary commodity price increases, as well as other economic developments.
5.3 Single-equation Estimates
Next, we compare our inferences about long-run commodity prices with those obtained from single-equation estimates. Using the same priors, we estimate Equation (3) on the commodity price series alone. At the mode, we find a 114 per cent increase in the long-run level of commodity prices and a tripling in the volatility of shocks to commodity prices (although both variances are estimated to be lower than in our multivariate estimation).[15]
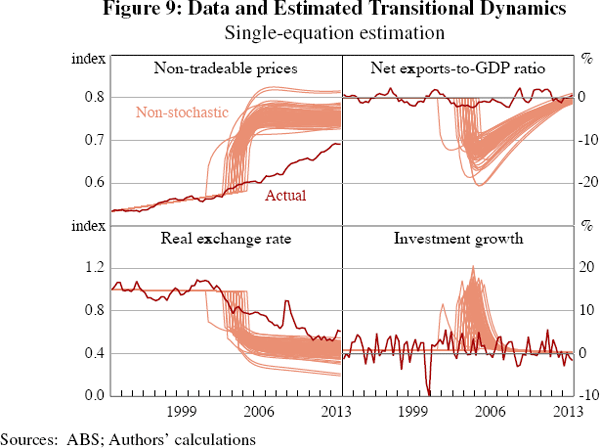
Figure 8 shows the posterior distribution of the implied transitional dynamics for long-run commodity prices from this single-equation exercise. One can fit the commodity price series better with smaller variances and a larger increase in the long-run mean. However, we consider this exercise to provide less plausible estimates of the long-run level of commodity prices because it relies on fewer observable variables. There is a trade-off in general equilibrium between fitting the commodity price series and fitting the other observables. We show this in Figure 9, which plots the transitional dynamics of the observable variables shown in Figure 7 calculated using the posterior distribution of long-run commodity prices from Figure 8.
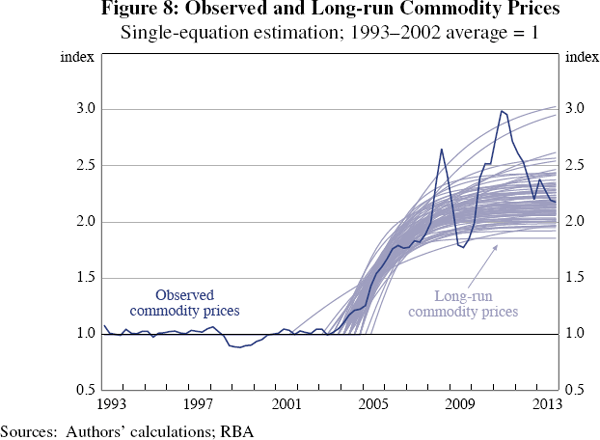
A 114 per cent increase in the long-run level of commodity prices would require larger shocks to explain the deviations between these non-stochastic transitional dynamics and the data. For example, the net exports-to-GDP ratio should have decreased by 15 percentage points and quarterly investment grown by close to 20 per cent. These numbers are far from the empirical regularities seen in the data.
This single-equation exercise is informative in two ways. First, because with theory in hand it allows us to assess the plausibility of reduced form estimates.
Second, it sheds light on how Δκ is identified in estimation. In principle, the estimation procedure was free to fit commodity prices as seen in Figure 8. The reason that it did not choose that parameterisation is because it comes at the expense of a significant loss of fit for the other observable variables.
Relative to the single-equation estimates, our general equilibrium estimation reduces the size of the estimated increase in long-run commodity prices from 114 per cent to 42 per cent and increases the precision of the estimates. It is fair to wonder whether our estimate of Δκ would equal zero if we were to remove commodity prices from the set of observable variables. In fact, we have run this estimation and find statistically significant evidence of a 20 per cent increase in Δκ.[16] The evidence for an increase in the long-run level of the terms of trade comes from all observable variables and not just from commodity prices.[17]
Footnotes
If one assigns equal prior probabilities to alternative model specifications, differences in the log marginal data densities can be interpreted as logged posterior odds. [12]
Our baseline model also outperforms alternatives in which: (i) we allow for a change in the long-run level of commodity prices but not in the volatility of commodity price shocks; and (ii) we allow for a change in the variance of shocks to commodity prices but not in the long-run level. [13]
In our model, the exchange rate is defined as the domestic price of foreign currency, so that an increase in the exchange rate represents a depreciation. [14]
We find a mode of 0.02 for σκ and a mode of 0.07 for
 .
We have also used the tests of Bai and Perron (1998) on the commodity price
series without placing priors and allowed up to a maximum of five breaks.
The tests prefer one break in 2003:Q3 and the estimates suggest a 90 per
cent increase of the long-run level of commodity prices.
[15]
.
We have also used the tests of Bai and Perron (1998) on the commodity price
series without placing priors and allowed up to a maximum of five breaks.
The tests prefer one break in 2003:Q3 and the estimates suggest a 90 per
cent increase of the long-run level of commodity prices.
[15]
These additional results can be found in our online appendix. [16]
At the same time, the fact that the results from the estimation excluding commodity prices differ from our baseline results indicates that we are not merely recovering agents’ beliefs about commodity prices. [17]