RDP 2000-06: Inflation Targeting and Exchange Rate Fluctuations in Australia 4. Empirical Results of Stochastic Simulations
September 2000
- Download the Paper 493KB
In this section we compare the stabilising properties of various specifications of a monetary-policy rule in stochastic simulations of the model described in Section 3.[9] Alternative specifications of the monetary-policy rule are compared according to their ability to minimise the variability (standard deviation) of selected macroeconomic variables, typically inflation and the output gap. In what follows, we define an ‘efficient’ policy rule as one that minimises the variability of four-quarter-ended aggregate inflation – the measure of inflation that the central bank ultimately aims to control – for given variability of the output gap, and vice versa. A ‘constrained-efficient’ or ‘feasible’ policy rule is defined as one which is efficient for given interest rate variability.
Before addressing the main question of the paper, we first examine (in Section 4.1) some properties of the typical monetary-policy rule based on aggregate inflation. In line with recent literature, we explore the possibility that rules which respond to forecasts of the feedback variables perform better than those which respond only to their lagged values. From this we determine the ‘optimal’ forecast horizon and then address the issue of excessive interest rate variability which tends to be generated by most policy rules.
In Section 4.2 and 4.3 we take these results a step further by examining whether or not monetary-policy rules which respond to forecasts of non-tradeable inflation or growth in non-tradeable unit labour costs are better able to stabilise the economy than rules which respond to forecasts of aggregate inflation. Section 4.4 discusses these results.
4.1 Properties of Efficient Rules Based on Aggregate Inflation
As in previous Australian studies, we allow for the possibility that forecasts of the output gap, in addition to inflation forecasts, could help improve the stabilising properties of these monetary-policy rules.[10] Including forecasts of the output gap (ψ2 > 0), and restricting ourselves to the same forecast horizons for both output and inflation, means that we are implicitly allowing policy to respond to information about future inflation beyond the horizon of the inflation forecast (that is, beyond f quarters). This is because forecasts of the output gap contain information regarding future inflation.
For Australia, de Brouwer and O'Regan (1997) found that, relative to a (non-forward-looking) Taylor rule, output and inflation variability could be improved by policy rules that included forecasts of the target variables up to two quarters ahead. When the forecast horizon was extended much beyond this, however, forward-looking rules tended to deliver worse outcomes. As noted by the paper's discussant (Macklem 1997), the forecasts which enter de Brouwer and O'Regan's forward-looking policy rules were conditional on the assumption of a constant nominal cash rate (which they called ‘no-policy-change forecasts’). This assumption is less appropriate the longer the forecast horizon, partly explaining why the optimal forecast horizon was only two quarters.
de Brouwer and Ellis (1998) investigated forward-looking rules for Australia in which forecasts of the target variables were conditional on the assumption that the policy-maker actively applies the same policy rule (as opposed to the same nominal interest rate) over the forecast horizon. Using this approach, they found that the optimal forecast horizon was around one year. de Brouwer and Ellis' use of model consistent forecasts provides a more realistic characterisation of actual policy because they allow for the effect of the appropriate future policy on forecast values. It is not consistent for a policy-maker to knowingly set interest rates today with a rule that uses forecasts based on inappropriate future policy. The forward-looking policy rules in this paper use forecasts of the feedback variables which are fully model consistent.
Figure 5 shows the variability of output and inflation calculated from simulations of our model where the forecast horizon (f–) in Equation (7) was increased from −1 to 8 (assuming λ = 0).
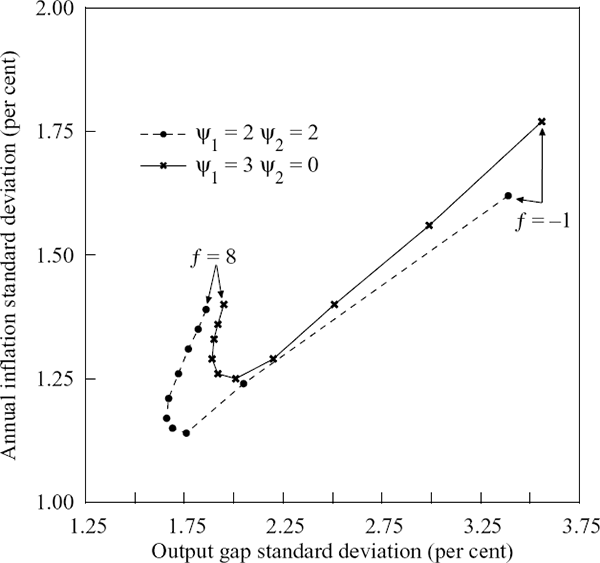
As Figure 5 shows, backward-looking rules (f = −1) are clearly inferior. For ψ1 = ψ2 = 2, the ‘best’ forecast horizon is around 2 to 3 quarters, depending on the (unspecified) preferences of the policy-maker. This accords with the control lag of policy in this model – it takes two quarters before a policy tightening begins to reduce inflation through the ‘exchange rate’ channel and three quarters through the ‘aggregate demand’ channel. Consistent with existing evidence on forward-looking rules, there is also a limit to how forward-looking the policy rule can be before it begins to generate worse outcomes. At longer horizons, unforeseen shocks can drive actual outcomes a long way from the forecasts, so that in the current period, policy is responding to relatively poor forecasts.
For ψ1 = 3 and ψ2 = 0, corresponding to an inflation-forecast only rule, the optimal length for the forecast horizon is between 3 and 5 quarters. The position of this frontier relative to the ψ1 = ψ2 = 2 frontier also indicates that excluding the output gap from the rule results in inferior outcomes.
Experiments with a range of different reaction weights revealed that the optimal forecast horizon was generally longer the lower the ratio of ψ2 to ψ1. A lower relative weight on output means that the policy-maker gets less ‘headstart’ in controlling inflation (given that the output gap helps forecast inflation at least two periods further ahead) and consequently, the optimal forecast horizon is longer to compensate for this.
We take up the question of interest rate variability shortly, but it is worth noting here that for given reaction weights, interest rate variability is decreasing in f. The policy rule delivers a path for the nominal interest rate that returns the economy to equilibrium in the assumed absence of future shocks. With model consistent forecasts, applying the policy rule with a longer forecast horizon implies the economy is expected to be closer to equilibrium. Accordingly, as f increases, the interest rate moves by less for given reaction coefficients.
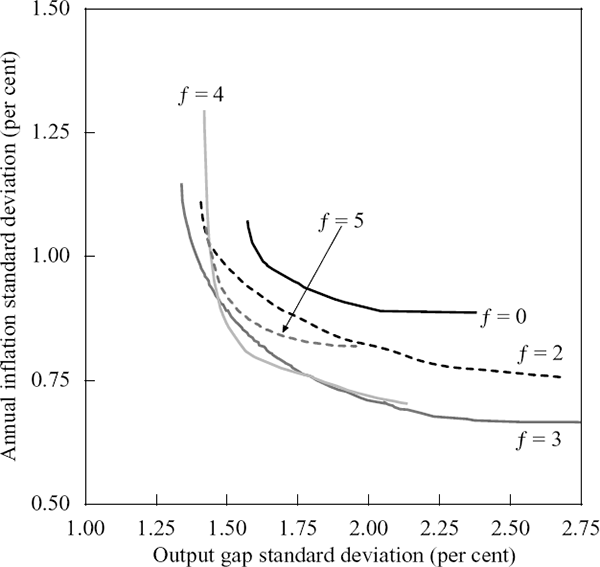
Figure 6 shows the efficient policy frontiers corresponding to different forecast horizons (still with no smoothing) in the benchmark policy rule.[11] For each forecast horizon, the efficient frontier was derived by simulating the model for a range of reaction weights in the benchmark policy rule and selecting only those rules which minimised the variability of inflation for given variability in the output gap (or vice versa). The efficient frontiers for f = 3 and f = 4 generally dominate each of the other forecast horizons – increasing the forecast horizon in the benchmark policy rule beyond four periods results in worse outcomes.
The results so far indicate that most forward-looking policy rules produce better outcomes than backward-looking rules. However, the apparent ‘efficiency’ of such rules belies a serious problem.
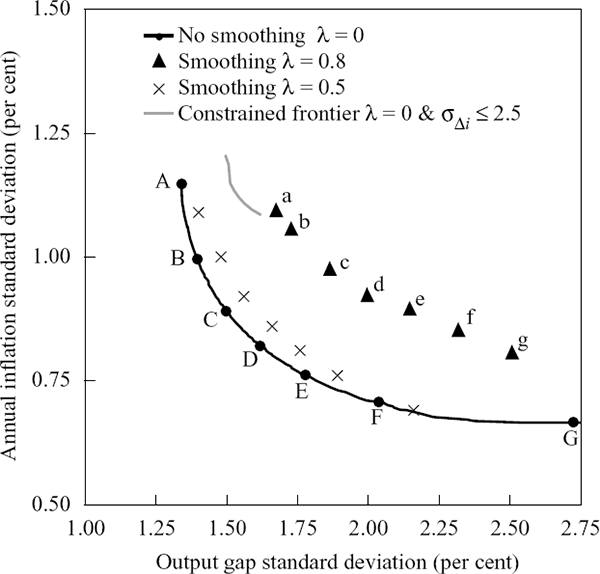
The solid line in Figure 7 corresponds to the f = 3 efficient frontier in Figure 6. Along this frontier we have isolated a representative sample of efficient rules labelled ‘A’ to ‘G’. The reaction weights and performance of the (model) economy under each of these rules are summarised in Table 1.
| Ψ1 | Ψ2 | Unconditional standard
deviation Per cent |
ρ | |||||
|---|---|---|---|---|---|---|---|---|
| πA | πNT | y − yP | Δi | rer | ||||
| A | 8 | 20 | 1.15 | 1.01 | 1.34 | 12.64 | 10.09 | 0.54 |
| B | 12 | 12 | 1.00 | 0.93 | 1.40 | 7.75 | 8.03 | 0.43 |
| C | 22 | 10 | 0.89 | 0.85 | 1.50 | 9.06 | 7.84 | 0.33 |
| D | 30 | 8 | 0.82 | 0.82 | 1.62 | 10.20 | 7.68 | 0.19 |
| E | 38 | 6 | 0.76 | 0.81 | 1.78 | 11.98 | 7.63 | 0.00 |
| F | 50 | 4 | 0.71 | 0.81 | 2.04 | 16.22 | 7.78 | −0.28 |
| G | 80 | 0 | 0.67 | 0.83 | 2.72 | 33.54 | 9.02 | −0.70 |
Note: ρ is the first autocorrelation coefficient of Δ i. |
||||||||
Moving along the efficient frontier from ‘A’ to ‘G’ in Figure 7, the weight on inflation (ψ1) relative to output (ψ2) in each of the rules increases and the variability of inflation is gradually decreased. These efficient weights, however, are much larger than the weights typically associated with policy rules.[12] Consistent with this, all of the efficient rules (especially those at either end of the frontier) generate extremely high variability of quarterly changes in the nominal interest rate. This variability is such that the nominal interest rate is negative almost as often as it is positive. (The simulations allow nominal interest rates to be negative, even though this cannot occur in practice.)
A number of recent studies have attempted to reconcile the finding of high interest rate variability implied by most economic models with the much lower interest rate variability typically seen in practice. One explanation is that economic models ignore various forms of uncertainty which might, in practice, make monetary policy less activist following most types of shocks. The growing literature on the implications of uncertainty for monetary policy is summarised by Batini, Martin and Salmon (1999), Armour and Côté (2000) and Apel et al (1999). Shuetrim and Thompson (1999) and Debelle and Cagliarini (2000) examine the implications of uncertainty for monetary policy in an Australian context.
While we do not deal with these issues here, we acknowledge that our model ignores a number of sources of uncertainty which the policy-maker faces in practice. This encouraged us to explore various ways of resolving the issue of excessive interest rate variability.
As a first attempt to redress the problem, we investigated specifications of the policy rule with a positive smoothing parameter (λ > 0). There are a number of practical issues associated with imposing a value for λ greater than zero in Equation (7). From the point of view of trying to reduce variability in the nominal interest rate, searching over a range of reaction weights for the efficient frontier with positive smoothing is futile. This is because the new efficient weights will be higher than the no-smoothing case in order to offset the effect of the smoothing.
Alternatively, it is possible to map out a new frontier using a set of reaction weights equal to the no-smoothing efficient weights and then applying a smoothing parameter greater than zero. Conceptually, this is equivalent to multiplying the no-smoothing efficient reaction weights by the smoothing parameter.
Figure 7 shows the result of applying a smoothing factor of λ = 0.5 and λ = 0.8 to the set of efficient reaction weights in Table 1.[13] The set of rules labelled (lowercase) ‘a’ to ‘g’, for example, use the same reaction weights as the corresponding (uppercase) rules ‘A’ to ‘G’ in Table 1, but with the smoothing parameter λ = 0.8. As must be the case when an additional constraint is placed on the model, the new policy frontier with positive smoothing is further from the origin. However, Table 2, which summarises the performance of the economy under each of these rules, shows that the reduction in interest rate variability is nowhere near enough, even with a smoothing factor of λ = 0.8. Relative to the equivalent no-smoothing rules in Table 1, the serial correlation of changes in the interest rate is higher for the rules in Table 2.
| Ψ1 | Ψ2 | Unconditional standard
deviation Per cent |
ρ | |||||
|---|---|---|---|---|---|---|---|---|
| πA | πNT | y − yP | Δi | rer | ||||
| a | 8 | 20 | 1.10 | 1.11 | 1.66 | 3.62 | 7.65 | 0.66 |
| b | 12 | 12 | 1.06 | 1.07 | 1.70 | 3.19 | 7.18 | 0.68 |
| c | 22 | 10 | 0.97 | 1.04 | 1.82 | 4.05 | 7.20 | 0.66 |
| d | 30 | 8 | 0.92 | 1.04 | 1.95 | 4.76 | 7.33 | 0.64 |
| e | 38 | 6 | 0.88 | 1.06 | 2.10 | 5.51 | 7.57 | 0.62 |
| f | 50 | 4 | 0.84 | 1.07 | 2.26 | 6.63 | 8.08 | 0.59 |
| g | 80 | 0 | 0.79 | 1.08 | 2.46 | 9.07 | 9.14 | 0.50 |
Note: ρ is the first autocorrelation coefficient of Δ i. |
||||||||
While the serial correlation of quarterly changes in the interest rate is higher for the rules in Table 2 (compared with Table 1), the variability of interest rates is still too high and consequently we abandoned further efforts with non-zero smoothing parameters.
Our alternative, and inevitably successful, way of limiting interest rate variability was to search over the entire grid of reaction weights – both on and off the efficient frontier – for the set of rules which deliver arbitrarily low variability of the interest rate. Specifically, we searched for the ‘feasible’ frontier of rules which generated a standard deviation of changes in the interest rate no greater than 2½ percentage points. Admittedly, this variability is still high by historical standards, but in simulations these rules rarely resulted in negative nominal interest rates.[14] Unreported results also indicated that the most efficient ‘feasible’ frontier still corresponded to f = 3.
The solid grey line in Figure 7 is the constrained efficient frontier for f–= 3. The magnitude of the loss associated with these feasible rules (around one quarter of a percentage point increase in the standard deviation of either inflation or output) is quite small, given the significant reduction in interest rate variability. Consistent with this, the reaction weights are now much lower. This result echoes the finding of Lowe and Ellis (1997) for Australia that, in the context of optimal policy, moderate interest rate smoothing (and stabilisation) does not come at great cost in terms of output and inflation variability.
Compared with the unconstrained frontier, however, the feasible frontier is severely truncated. The range of efficient outcomes decreases as the constraint on interest rate variability is tightened. Moreover, unlike the unconstrained frontier, the feasible frontier is less convex. The truncation also applies more to inflation variability than to output variability because low inflation variability requires strong reactions to movements in the exchange rate. Output, on the other hand, is a lot less sensitive to the exchange rate. Put another way, a bigger increase in interest rate variability is needed to ‘buy’ a given decrease in inflation variability than the same decrease in output variability.
The results so far have indicated that policy rules which include forecasts of the feedback variables tend to produce better outcomes than those that respond only to lagged values. These rules, however, tend to generate an inordinate amount of interest rate volatility. One solution to this problem is to constrain the rules to a feasible level of interest rate variability. Such a constraint tends to worsen outcomes in terms of inflation and output variability. We build on these foundations to explore further modifications to the benchmark policy rule in the next section. In particular, we investigate whether or not the constraint on interest rate variability is less deleterious when the monetary-policy rule uses a measure of inflation which is less sensitive to exchange rate fluctuations.
4.2 Different Measures of Inflation in the Policy Rule
We first substitute non-tradeable inflation for aggregate inflation in the benchmark policy rule. Notwithstanding the fact that these rules can still include the output gap, we refer to them as ‘non-tradeable inflation rules’. As we showed earlier, such a measure of inflation is less susceptible to the direct effect of temporary exchange rate shocks because it excludes the prices of imported final consumption goods and services. But the exchange rate still affects non-tradeable inflation through the prices of imported intermediate imports. Recall also that our specification of the unit labour cost Phillips curve with inflation expectations proxied by past aggregate inflation means that exchange rate shocks can feed into inflation expectations and hence, into wages and inflation in the non-tradeable sector.
Figure 8 compares the efficient frontier for three-period-ahead aggregate inflation rules (from before) with those generated from policy rules that respond to forecasts of non-tradeable inflation (and the output gap) at various horizons. At this point, we compare frontiers without any restriction on interest rate variability. Note also that, which ever measure of inflation the central bank responds to, it is aggregate inflation and output gap variability that it is assumed to care about.
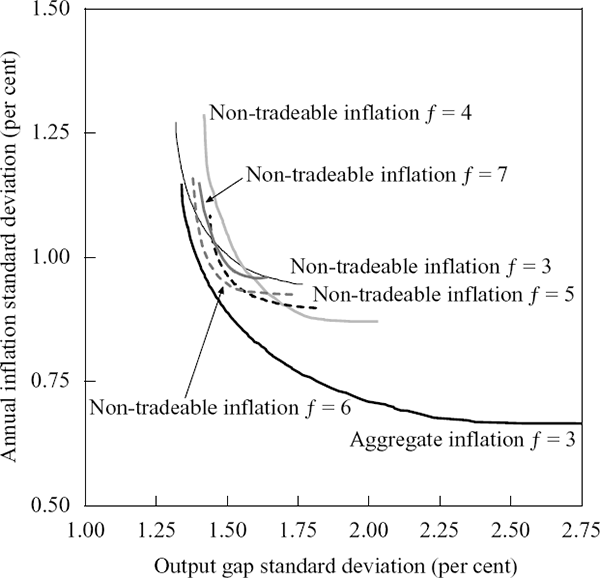
Depending on the (unspecified) preferences of the policy-maker, the optimal forecast horizon for the unconstrained non-tradeable inflation rules can be between three and six quarters. A central bank which cared a lot about aggregate inflation variability, for example, would be better served by following a non-tradeable inflation rule with a four-quarter forecast horizon (f = 4). In this case, because the central bank cares more about aggregate inflation variability than output gap variability, but responds to non-tradeable inflation (which policy takes longer to affect through the exchange rate channel) then it makes sense to adopt a longer forecast horizon. This contrasts with Figure 6, where under an aggregate inflation rule, the optimal forecast horizon for a central bank which cared most about aggregate inflation variability was three periods.
Despite all this, Figure 8 shows that none of the efficient frontiers for non-tradeable inflation rules (regardless of forecast horizon) dominates the efficient frontier for the benchmark aggregate inflation rule with f = 3. Responding to a measure of inflation that abstracts from temporary exchange rate movements appears to buy little in terms of output and aggregate inflation variability, at least given our model and the shocks that have typically hit the Australian economy.
According to Equation (A3), non-tradeable inflation is almost entirely determined by domestic labour costs – the estimated long-run elasticity of non-tradeable prices with respect to unit labour costs is 0.915 (compared with an elasticity of 0.568 for aggregate prices). This motivates our next modification to the benchmark policy rule – changing the measure of inflation to growth of unit labour costs in the non-tradeable sector. In these rules, which we refer to as ‘unit labour cost growth rules’, the interest rate responds to the forecast deviation of unit labour cost growth from target (also assumed to be 2½ per cent per annum – see Section 3.2) and forecasts of the output gap.
Figure 9 compares the efficient frontier for three-period-ahead aggregate inflation rules (our benchmark) with those generated from unit labour cost growth rules of various forecast horizons (still with no constraint on interest rate variability).
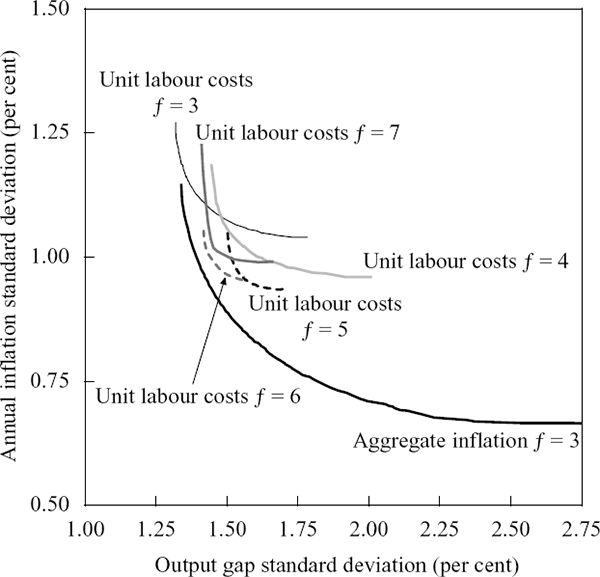
The optimal forecast horizon for the unconstrained unit labour cost growth rules is around five to six quarters. More importantly, there still do not appear to be any gains from making policy respond to the growth of non-tradeable sector unit labour costs rather than aggregate inflation – the benchmark f = 3 efficient frontier for aggregate inflation rules dominates the efficient frontiers for unit labour cost growth rules at all forecast horizons.
4.3 Comparing Feasible Frontiers for Policy Rules
The efficient frontiers for non-tradeable inflation and unit labour cost growth rules shown in Figures 8 and 9 suffer from somewhat less interest rate variability than those implied by the aggregate inflation rule, but this variability is still extremely high. As in Section 4.1, our solution to this problem was to constrain the rules to those which generated a standard deviation no greater than 2½ percentage points in changes in the nominal interest rate. Figure 10 shows the set of constrained frontiers for each of the three-period-ahead forecast rules that we have considered.
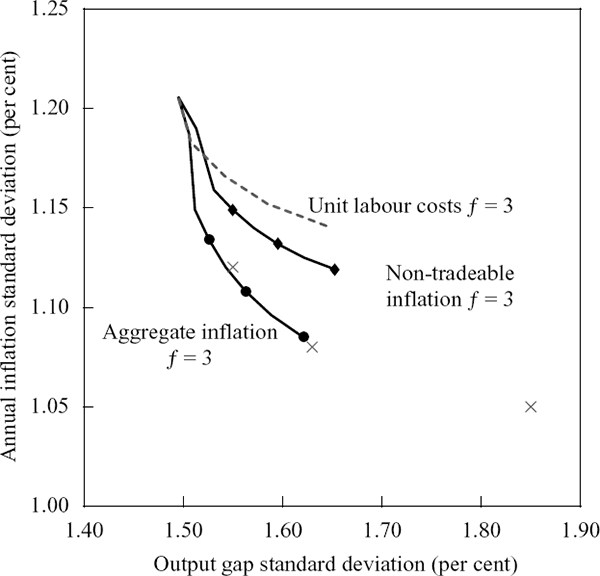
The efficient rule at the north-west extreme of each constrained frontier corresponds to a rule which only has reaction weight on output (ψ1 = 0 and ψ2 > 0). This explains why the efficient frontiers converge at this point irrespective of the inflation measure used in the rule.[15] The reaction weights corresponding to rules along the feasible frontiers are a lot smaller than those which characterise the efficient frontier when there is no constraint on interest rate variability. In order to generate lower interest rate variability, these rules specify that the interest rate responds by less for a given deviation of inflation from target (or output gap) than would be the case on the unconstrained efficient frontier.
Table 3 summarises the stochastic behaviour of the economy using three different sets of reaction weights. These reaction weights correspond to constrained efficient rules in the class of three-period-ahead forecast aggregate inflation rules (they are marked by black dots along the constrained efficient frontier for aggregate inflation rules in Figure 10). The same reaction weights also correspond to efficient rules in the class of three-period-ahead non-tradeable inflation rules (marked by triangles along the constrained efficient frontier for non-tradeable inflation rules) but they generate too much variability in changes in the nominal interest rate to also make it into the set of feasible three-period-ahead unit labour cost growth rules. That is, the crosses do not lie on the feasible frontier represented by the dotted line. In that sense, the results in Table 3 for the unit labour cost growth rules understate the variability in inflation and output but overstate interest rate variability.
|
Rule specification (f =3) |
Unconditional standard deviation Per cent |
|||||
|---|---|---|---|---|---|---|
| πA | πNT | y − yP | Δi | rer | ||
| Ψ1 = 2 | Ψ2 = 4 | |||||
| Aggregate inflation | 1.13 | 1.08 | 1.53 | 2.46 | 7.14 | |
| Non-tradeable inflation | 1.15 | 1.09 | 1.55 | 2.45 | 7.25 | |
| Unit labour cost growth (a) | 1.12 | 1.07 | 1.55 | 3.05 | 7.22 | |
| Ψ1 = 3 | Ψ2 = 3 | |||||
| Aggregate inflation | 1.11 | 1.05 | 1.56 | 2.44 | 6.96 | |
| Non-tradeable inflation | 1.13 | 1.07 | 1.59 | 2.42 | 7.12 | |
| Unit labour cost growth (a) | 1.08 | 1.04 | 1.63 | 3.62 | 7.18 | |
| Ψ1 = 4 | Ψ2 = 2 | |||||
| Aggregate inflation | 1.09 | 1.03 | 1.62 | 2.49 | 6.74 | |
| Non-tradeable inflation | 1.12 | 1.06 | 1.65 | 2.46 | 6.97 | |
| Unit labour cost growth (a) | 1.05 | 1.05 | 1.85 | 4.81 | 7.48 | |
Note: (a) These rules are not on the feasible frontier for unit labour cost growth rules – the standard deviation of quarterly changes in the nominal interest rate generated by these rules is greater than 2.5 per cent. They correspond to the crosses in Figure 10. |
||||||
For given reaction weights, the results in Table 3 show that non-tradeable inflation rules generate less stability in all variables except changes in the interest rate. Moreover, the unit labour cost growth rules generate less variability in inflation, but more variability in output and changes in the interest rate. It is worth noting here that all of the rules in Table 3 produce inflation variability that would probably be tolerated under the flexible inflation-targeting framework in place in Australia.
The results presented in Table 3 are consistent with the evidence presented earlier in this section – even when a constraint is placed on interest rate variability, policy rules which respond to forecasts of non-tradeable inflation or even unit labour cost growth do not, so far as we have seen here, perform any better than rules which respond to forecasts of aggregate inflation.
Note that the results in Table 3 related only to three-period-ahead forecast rules. However, similar to the results in Figures 8 and 9, the most efficient outcomes in the class of constrained non-tradeable inflation and unit labour cost growth rules actually occur with forecast horizons greater than three periods. Despite this, the most efficient constrained frontiers for these rules still lie further from the origin than the f = 3 constrained frontier for the aggregate inflation rule. Regardless of the forecast horizon then, constrained aggregate inflation rules do not appear to generate worse outcomes than the most efficient constrained non-tradeable inflation and unit labour cost growth rules.
4.4 Discussion of Results
For a once-off shock to the exchange rate, the impulse responses in Figure 4 showed that a non-tradeable inflation rule generated modestly higher variability in the output gap than an aggregate inflation rule. For policy, this result is not terribly informative because it is based on the effect of just a single shock. Stochastic simulations provide a more realistic setting in which to assess alternate policy rules because they allow for the possibility that a number of shocks can affect the economy at any one time. As we have seen in the previous two sections, the results from the stochastic simulations also indicate that non-tradeable inflation (and unit labour cost growth) rules perform no better at stabilising the economy than aggregate inflation rules.
As with any paper which generates results using a model, our results are model dependent. Consequently, conclusions based on these results will only be relevant to the extent that our model is an accurate reflection of the actual economy. In this section we explore a number of simple modifications to the model in order to test the robustness of the results.
In order to explore the possibility that exchange rate shocks have been less relevant for Australia than domestically sourced shocks (and hence, that alternative interest rate rules are not as appropriate for Australia as they might be for some other countries), we first conducted simulations of the model in which the variance of real exchange rate shocks was scaled to be five times greater than that implied by the empirical estimates of the real exchange rate equation. The resulting feasible frontiers for each policy rule (aggregate inflation, non-tradeable inflation and unit labour cost growth) were further from the origin (as one would expect) but the ranking of the rules was not changed.
A second issue concerns our empirical finding that interest rates affect the exchange rate with a one period lag. Because this is likely to be at odds with what many think to be the case, and because any superiority of a rule based on non-tradeable inflation should stem from (temporary) exchange rate effects being particularly quick, we also performed simulations of the model in which the interest rate had a contemporaneous effect on the exchange rate. Again, the ranking of the frontiers was unchanged.
A third issue relates to our treatment of inflation expectations. In the unit labour cost Phillips curve (Equation (A4)) we assumed that workers in the non-tradeable sector bargain for their wages on the basis of expected aggregate inflation which, as we have already seen, is more susceptible to exchange rate shocks, than non-tradeable inflation. This means that exchange rate shocks which show up in aggregate inflation will eventually feed into unit labour costs, and hence, inflation in the non-tradeable sector. An alternate assumption – that wages are determined by expected non-tradeable inflation – was less readily accepted by the data and, in any case, did not result in a different ordering of the three rules.
A fourth issue relates to how well we have captured the distinction between aggregate and non-tradeable inflation. In Bharucha and Kent's theoretical model the distinction between tradeable and non-tradeable inflation was imposed by assuming that there was no non-tradeable component in the final price of tradeable goods – tradeable inflation was entirely determined by changes in the exchange rate (assuming that the world price of tradeable goods was constant). By implication, the distinction between aggregate inflation (weighted sum of tradeable and non-tradeable inflation) and non-tradeable inflation in the model must also benefit from this assumption governing tradeable prices.
In contrast, the distinction between aggregate and non-tradeable inflation in our estimated model depends entirely on actual data, for which Bharucha and Kent's assumption regarding tradeable prices is not borne out. Tradeable prices – implied by the difference between aggregate and non-tradeable prices – include a significant non-tradeable component associated with bringing those goods to the retail market. Because of this, our distinction between the determinants of aggregate and non-tradeable inflation will be less clear than the distinction assumed in Bharucha and Kent's theoretical model. Even though our econometric estimates of the long-run determinants of aggregate and non-tradeable inflation (in Equations (A2) and (A3)) are quite distinct, it is the short-run dynamics of each of these equations which are likely to matter most when ranking rules according to their impact on inflation and output variability in stochastic simulations of the model. In this respect, it is possible that the short-run dynamics are not very distinct and on this basis we would expect to see less difference between the behaviour of the economy under aggregate and non-tradeable inflation rules than that presented in Bharucha and Kent.
In an attempt to further distinguish the two inflation processes, however, we dropped the direct influence of aggregate inflation on inflation in the non-tradeable sector (the Δpt−1 term in Equation (A3)). In simulations of this modified version of the model the ranking of the rules was again unchanged.
It may also be the case that one should distinguish between output in the two sectors in order to more fully capture price determination in the respective sectors. We did not attempt this in this paper, but we acknowledge that the distinction between an aggregate and non-tradeable output gap is likely to be more important for the unit labour cost Phillips curve than for the inflation equations. This is because the output gap is only meant to capture the effect of the mark-up in each of the inflation equations, but acts as a demand pressure variable in the Phillips curve equation.
Finally, we note that the persistence of exchange rate shocks could be an important consideration in the context of comparing aggregate and non-tradeable inflation rules. For example, exchange rate shocks may be more persistent, or at least expected to be more persistent, than we modelled here. While we did not experiment with the persistence of exchange rate shocks, we note that increased persistence of exchange rate shocks would actually argue more for the use of an aggregate inflation rule and there appears to be no need to provide further evidence in support of such a rule than we have already presented.
Footnotes
For each specification of the policy rule, the model is solved over 100 periods, with a new random draw of shocks imposed on the economy each period. The distribution of these shocks was based on the distribution of the residuals from the estimated equations in the model. In this way, our stochastic simulations embody the actual historical correlations of shocks that buffeted the economy over the period from 1985 to 1998. The properties of the shocks and the procedure for generating the stochastic simulations is described in more detail in Appendix C. [9]
The usual practice in evaluating forward-looking rules is to test whether the addition of current output to an inflation forecast rule improves outcomes (see, for example, Batini and Haldane (1999) and Black, Macklem and Rose (1997)). Typically, the improvement is slight. Batini and Haldane argue that inflation-forecast-only rules are already able to smooth output because they recognise the importance of output to future inflation – that is, they are already ‘output encompassing’. [10]
The ‘bumps’ in the efficient frontiers reflect the fact that we have not searched over a sufficiently fine grid of reaction weights to generate the typically smooth convex curves. [11]
The original Taylor (1993) rule, for example, had weights of 0.5 on lagged inflation and 0.5 on the lagged output gap. In their forward-looking Taylor rule, Clarida, Galí and Gertler (2000) estimated reaction weights for the US of a similar order of magnitude to Taylor's original weights. [12]
A smoothing parameter of λ = 0.5 is in line with what Batini and Haldane (1999) considered appropriate for the UK and a little lower than the smoothing parameter which Smets (1997) estimated for Australia. [13]
The variance of the change in a variable is roughly equal to 2(1−ρ) multiplied by the variance in the level, where ρ is defined as the first autocorrelation coefficient of the levels. In simulations the first autocorrelation coefficient of the level of the nominal interest rate was around 0.7 – lower than the actual historical value of around 0.9. A standard deviation of 2½ percentage points on the change in the nominal interest rate therefore translates into a standard deviation of just over 3 percentage points in the level of the nominal interest rate. This is still a bit high but in a representative simulation (with an inflation target of 2½ and neutral real interest rate of 3½) the nominal interest rate was negative only 4 per cent of the time. [14]
Strictly speaking, they all asymptote to infinite inflation variability because there is no control over inflation if the nominal interest rate does not respond directly to price shocks. [15]