
Statement on Monetary Policy – August 2026 1. Financial Conditions
Summary
- The cash rate increases from earlier in the year have tightened financial conditions. Banks have passed on the three cash rate increases to deposit and lending rates. Scheduled mortgage payments have increased relative to household disposable income to be close to their 2024 peak. The Australian dollar is higher than at the start of the year, consistent with policy tightening more than in other advanced economies. Some measures of financial conditions have eased since May. In particular, the market path for the cash rate has declined, which has also contributed to a depreciation of the Australian dollar.
- Financial conditions appear to be somewhat restrictive. The cash rate is at the top of the range of central estimates of neutral both from our models and from market economists. Conditions in the established housing market have softened by more than expected and housing prices have declined over recent months, reflecting the effects of cash rate increases and tax changes announced in the federal budget and after a long period of very strong growth. Demand for new housing loans has declined noticeably. Even so, funding remains readily available for banks, households and businesses, supported by low risk premia in financial markets.
- Expectations for further cash rate increases have receded. While global oil prices have been volatile, a decline in prices since the time of the May Statement and some weaker-than-expected domestic data have contributed to a shift lower in the market path for the cash rate. Market participants are now pricing in about half a chance of a cash rate increase by the end of the year and see very little chance of an increase in August.
- Lower energy prices since the May Statement have also reduced expectations for policy tightening in some other advanced economies, though markets still expect many peer central banks to raise rates before the end of the year. Several central banks have already raised policy rates in 2026, reflecting a mix of domestic factors and the inflationary effects of the Middle East conflict. In the United States, resilient activity and persistent inflation have contributed to a higher expected policy rate path over recent months.
- Government bond yields have increased further in some advanced economies but are slightly lower in Australia. The increase in the United States has been driven by a rise in real yields, alongside higher policy rate expectations. In Australia, bond yields are a little lower than their level at the time of the May Statement and have declined relative to most other advanced economy markets. Inflation compensation has eased in most economies, including Australia, as oil prices are below their earlier peak.
- Risk premia remain low in advanced economy corporate funding markets. Equity prices have generally risen since the previous Statement. In Australia, this has occurred despite a small decrease in corporate earnings expectations over this period, while equity prices in many other markets have been supported by strong corporate earnings growth. However, equity prices of some foreign AI-related companies have become increasingly volatile as investors have reassessed valuations and the prospective returns from data centre investment, resulting in very large declines in Korean and Taiwanese equity markets. Equity prices have received some additional support as investors became less concerned that the Middle East conflict will materially disrupt the global economy and have been resilient overall even as the conflict re-escalated. Corporate bond spreads have tightened a little in some markets and are low compared with historical averages.
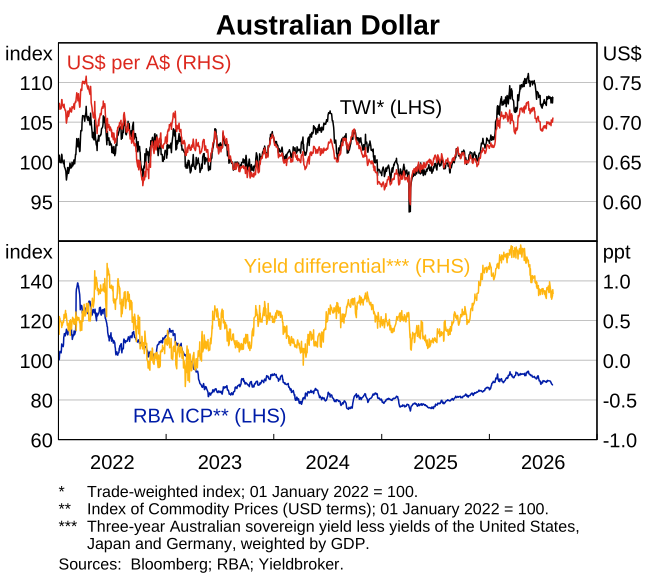
- The Australian dollar has depreciated on a trade-weighted (TWI) basis since the May Statement but remains around 5 per cent higher than at the start of the year. The depreciation of late has been underpinned by a narrowing in yield differentials between Australia and other advanced economies and declines in some commodity prices. The nominal TWI remains broadly consistent with estimates of its long-run equilibrium level.
1.1 Interest rate markets
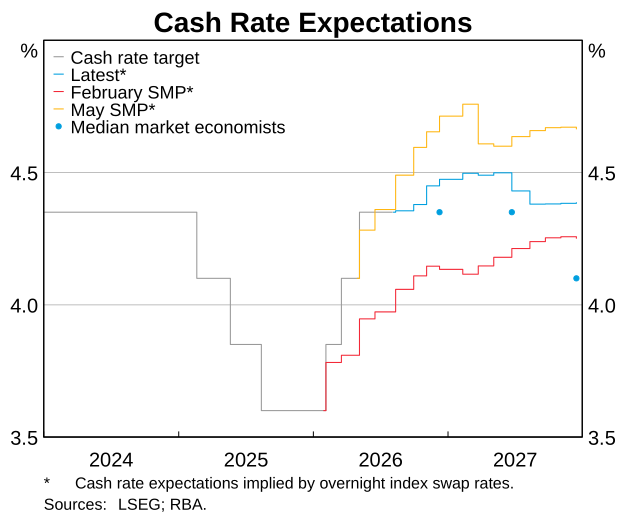
The market path for the cash rate has declined since the May Statement.
Market participants are pricing in around ½ a rate hike by the end of 2026, down from a projected 1½ increases at the time of the May Statement (Graph 1.1). Pricing implies almost no expectation among market participants that an increase will occur in August. The decline in the market path since the May Statement reflects lower global oil prices and some weaker-than-expected domestic data. Developments in the Middle East conflict and the associated moves in global oil prices contributed to some volatility in the market path over this period. Most market economists tracked by staff expect the cash rate to remain unchanged over the next year and around two-thirds expect at least one reduction in the cash rate by the end of 2027. However, a small minority continue to expect a further increase in the cash rate this year.
Financial conditions in Australia appear somewhat restrictive.
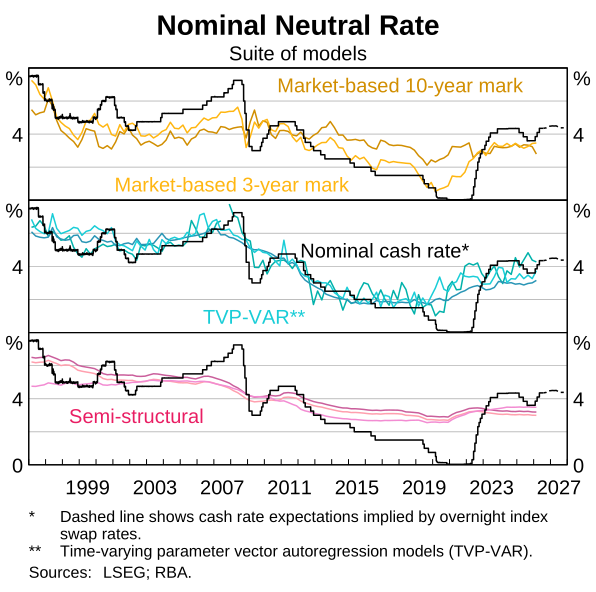
The cash rate is at the top of the range of model-based central estimates of neutral (Graph 1.2).1 Other indicators also suggest that financial conditions are somewhat restrictive, such as conditions in the established housing market and housing credit growth (discussed below), the observed slowing in the growth of aggregate demand and the easing in labour market conditions (see Chapter 2: Economic Conditions). However, this judgement remains uncertain. The range of central estimates of neutral across models is wide, and each central estimate is imprecise. Spreads between lending rates and the cash rate also remain low by historical standards, reflecting low risk premia, favourable funding conditions and strong competition in lending markets (discussed below). These trends contribute to financial conditions being less restrictive than they otherwise would be for a given level of the cash rate and may not be well captured in some model estimates of neutral.
Expectations for the US policy rate have risen further and while expectations for rate rises by some peer central banks have eased, markets still expect many of them to also tighten policy in the months ahead.
In the United States, resilient economic activity and persistent inflation have supported expectations of tighter monetary policy (Graph 1.3). US growth remains resilient, supported by strong data centre investment and household consumption, while the labour market continues to show signs of stabilisation. Inflation has moderated from its peak earlier this year but remains elevated. Recent communications from US Federal Reserve (Fed) Chair Warsh and other officials have emphasised upside risks to price stability. Even so, the Fed left its policy rate unchanged at its July meeting and Chair Warsh emphasised that higher bond yields had tightened financial conditions. His remarks were generally interpreted as reducing the likelihood of a near-term rate increase and also led to increased uncertainty about the Fed’s reaction function. Markets nevertheless continue to price at least one increase in the federal funds rate this year.
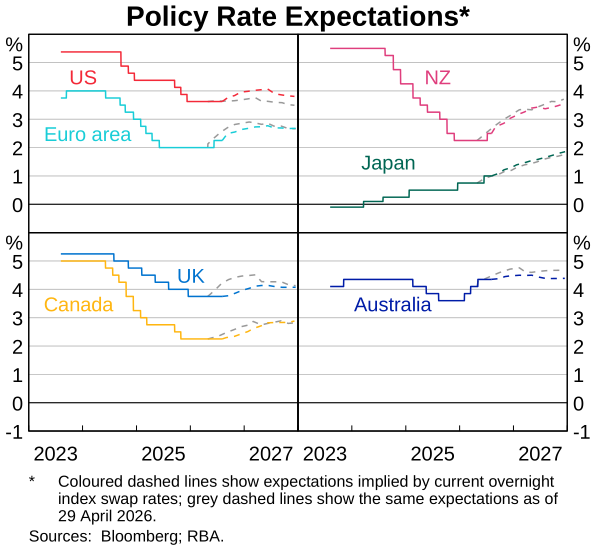
Several advanced economy central banks have increased policy rates this year, driven by a mix of domestic factors and inflationary pressures associated with the conflict in the Middle East. The European Central Bank explicitly linked its June decision to the conflict, citing more persistent inflationary pressures and the risk of broader pass-through of higher energy prices. The Bank of Japan and Reserve Bank of New Zealand also raised policy rates from relatively low levels, with their decisions to bring policy to a more neutral stance following assessments that upside risks to inflation outweighed concerns about growth. Other central banks that have left their policy rates unchanged have generally indicated that tighter policy may be required if broader inflationary pressures emerge from conflict in the Middle East (while noting there has been little evidence of this to date). Expectations for policy tightening have generally eased since early May, but most central banks are still expected to raise policy rates before the end of this year. Policy rate expectations for many economies initially fell on earlier signs of a resolution to the conflict in the Middle East and an easing in oil prices but rose following its re-escalation.
Meanwhile, Chinese authorities have kept policy rates unchanged and maintained a ‘moderately accommodative’ monetary policy stance, amid persistently low inflation and weak private sector demand for credit.
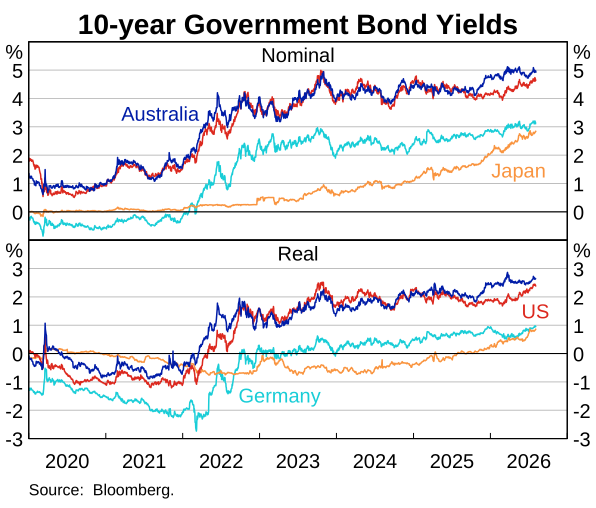
Government bond yields have increased in some advanced economies but are slightly lower in Australia since May.
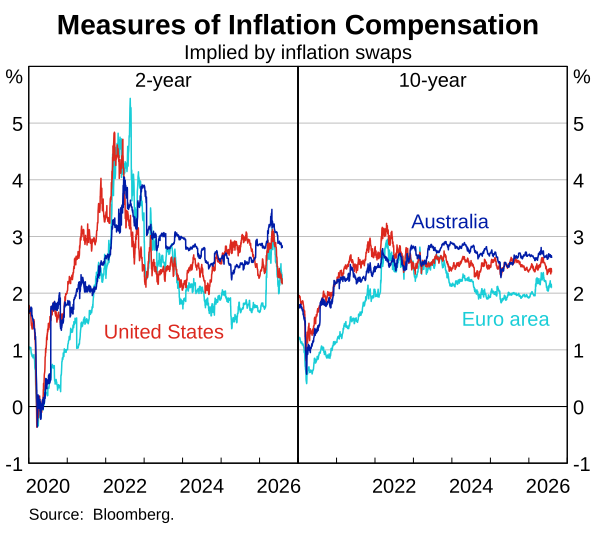
Since the previous Statement, government bond yields have increased in the United States and Japan but are slightly lower in Australia. In the United States, yields have risen by around 20 basis points driven by higher real yields, particularly at the shorter end. This reflected expectations for tighter monetary policy and lower inflation compensation. Longer term real yields have also increased, possibly reflecting fiscal concerns and expectations that strong AI-related investment will support growth and raise equilibrium real interest rates (Graph 1.4; Graph 1.5). The rise in nominal Japanese government bond yields has similarly reflected higher real yields, amid heightened concerns about fiscal sustainability. By contrast, government bond yields in Australia are slightly lower since the May Statement alongside a decline in the market path for the cash rate and lower inflation compensation at the shorter end. Shorter term measures of inflation compensation in most markets remain well below their peaks seen earlier in the year, driven by the decline in oil prices, while longer term measures remain well anchored.
1.2 Corporate funding markets
Global risk premia remain low, despite recent volatility in equity prices of AI-related companies.
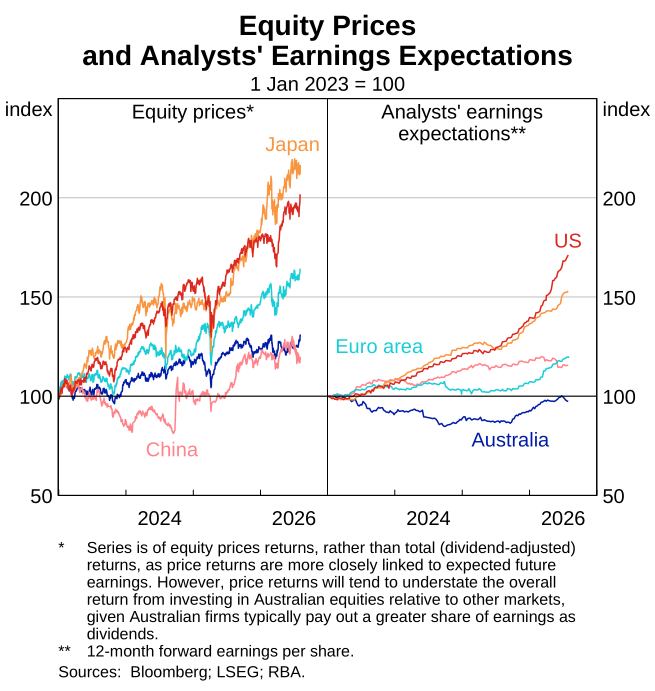
Global equity prices remain around or above their pre-conflict levels, supported by strong corporate earnings and expectations that the conflict will have limited effects on global economic activity (Graph 1.6). Gains in financial firms have buoyed non-AI equity indices in the United States and supported gains in European markets. Equity prices in Japan have also increased further over the period.
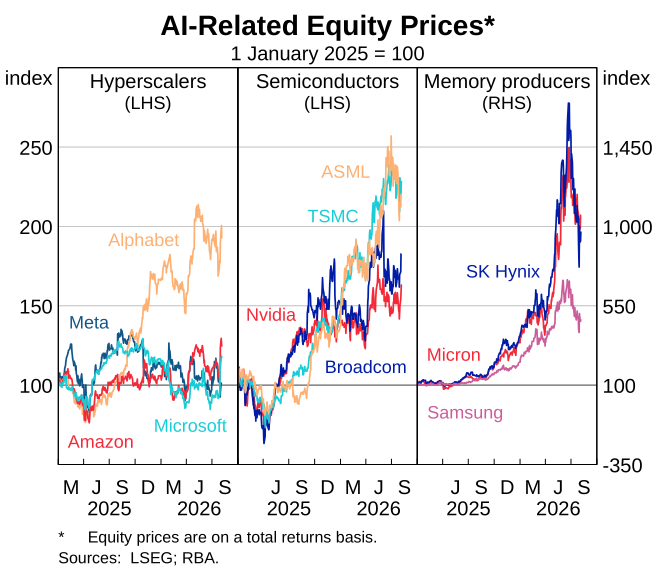
AI-related equities have become very volatile (Graph 1.7). In the United States, semiconductor firms and so-called hyperscalers (large cloud-computing companies investing heavily in AI infrastructure) have become sensitive to news about data centre investment plans, financing conditions and the outlook for earnings growth. Equity prices have been particularly volatile in South Korea and Taiwan, reflecting both the large weight of semiconductor and memory companies in those markets and their strong earlier gains. In South Korea, the volatility has been amplified by leveraged retail investors (which has since been curtailed by regulators), while Chinese technology-related equities have also fallen.
Australian equity prices have increased since the May Statement to be back around their pre-conflict levels, despite expected earnings having been revised down slightly. Easing concerns about the economic effects of the Middle East conflict and the slightly lower expected policy path have supported a recovery in consumer-facing equity prices over recent months. Australian banks’ share prices have also increased to be only a little below the highs reached earlier in the year, despite expectations of slower household credit growth (discussed below) and the announcement of additional loan provisions by some banks. The underperformance of Australian equities over recent years is consistent with subdued earnings expectations for Australian companies, in contrast to the significant upgrades seen in many other markets. More recently, some of this divergence has reflected the limited exposure of Australian companies to the global AI supply chain.
Risk premia in global bond and equity markets remain low. This suggests that investors expect the economic impact of the Middle East conflict to be limited and that they remain confident in the long-term returns from AI investment, despite the recent volatility in that sector. This is in line with the resilience in earnings forecasts to date. While some corporate bond spreads have widened slightly amid a substantial increase in issuance by AI-related firms, they have declined in aggregate and remain low overall. However, a more material reassessment of the economic viability of AI-related investment, or of the economic effects of the Middle East conflict, could lead to a broader weakening in risk sentiment that could spill over to Australian markets.
1.3 Foreign exchange markets
The Australian dollar has depreciated since the May Statement, reflecting lower yield differentials between Australia and other advanced economies and a decline in commodity prices. Even so, the exchange rate remains around 5 per cent higher than at the start of the year.
The Australian dollar TWI has depreciated 1.2 per cent since the May Statement, underpinned by a narrowing in yield differentials (Graph 1.8). Rising government bond yields internationally – particularly in the United States – and a decline in Australian monetary policy expectations have contributed to a narrowing of Australia’s interest rate differentials with other advanced economies. Together with declines in some commodity prices, such as iron ore, this has more than offset support for the Australian dollar from generally resilient risk sentiment in global markets. Despite the recent depreciation, the TWI is 5 per cent higher than it was at the start of the year. The nominal TWI remains broadly consistent with model estimates of its long-run equilibrium level.
The Japanese yen has been supported recently by coordinated intervention by the Japanese Ministry of Finance and the US Treasury. This follows several market interventions earlier in the year by Japanese officials. Intervention occurred to support the yen and counter ‘excessive volatility and disorderly movements in Japanese yen in recent months’. Market commentators have suggested that the US Treasury intervention reflects concerns that without US support, Japanese officials may have had to sell greater amounts of US Treasury securities to fund intervention. The US portion of the coordinated intervention was funded out of its official reserve assets, most likely through the sale of euros.
1.4 Australian banks and credit markets
Banks’ funding costs and lending rates have increased since the beginning of the year, in line with the standard transmission of monetary policy.
Banks’ funding costs have increased alongside the cash rate since the start of the year. Since the May Statement, major banks’ funding costs are estimated to have increased by 18 basis points as the higher cash rate has flowed through to deposit and wholesale debt rates (Graph 1.9). Spreads between bank bond yields and swap rates have remained close to their lowest levels since 2022. Bank bond issuance so far this year has been around its decade average (relative to GDP).
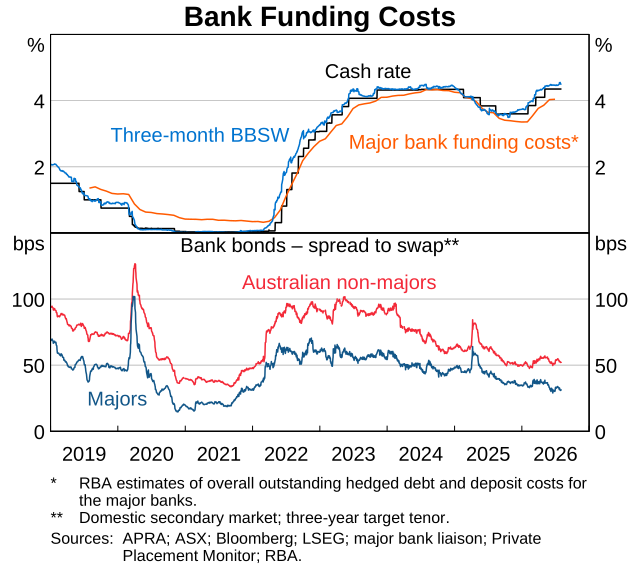
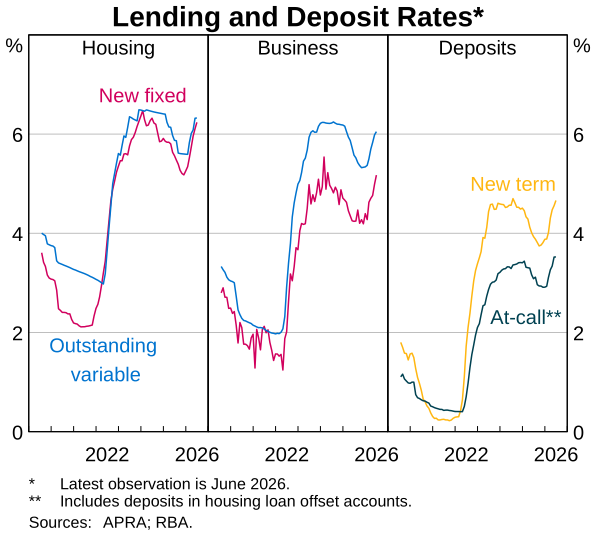
Lenders have passed on the recent cash rate increases to mortgage and business lending rates. Variable business rates have increased alongside increases in bank bill swap rates (BBSW) and the cash rate this year (Graph 1.10). Variable mortgage rates increased by nearly 75 basis points between January and June. Since June, some lenders have reduced advertised variable mortgage rates for select products, with cuts as large as 20–30 basis points for a few small lenders. These reductions are consistent with continued strong competition and could reflect efforts to maintain market share amid an expected slowdown in housing credit growth (see below). The extent to which these changes will affect aggregate paid mortgage rates remains unclear. Some lenders also reduced advertised fixed mortgage rates in June and July.
Previous cash rate increases have flowed through to higher scheduled mortgage payments.
Scheduled mortgage and consumer credit payments increased to just under 12 per cent of household disposable income in the June quarter, to be close to their 2024 peak (Graph 1.11). Cash rate increases can take around three months to flow through to scheduled mortgage payments because of minimum notice periods for higher repayments and differences in borrowers’ repayment cycles. Accordingly, scheduled mortgage payments are expected to rise a little further over coming months as the May cash rate increase continues to flow through.
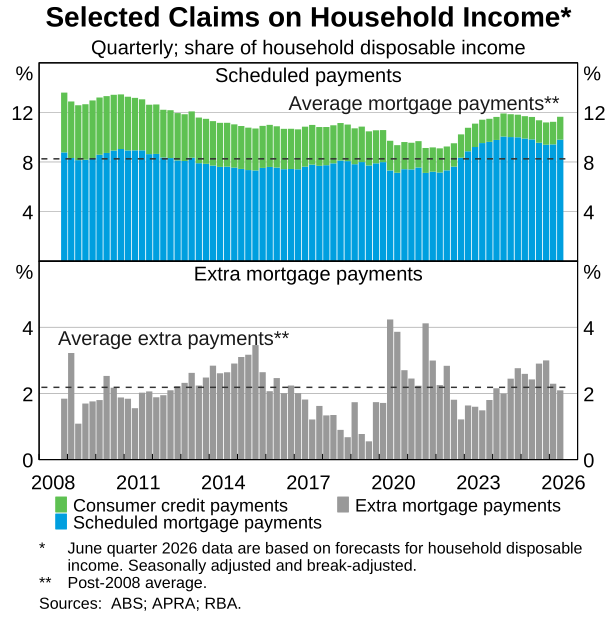
Extra mortgage payments into offset and redraw accounts declined a little to be around their long-run average in the June quarter. Flows into these accounts have been a bit weaker in 2026 compared with 2025. While higher rates have provided a stronger incentive to save, some households may have chosen to save less in these accounts (or even to draw down on balances) to support consumption and/or to meet increases in scheduled (minimum required) payments. Indeed, borrowers who left actual mortgage payments unchanged as the cash rate declined over 2025 would generally not have seen higher actual mortgage payments as interest rates increased over 2026 (as their actual payments were still at or above the minimum required). However, a larger share of these payments would have been absorbed by higher interest charges over 2026, mechanically contributing to weaker inflows into redraw accounts relative to 2025.
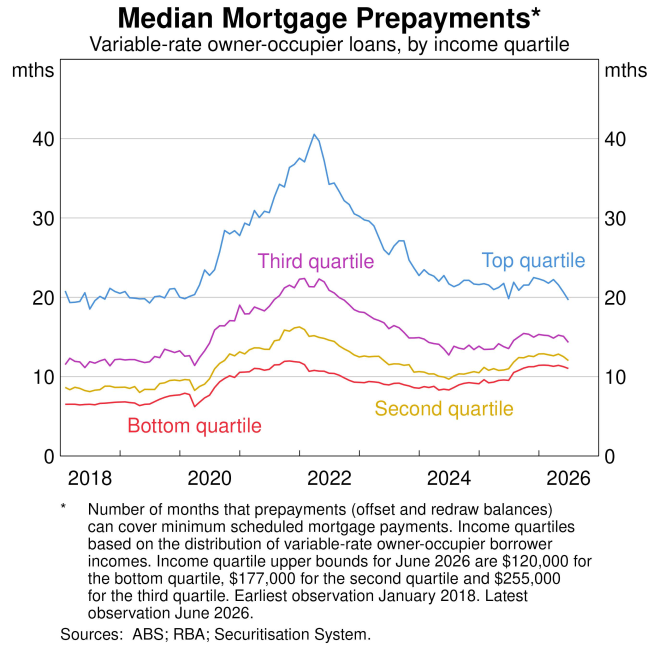
Even so, strong flows into mortgage offset and redraw accounts over recent years mean that many borrowers have sizeable buffers. For example, data to June suggest that a median borrower in even the lowest income quartile could meet almost one year’s worth of scheduled mortgage repayments by drawing on funds in offset and redraw accounts (Graph 1.12). This is up from nine months before the pandemic, despite minimum scheduled mortgage repayments for the median borrower in the lowest income quartile having increased by almost 50 per cent since then.
Total credit growth remained above average in June but is expected to weaken over coming months.
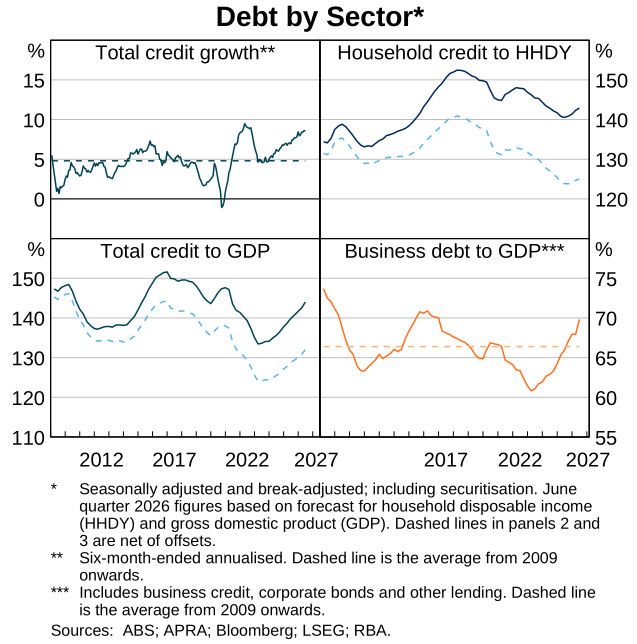
Total credit grew by 8.6 per cent in six-month-ended annualised terms in June, reflecting strength in lending to both the household and business sectors (Graph 1.13). Total credit growth has been relatively stable over the year to date but is expected to ease over coming months as declines in housing prices flow through to housing credit growth (which typically occurs with around a three-month lag). Household credit has continued to grow above its long-run average recently, and the ratio of household credit to disposable income has increased a little since mid-2025 after several years of declines. The ratio of business debt to GDP has risen significantly in recent years, and over the past year has increased to above its post-global financial crisis (GFC) average. Business debt growth has been supported by both favourable supply conditions – with ongoing strong competition between bank and non-bank lenders – and robust demand (see below).
Housing credit growth has eased and is expected to slow further in the period ahead.
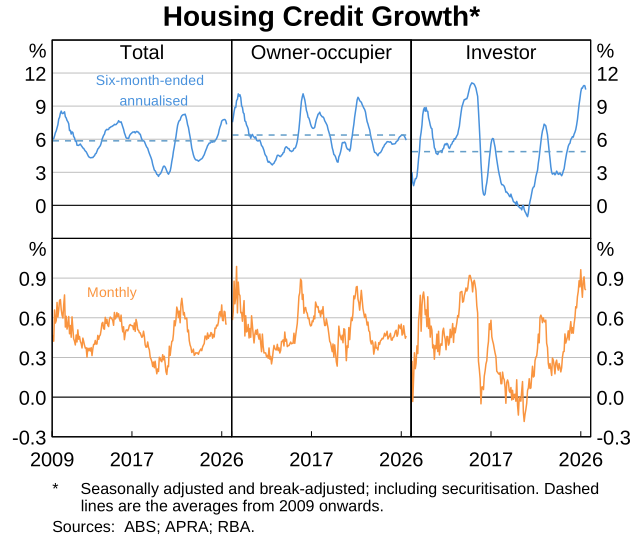
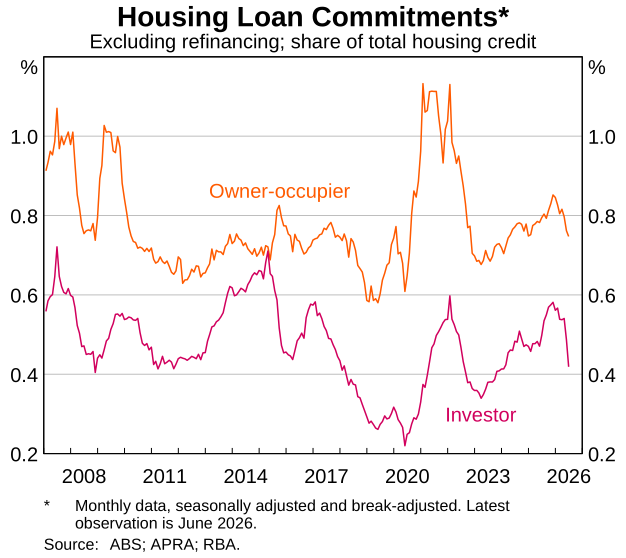
Housing credit growth remains above its post-GFC average but has eased by around 0.5 percentage points in six-month-ended annualised terms since the May Statement, reflecting modest declines in credit growth to both owner-occupiers and investors (Graph 1.14). There has been a sharp decline in new housing loan commitments over recent months, driven by investors (Graph 1.15). The decline in new housing commitments reflects the combined impact of the easing in established housing market conditions, increases in interest rates and recently announced tax changes for property investors (related to negative gearing and capital gains tax). This is expected to flow through to a further slowing in housing credit growth in the months ahead.
Growth in business debt remains strong and relatively broad-based across industries.
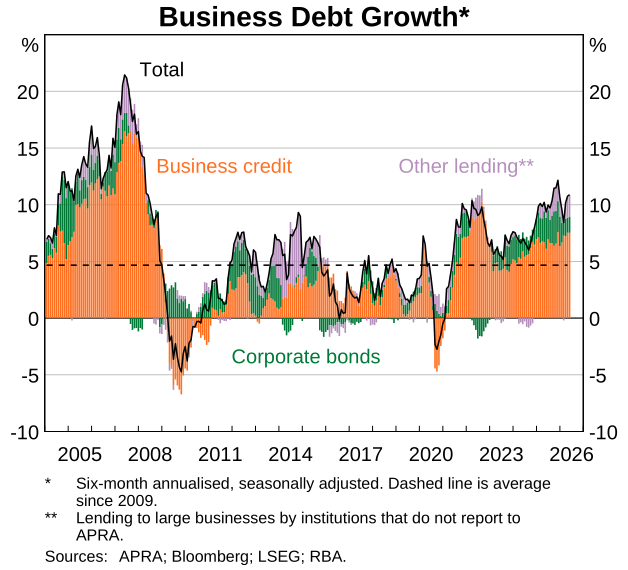
Business debt growth remains above its post-GFC average, but a little lower than its peak late last year (Graph 1.16). The strength in business debt growth has been broadly based across industries, with the industrials and real estate sectors contributing strongly to the recent growth. Growth in syndicated lending, which is a subset of business debt, has increased since the start of this year following a few large deals to build data centres and supporting infrastructure; syndicated lending has been an important source of debt funding for Australian companies establishing or operating data centres (see Chapter 3: Outlook for a discussion of data centre investment). Business credit growth remains close to its fastest pace since 2022, alongside strong competition in the business lending market. Corporate bond issuance has been steady, with year-to-date issuance from non-financial corporations around its decade average as a share of GDP.
Endnote
1 Since the May Statement staff have re-estimated the market-based neutral rate model. The central estimates from the market-based model shifted a bit lower as a result.