
Statement on Monetary Policy – August 2026 2. Economic Conditions
Summary
- Consumer price inflation in Australia remains elevated, reflecting both global cost pressures associated with the Middle East conflict and ongoing domestic capacity pressures. Historically weak productivity growth continues to constrain the capacity of the Australian economy to supply goods and services. Domestic demand growth looks to have moderated in the first half of the year, labour market conditions have eased a little and the housing market has softened. These developments are consistent with financial conditions being somewhat restrictive and the Middle East conflict having had a limited impact on overall domestic activity so far.
- The ongoing Middle East conflict has continued to disrupt energy production and shipping in the region, contributing to high global prices for oil, liquefied natural gas and other commodities. Global commodity prices have been volatile since May. The sharp increases in oil and some other commodity prices following the start of the conflict were largely unwound in June, after the United States and Iran signed a memorandum of understanding to cease hostilities and reopen the Strait of Hormuz, and as global supply chains adjusted. However, some prices increased again in July as the conflict re-escalated. Crude oil prices are currently below where they were at the time of the May Statement, although global inventories of oil and oil products are much lower than at the start of the conflict, suggesting upside risks to energy prices if supply disruptions continue.
- GDP growth in Australia’s major trading partners has been stronger than expected over the past year or so, and that has continued recently as the boost from AI-related investment has outweighed the negative effects of the Middle East conflict. Surging global demand for AI-enabling products has recently contributed to strong growth in investment in many economies and in exports in some of Australia’s Asian trading partners. In addition, trade policy developments since early 2025 have been less of a drag on growth than expected as trade flows have reoriented. However, significant uncertainty remains around both the resolution of the Middle East conflict and US trade policy. While GDP growth in China has slowed recently and growth in domestic demand remains subdued, the authorities have announced renewed support for infrastructure investment.
- Higher energy prices have driven increases in producer and consumer price inflation in many economies over recent months, with strong demand for AI-related goods adding to producer price inflation in some economies. However, the impact of upstream cost pressures on non-energy consumer prices has been limited so far; core measures of inflation remain broadly unchanged from prior to the conflict, though are above central banks’ targets in several advanced economies.
- In Australia, overall demand growth appears to have moderated, broadly as expected in May, and recent data support our May judgement that the impact on activity of the earlier spike in fuel prices will be relatively contained. GDP grew by 2.5 per cent over the year to the March quarter, in line with our May forecast. Recent data suggest that underlying momentum in household consumption is easing only gradually, as expected, despite consumer sentiment remaining very weak. Business investment increased very strongly in the March quarter, and by more than expected, driven by growth in data centre fit-outs (though much of this equipment is imported). More recently, surveyed business conditions have declined only modestly, and the ABS measure of investment intentions has been revised a little higher, even though business confidence remains low. By contrast, conditions in the established housing market have eased by more than anticipated and housing prices have declined by 1.6 per cent from their peak in March. This easing reflects the combined effect of cash rate increases, tax changes announced in the federal budget and the broader economic environment.
- Slower demand growth is helping to bring potential supply and demand back into balance, but we assess that some capacity pressures remain. Labour market conditions have eased by a little more than expected in recent months. The unemployment rate was 4.4 per cent in June; this is still below our estimate of the rate consistent with full employment, suggesting that labour market conditions remain a little tight. Leading indicators are consistent with labour market conditions being stable in the near term or easing gradually. Wages growth was steady in early 2026, as expected, while broader measures of labour costs were a little weaker than expected.
- Headline and underlying inflation remained well above target in the June quarter. Headline inflation eased slightly to 3.9 per cent, against expectations of an increase, as retail fuel and travel prices were softer than expected. Fuel prices faced by Australian households and businesses declined over May and June but increased again in recent weeks as oil prices rose and the temporary reduction in fuel excise ended. Trimmed mean inflation remained elevated in the June quarter, increasing to 3.6 per cent, though this was a little softer than expected. The strength in underlying inflation reflects both broad capacity pressures and the pass-through of cost increases related to the Middle East conflict. In May we judged that conflict-related costs would flow through to underlying inflation relatively quickly, owing to existing capacity pressures and elevated short-term inflation expectations. Recent data and liaison suggest that these higher input costs have contributed to price increases for new dwellings, but evidence of pass-through across the rest of the CPI basket is limited; overall they look to have contributed a little less to underlying inflation than was assumed in May.
- Short-term inflation expectations remain elevated, although most measures have eased back from the high level reached soon after the start of the Middle East conflict. Most long-term measures remain consistent with achieving the inflation target.
2.1 Commodity price developments related to the Middle East conflict
Global energy commodity prices have been volatile in recent months, reflecting developments in the Middle East that have affected exports of oil and liquefied natural gas (LNG) from the region.
Energy prices have been volatile in recent months and remain higher than their pre-conflict levels.
The price of Brent crude oil is currently around US$80 per barrel, lower than at the time of the May Statement but around 10 per cent above pre-conflict levels (Graph 2.1). Prices declined in June after the United States and Iran signed a memorandum of understanding that led to a partial recovery of shipping through the Strait of Hormuz, but have been volatile since then as the conflict re-escalated at times. Oil futures prices are currently broadly in line with the baseline assumption underpinning the May Statement forecasts (see Chapter 3: Outlook). Since the start of the conflict, inventories and strategic reserves of crude oil and oil products have been drawn down to partially offset the disruptions to Middle Eastern supplies. That has helped moderate some of the rise in oil prices but has also left the global economy with smaller buffers to withstand continued supply disruptions. Global oil demand also declined, particularly in China, where oil imports fell by around 40 per cent over the year to June, reflecting export restrictions and lower demand for transportation fuels, petrochemical feedstocks and stockpiling.
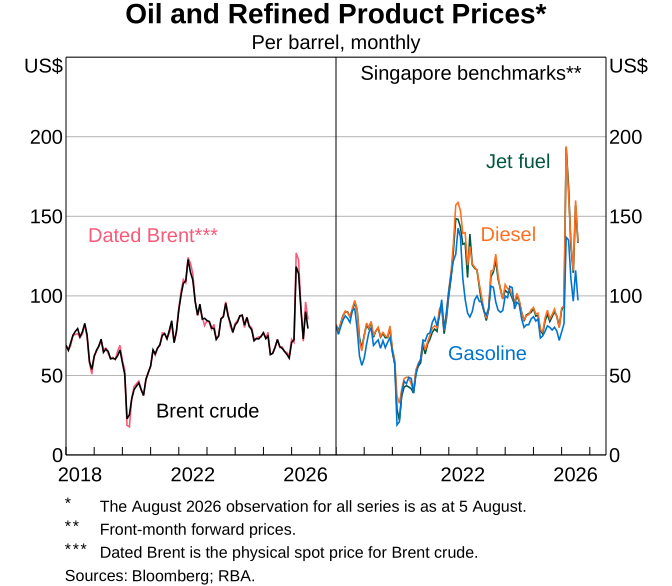
The prices of Asian refined oil products, which are the majority of Australia’s imports, have also declined since the May Statement, though by somewhat less than crude oil prices as global refinery output remains constrained. Since the May Statement, Singaporean price benchmarks have fallen by around 30 per cent for gasoline and around 15 per cent for diesel and jet fuel. Global refining activity has been constrained by damage to refineries in the Middle East and Russia, and reduced throughput in China in part due to export restrictions. Demand for fuel has also been resilient, particularly in the northern hemisphere, where fuel usage for driving and flying are highest during summer. Together, these factors have put upward pressure on fuel prices relative to crude oil prices and led to a drawdown in global refined product inventories. Continued drawdowns present an upside risk to fuel prices, especially if global inventories approach minimum operational levels (though estimates of these thresholds are highly uncertain).
Retail fuel prices in Australia eased in May and June but have increased in recent weeks. Petrol and diesel prices are above their pre-conflict levels (Graph 2.2). The declines in petrol and diesel prices in May and June were larger than previously assumed, reflecting lower-than-expected retail margins (for petrol) and wholesale margins (for diesel).1 The more recent increase in fuel prices in part reflects the rise in regional benchmark prices for refined fuel and in part the ending of the temporary reduction in fuel excise. However, the timing of this latter effect shifted slightly from what was assumed in the May forecasts, with the temporary cut partly unwinding in July and partly in August, rather than unwinding fully in July.
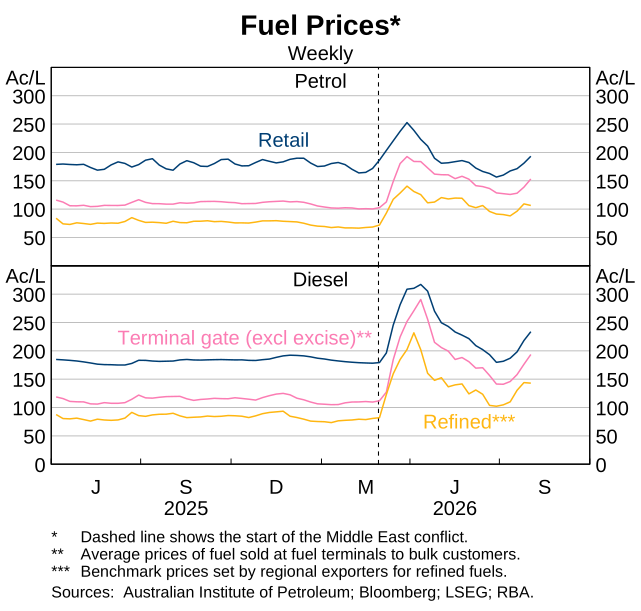
Domestic reserves for all fuel types are higher than in recent years, with around 39 days of consumption cover for diesel, 34 days for jet fuel, and 43 days for petrol. Reporting by the Australian Government indicates that fuel imports in August are expected to remain broadly similar to June and July. The $7.5 billion Fuel and Fertiliser Security Facility announced by the Government has supported fuel imports in recent months by providing financial support to importers.
Movements in the prices of other commodities affected by the conflict have been mixed since the May Statement, as expectations for a normalisation in trade grew, but actual trade flows remained below pre-conflict levels. For the short window while the Strait was reopened, exporters prioritised crude oil flows in order to release storage capacity and restart oil production; exports of refined products have been more limited and markets have remained tight. Asian LNG prices and European natural gas prices have risen by around 20 and 18 per cent respectively, on restocking demand in Europe ahead of winter and concerns over future supply availability. Thermal coal prices are little changed and remain above pre-conflict levels. Fertiliser prices have generally eased as concerns about shortages have abated, but the pass-through to agricultural commodity prices has been uneven with mixed price moves since the May Statement. Aluminium prices have also declined reflecting expectations that Middle Eastern supply will recover.
2.2 Global economic conditions
Economic growth in Australia’s major trading partners (MTPs) has been resilient recently as the ongoing boom in global AI-related investment has more than offset the negative impacts of the Middle East conflict. For some east Asian trading partners, surging global demand for AI-enabling products like semiconductors has contributed to stronger-than-expected growth in both GDP and traded goods prices. Growth in advanced economies more broadly has also been resilient over the past year despite disruptions to global energy supplies and trade policy developments. In China, growth weakened in the June quarter, as consumption and investment growth slowed and net exports contributed little.
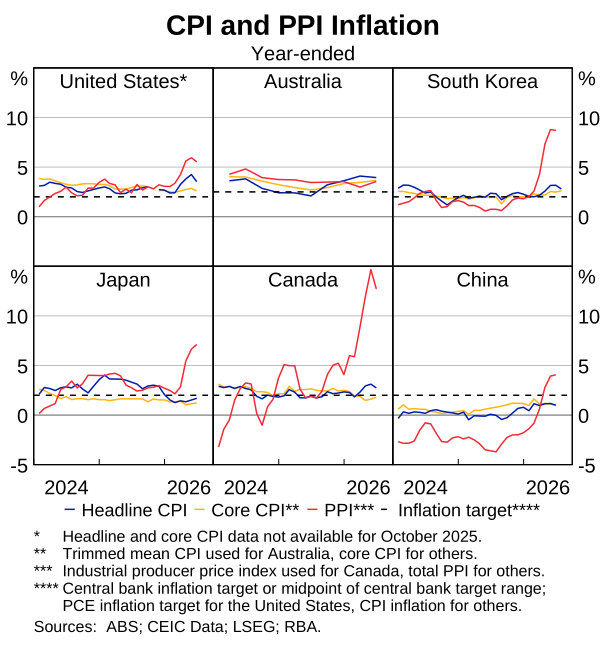
Producer price inflation has increased sharply in many economies, driven by higher energy prices and, in some cases, higher prices for AI-enabling inputs. Headline consumer price inflation has also increased due to higher fuel prices. Core consumer price inflation is generally little changed from before the conflict, but upstream price pressures, if sustained, are likely to pass through to non-energy consumer prices over time.
The global AI investment boom continues to drive stronger-than-expected economic growth in some of Australia’s Asian trading partners.
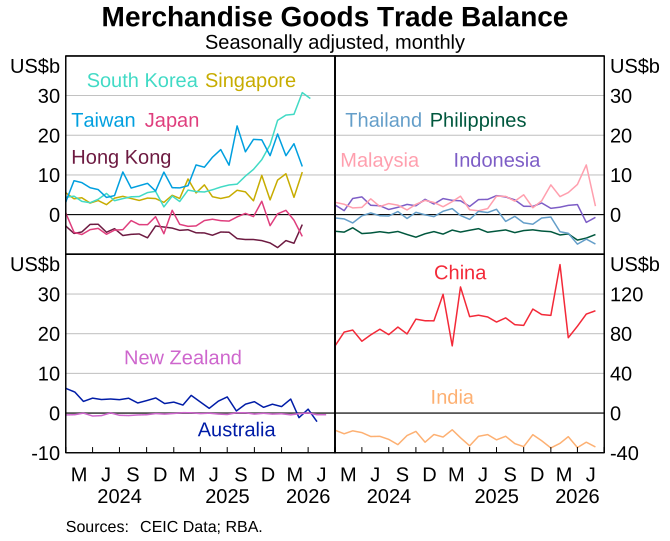
Surging global demand for AI-enabling products has driven booming exports for some Asian economies, more than offsetting the negative impacts of higher energy prices on GDP growth. Robust growth in global AI-related investment has supported industrial production and export growth in the March and June quarters in trading partners that are integrated into supply chains for computer servers and semiconductors (Graph 2.3). Export values have continued to grow strongly in recent months for economies like South Korea and Taiwan, although growth in export prices has been stronger than growth in volumes as capacity constraints bind in parts of these supply chains. Some manufacturers plan to expand their productive capacity through higher capital spending, while governments in Japan and South Korea have announced medium-term plans to increase public investment in both AI-related and other industries. By contrast, Asian trading partners less integrated into AI supply chains, such as Thailand, have experienced some deterioration in their goods trade balances and terms of trade since the start of the Middle East conflict due to higher energy import prices.
Economic activity has been resilient in advanced economies more broadly, despite the disruptions to global energy markets. Euro area GDP growth was stronger than expected in the June quarter; abstracting from volatility in Irish data, growth was broadly consistent with estimates of potential growth. Even though US GDP growth in the June quarter was a little weaker than expected and below estimates of potential, domestic final demand growth was much stronger, driven by household consumption and business investment, including data centre construction. US consumption growth has been resilient despite the increase in energy prices as households have smoothed through the decline in real incomes, supported by higher-than-usual tax refunds in April.
Recent weeks have seen another round of developments in US trade policy, but the direct implications of these changes are judged to be limited. The temporary 10 per cent global tariff rate implemented by the US administration in February lapsed on 24 July and the administration has implemented new tariffs for 60 of its trading partners, including China, the European Union and Australia. These changes leave the average effective tariff rate on exports to the United States broadly unchanged. The US administration announced it would not renew the United States–Mexico–Canada trade agreement (USMCA) for an additional 16-year term; it will instead be reviewed on an annual basis until 2036. The administration also announced a new 50 per cent tariff on a range of Canadian goods.
GDP growth in China slowed in the June quarter, with weakness in domestic demand persisting.
The Chinese economy grew by 0.9 per cent in the June quarter, slowing from the stronger-than-expected 1.3 per cent increase in the March quarter (Graph 2.4). Structural imbalances between strong domestic supply and weak domestic demand continued, with household consumption remaining subdued in the quarter, despite sustained income growth. Investment also slowed, alongside a reported temporary pullback in support from authorities for infrastructure investment and continued declines in real estate investment. Activity in the real estate sector has remained weak with continued declines also observed in sales and starts. The impact of the Middle East conflict on China’s economy has so far been mostly contained to higher producer prices, with limited evidence of broader effects on domestic activity – consistent with China’s relatively low dependence on oil and LNG, and large strategic reserves.
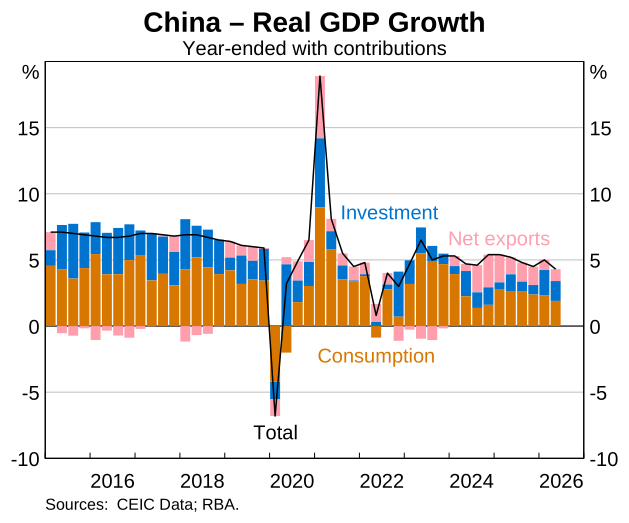
Authorities in China have indicated renewed support for infrastructure investment this year. The recent meeting of China’s Politburo in late July pledged continued policy support for the economy, with an emphasis on accelerating fiscal spending on already-announced infrastructure projects through the rest of the year. Authorities also announced plans earlier this year to invest around RMB7 trillion in the ‘Six Networks’ initiatives in 2026, as part of the 15th Five-Year Plan, with projects spanning water, energy, computing, communications, logistics and urban pipeline infrastructure.
The recent strong growth in Chinese trade paused in the June quarter, with both exports and imports estimated to have weakened and net trade making almost no contribution to GDP growth. Nevertheless, export volumes of some higher value-added goods, such as electric vehicles and ships, have increased considerably since the start of the year. Chinese imports of advanced AI-related goods have also grown strongly, including for use as intermediate inputs to production, as domestic production capacity is concentrated at the less advanced end of the supply chain.
Iron ore prices have declined by 15 per cent since the May Statement, alongside reported weakness in Chinese steel demand and increased seaborne supply. Recent weakness in activity and investment growth in China has weighed on steel demand. Low steel mill profitability has also encouraged production cuts and unseasonal stoppages for maintenance. Consistent with this, Chinese port inventories of iron ore rose in June and remain at historically high levels as supply has outpaced demand. Shipments from the Simandou iron ore project in Guinea – one of the world’s largest high-grade deposits – have also increased significantly faster than expected, contributing to the rise in seaborne supply alongside continued strength in supply from Australia and Brazil.
Higher prices for energy and, in some economies, AI-enabling inputs have pushed up producer prices globally – but pass-through to core consumer price inflation has been limited so far.
Higher energy prices have raised headline consumer and producer price inflation in most economies, although the effects have varied across countries, largely reflecting differences in policy responses (such as price controls, subsidies and tax cuts) and the domestic energy mix. Headline producer prices have generally responded more rapidly and by significantly more than consumer prices so far. While consumer and producer price inflation moderated in June in some economies – such as the United States and the United Kingdom – as fuel prices eased, inflation is likely to rise again given recent movements in oil prices.
Strong demand growth, particularly for AI-related goods, has also raised producer price inflation in some economies, although effects on consumer prices have been more limited to date. For some east Asian economies like South Korea, producer price inflation began to pick up before the Middle East conflict as bottlenecks emerged in AI-related supply chains. Surging demand for AI-enabling products has contributed to price increases for some consumer electronics and software but this has had limited impact on consumer price inflation in most economies so far. In China, producer price inflation remains around multi-year highs following the sharp increase in commodity prices, although the impact of higher energy prices has already begun to dissipate, with producer price inflation broadly stable in June.
Core consumer price inflation has been broadly stable since the start of the conflict in many economies, although it remains above levels consistent with central bank targets in several advanced economies (Graph 2.5). Sustained or renewed upstream cost pressures could contribute to a broadening of inflationary pressures to core goods and services prices over time. By contrast, Chinese consumer price inflation remains well below the official inflation target of 2 per cent as the structural imbalance between domestic demand and supply in China’s economy persists.
2.3 Domestic economic activity
The May Statement forecasts assumed that GDP growth would ease in early 2026, following above-trend growth in late 2025, as some of the factors supporting growth (including strong growth in income and wealth) waned. Households and businesses were, in aggregate, in a solid financial position and it was assumed that the observed weak outcomes for consumer and business sentiment would not weigh materially on economic outcomes. However, a sharper pullback in household spending and business investment, owing to weak sentiment, was judged to be a key risk to the outlook.
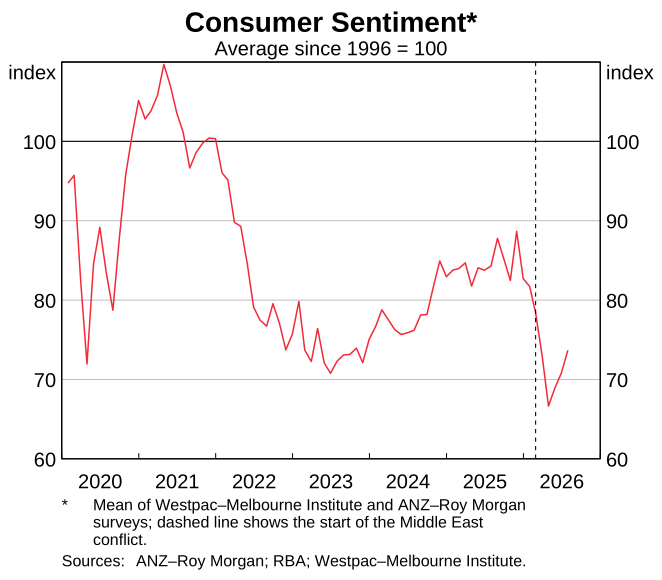
Recent data, while mixed, remain broadly consistent with the May forecasts. GDP growth in the March quarter, which largely reflected economic conditions prior to the Middle East conflict, was broadly as expected. More recently, household spending growth looks to have eased only modestly, as anticipated, despite consumer sentiment remaining very weak. The established housing market has slowed by more than expected. By contrast, business investment in the March quarter was stronger than anticipated and investment intentions, as measured by the ABS, were revised up despite weak business sentiment. Recent state and federal budgets have not materially altered our view of the outlook for public demand.
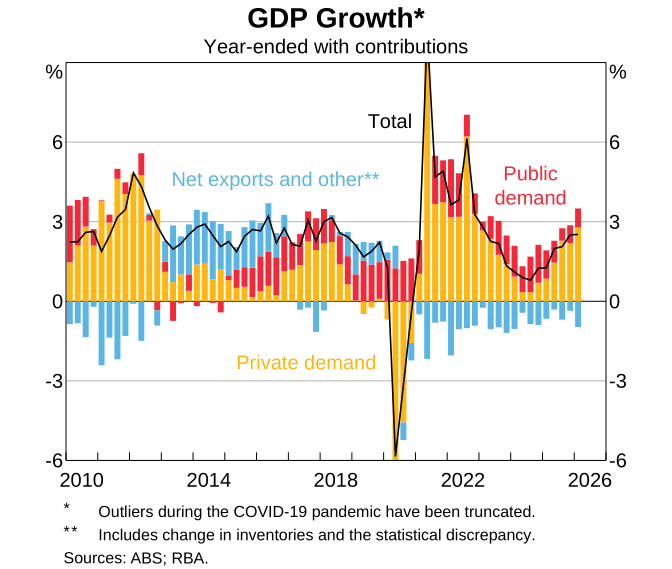
Year-ended GDP growth remained solid in the March quarter.
GDP increased by 0.3 per cent in the quarter to be 2.5 per cent higher over the year, broadly in line with our expectations in the May Statement. Private demand remained the main driver of growth over the year, underpinned by solid consumption and elevated levels of business investment (Graph 2.6). This reflected the earlier strong growth in household incomes and wealth, the easing in financial conditions internationally and domestically over much of 2025, and ongoing structural changes in the economy, including investment in data centres and renewable energy infrastructure. Given the usual lags in transmission, the easing in monetary policy in 2025 is likely to have supported activity in the March quarter, particularly for dwelling investment and consumption.
Household spending growth looks to have eased only modestly since the start of the year, as expected, despite very weak consumer sentiment.
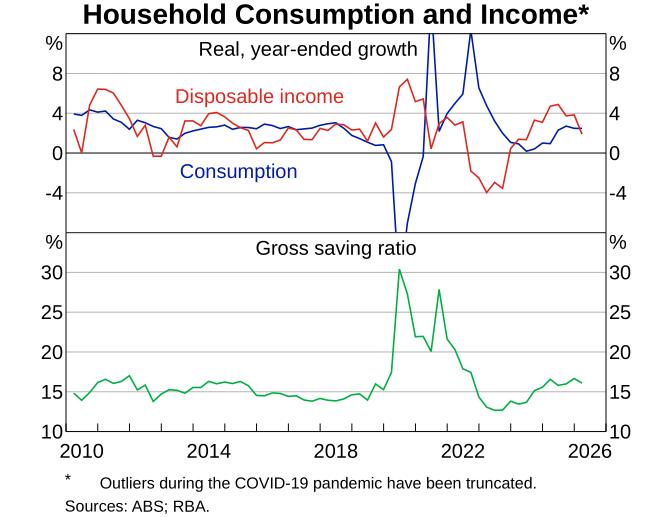
Recent data support the assessment in the May Statement that underlying momentum in household consumption had started to ease prior to the Middle East conflict. This is consistent with an easing in real household income growth since mid-2025, following an earlier period of strong growth. Consumption grew by 0.5 per cent in the March quarter to be 2.5 per cent higher over the year, as expected (Graph 2.7). The unwinding of electricity subsidies shifted spending from public consumption to household consumption and so contributed 0.3 percentage points to year-ended growth. Retail spending declined as expected following promotional activity in the December quarter, but we assess that this had only a modest effect on consumption growth.
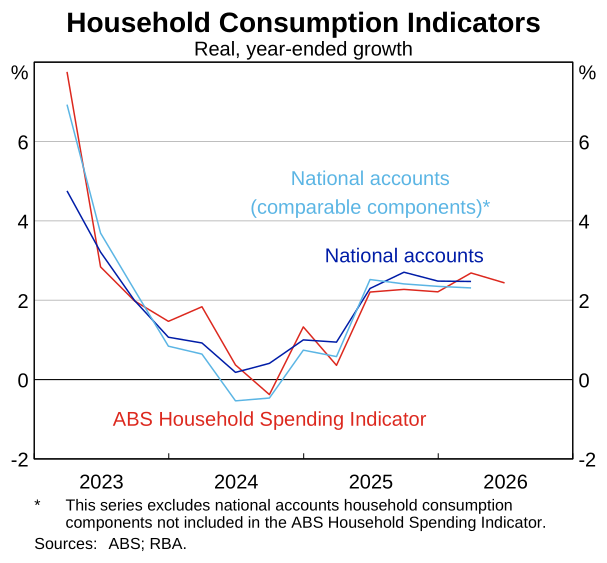
Liaison and other timely indicators point to household spending growth continuing to ease only modestly in the June quarter, broadly as expected (Graph 2.8). This is consistent with the fundamentals for households remaining solid; household incomes are expected to have continued growing (albeit at a slower pace) and balance sheets remain in good shape for most households. Spending indicators have been volatile month-to-month – particularly transport spending, which has been directly affected by price changes related to the Middle East conflict. Overall, domestic spending growth according to the ABS Household Spending Indicator was resilient in the June quarter, increasing by 0.7 per cent in real terms, supported by strength in discretionary spending (including electric vehicle purchases). This is broadly consistent with consumer-facing contacts in the liaison program continuing to report moderate spending growth, with conditions since March a little softer than earlier in the year. However, there was a notable decline in international travel in the June quarter, which likely weighed on Australians’ spending overseas and therefore household consumption.
Consumer sentiment has remained very weak in the past three months, though it has increased from its trough in April (Graph 2.9). The weakness in sentiment likely reflects a number of factors, including the Middle East conflict, recent cash rate increases, cost-of-living pressures and a softening housing market. However, past analysis has found limited evidence that consumer sentiment is an independent driver of household consumption (over and above fundamental drivers such as household income and wealth, which remain consistent with modest growth in consumption).
Business investment has grown strongly over the past year, particularly for data centres, and firms’ investment plans have generally been revised up despite weak business confidence.
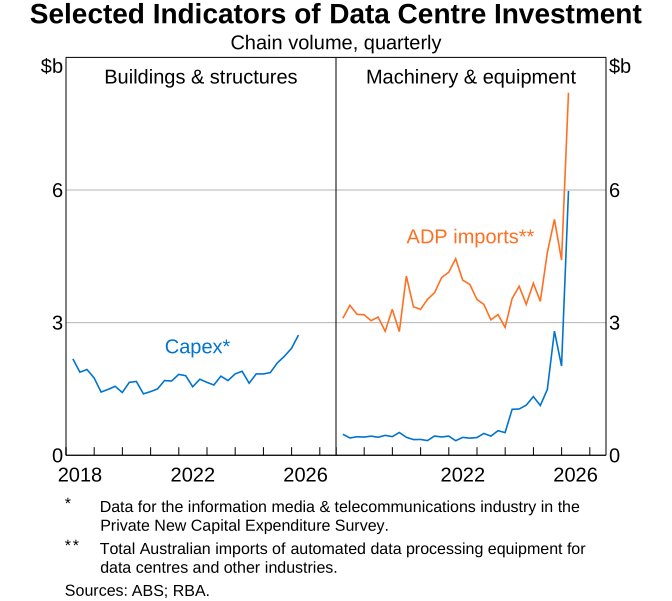
Business investment increased by 10.4 per cent over the year to the March quarter, a much stronger rate of growth than expected. Investment was 5.7 per cent higher in the quarter, relative to expectations for a small decline. This strength was driven most prominently by data centre fit-outs, continuing the very strong growth recorded since mid-2025 (Graph 2.10). Much of this spending was on imported machinery and equipment, which limited the boost to GDP.
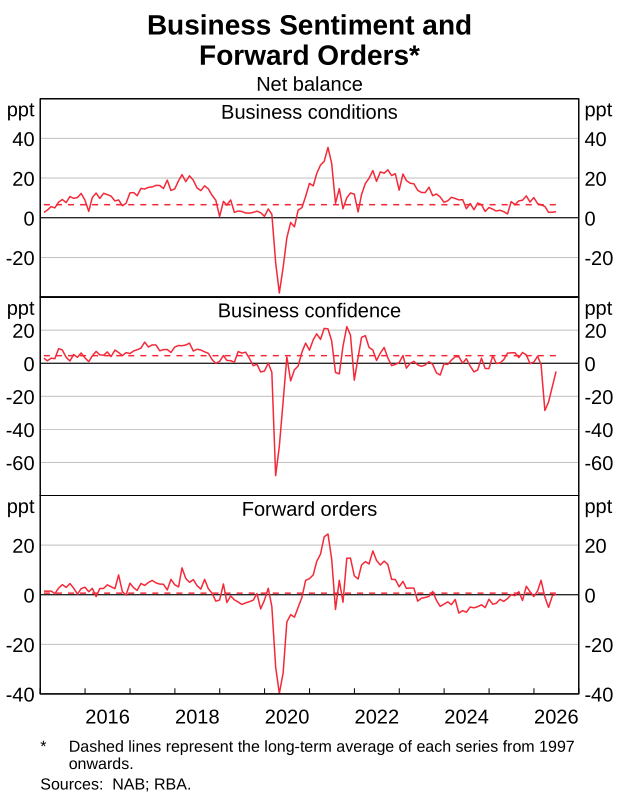
Surveyed business conditions have declined only modestly over recent months, and forward orders are currently around their average level (Graph 2.11). These measures tend to map more closely to activity than does business confidence (an indicator of forward-looking sentiment). Despite improving for the third consecutive month, business confidence remained negative in June; it is lowest in the transport industry, likely due to its exposure to uncertainty and higher input costs associated with the Middle East conflict.
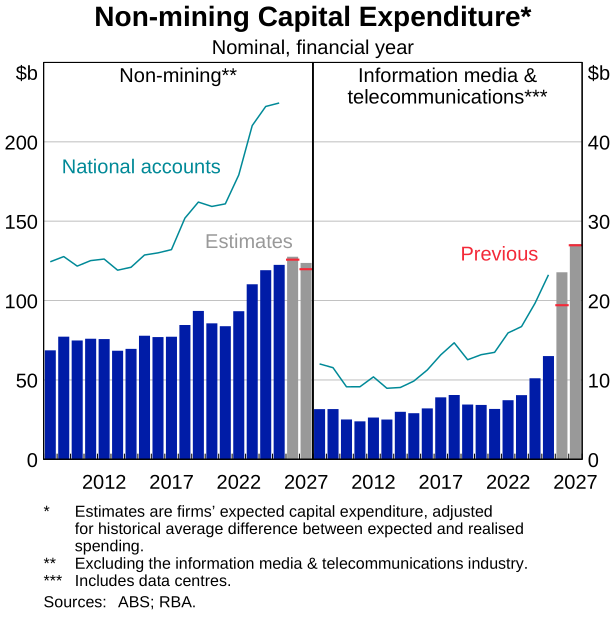
Despite low business confidence, nominal capital expenditure intentions suggest the level of business investment will remain high, supported by investment in data centres. Capital expenditure intentions for 2026/27 – surveyed by the ABS in April and May – point to continued near-term growth in nominal business investment. This is being driven by strong growth in capital expenditure intentions for data centres (Graph 2.12). The scale and spillovers from this investment are uncertain but are expected to support investment in electricity and water infrastructure, reflecting government expectations that developers contribute to the infrastructure needed to accommodate new capacity. The outlook for other industries’ capital expenditure intentions is more mixed, and there remains a risk that investment plans could be downgraded if uncertainty and weak business sentiment were to persist for some time.
Conditions in the established housing market have eased by more than expected.
Dwelling investment continued to grow as expected in the March quarter, to be 3.5 per cent higher over the year. Strong dwelling investment growth has contributed to rising capacity pressures in the construction sector since the second half of last year, after an easing over the preceding couple of years. Residential building approvals continued to increase in the March quarter, as there is typically a lag between increases in the cash rate and housing construction activity.
More timely data show that housing price growth and activity in the established housing market have eased by more than assumed in the May forecasts. Average housing prices have declined by 1.6 per cent from their peak in March (Graph 2.13). Sydney and Melbourne prices have declined by the most, though price declines have become increasingly broad-based. Auction clearance rates have continued to fall and are below their long-run averages, while measures of housing market sentiment have declined.
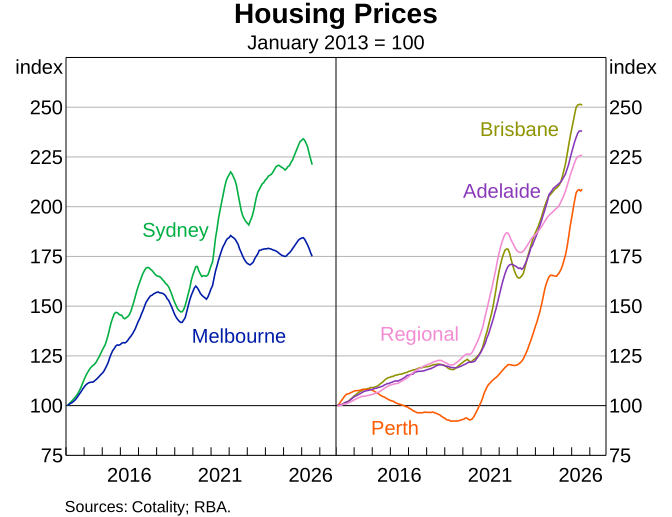
The easing in the housing market reflects a combination of the changed outlook for the cash rate in late 2025, actual cash rate increases in the first half of 2026, the broader economic environment and announced tax changes for property investors. The softening in sentiment and housing price growth started soon after policy rate expectations began to increase late last year, and momentum has slowed following increases in the cash rate. More recently, federal government policy changes have likely contributed to the easing in housing market sentiment, particularly among investors (see Chapter 1: Financial Conditions). Modelling from a range of external commentators suggests that the tax policy changes could reduce housing prices by 0–5 per cent in the long run. The recent easing in prices comes after a period of significant increases; housing prices are around 5 per cent higher than a year ago and are around 50 per cent higher since the start of the pandemic.
Recent budgets have not materially changed our view of the outlook for public demand and the fiscal stance.
Public demand was weaker than expected in the March quarter, growing by 0.1 per cent in the quarter and 2.5 per cent over the year. This reflected a decline in public consumption, which fell by 0.2 per cent in the quarter, driven by the end of the National Energy Bill Relief scheme and softer-than-expected spending on health-related programs (including Medicare, PBS and the NDIS). Public investment increased by 1.1 per cent in the quarter, broadly in line with expectations, reflecting continued strength in defence and state and local government investment.
All states and territories have released updated budgets since the May Statement, but these have not materially changed our view of the outlook for public demand (see Chapter 3: Outlook).
These budgets imply a smaller consolidated underlying budget deficit for 2025/26 than previously expected, but the outlook for the deficit beyond that is little changed. Estimates of the fiscal balance provide a broader indication than public demand of how fiscal policy may be affecting aggregate demand, as they incorporate a wider range of government spending as well as taxes and transfers. The smaller deficit for 2025/26 is primarily driven by higher federal government tax receipts as well as higher tax receipts and royalties for Queensland. Beyond the current financial year, upward revisions to projected receipts were broadly offset by higher projected spending, leaving the deficit little changed. The consolidated budget balance is projected to remain in deficit but narrow over the forecast period.
2.4 Labour market and wages
Labour market conditions have eased a little recently and the unemployment rate in the June quarter was higher than anticipated in May. Part of this easing appears to have been caused by subdued hiring in the early stages of the Middle East conflict, perhaps reflecting firms taking a ‘wait-and-see’ approach amid heightened uncertainty. Strong employment growth in June and a pick-up in employment intentions reported in the RBA’s liaison program suggest that some of this caution may have since unwound. Timely indicators of labour demand, such as vacancies and job advertisements, are consistent with labour market conditions being stable in the near term or easing only gradually. Taking all of these measures into account, we continue to assess that labour market conditions remain a little tight (see section 2.6: Assessment of spare capacity). Wages growth was stable in early 2026, though growth in broader measures of labour costs were weaker than expected.
Labour market conditions have eased by a little more than expected in recent months.
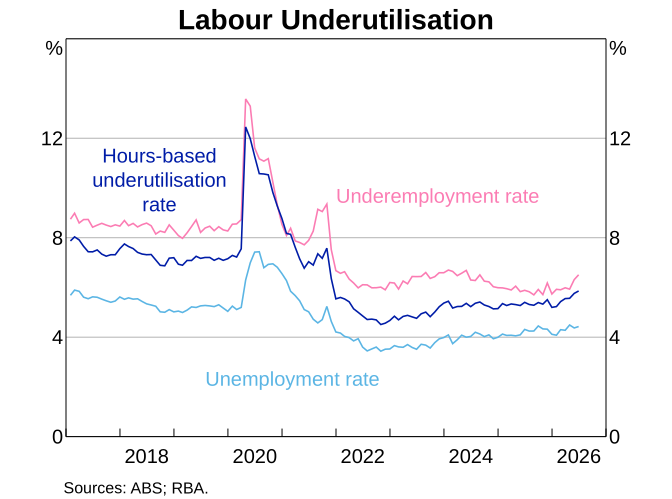
The unemployment rate was unchanged at 4.4 per cent between the months of May and June (Graph 2.14). For the June quarter as a whole, the unemployment rate averaged 4.4 per cent, above our May Statement forecast of 4.2 per cent. The underemployment rate increased to 6.5 per cent in June, reaching its highest level since August 2024, although it remains low by historical standards. The hours-based underutilisation rate – a broader measure of spare capacity – has also increased in recent months.2
The employment-to-population ratio declined over the quarter, while the participation rate was broadly unchanged (Graph 2.15). In the June quarter, the employment-to-population ratio was 63.8 per cent, weaker than we expected in May. This reflects broadly flat employment through April and May, when the outlook was particularly uncertain, followed by strong employment growth in the month of June. The participation rate remained at 66.8 per cent, which was in line with our expectations, although this was largely due to a strong pick-up in the month of June, which may partly reflect monthly volatility. The participation rate remains around historically high levels, supported by long-run trends such as higher female participation as well as ongoing cost-of-living pressures, possibly partly offset by the greater difficulty for the unemployed of finding a job over the past year.
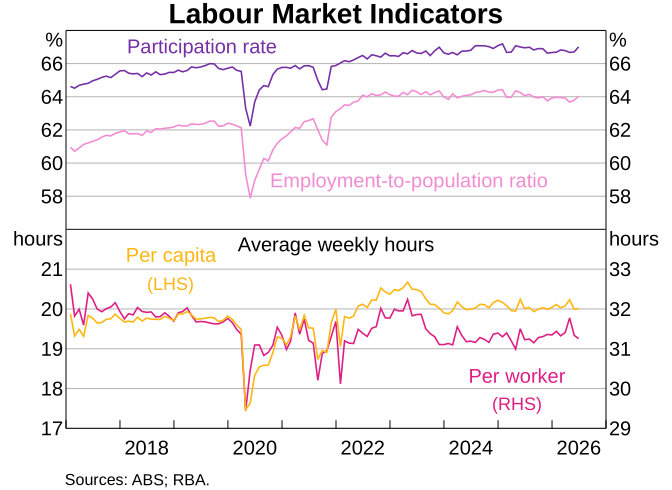
After rising sharply in April, average hours per worker and per capita have since declined, with both measures now around their levels at the beginning of the year (Graph 2.15). The increase in hours worked earlier in the year may have reflected workers increasing their labour supply in response to cost-of-living pressures and heightened uncertainty related to the Middle East conflict. It may have also reflected firms meeting demand by increasing hours for existing staff rather than hiring additional workers in the early stages of the conflict (with the subsequent decline due to a resumption of hiring, consistent with strong employment growth in June). Alternatively, these movements may reflect monthly volatility.
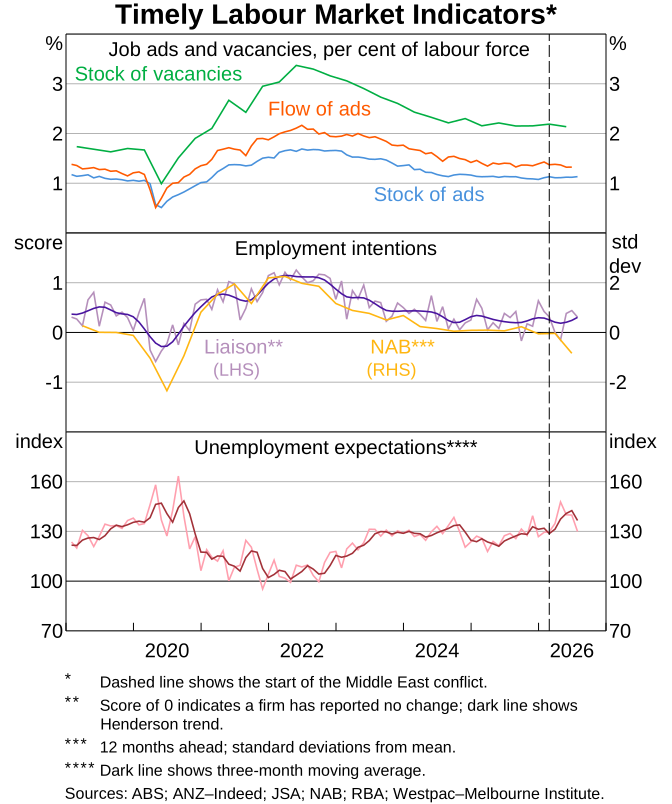
Leading indicators are consistent with labour market conditions being stable or easing only gradually in the near term. Job advertisements and vacancies have been broadly stable over recent months (Graph 2.16). While employment intentions from business surveys fell over the quarter, the measure from the RBA’s liaison program recovered after a slowing in April which some firms linked to uncertainty related to the Middle East conflict. Households’ unemployment expectations ticked down in May and June, unwinding the large uptick in April. Taken together, these data suggest that there may have been some ‘wait-and-see’ behaviour in firms’ hiring decisions that has since unwound.
Aggregate wages growth remained stable through to the March quarter 2026, as expected in May, although broader measures of labour income growth eased by more than expected.
The wage price index (WPI) increased by 3.3 per cent over the year to the March quarter, as expected in May. Private sector WPI growth remained steady at 0.8 per cent in the quarter and 3.2 per cent over the year, as expected. Wages growth for workers on individual arrangements – which tends to be most responsive to current labour market conditions – eased slightly to 2.9 per cent over the year. Public sector WPI growth slowed to 0.5 per cent in the quarter, and 3.3 per cent in year-ended terms, reflecting a smaller-than-average number of public sector wage increases in the quarter (Graph 2.17).
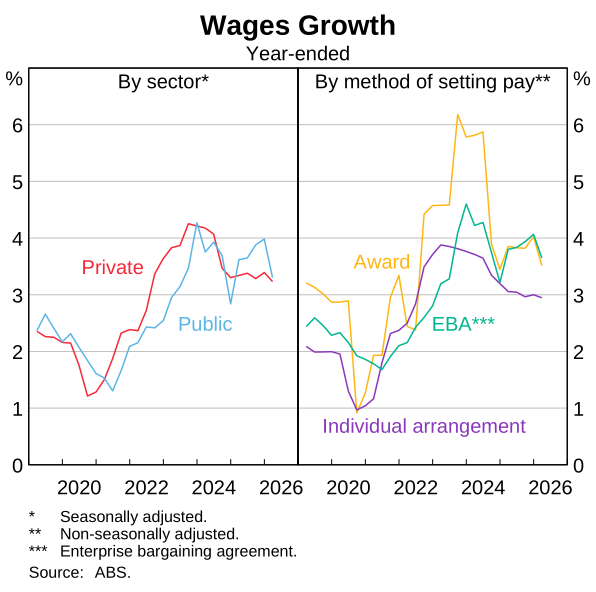
In its annual wage review, the Fair Work Commission (FWC) announced a 4.75 per cent increase to all modern award wages. This increase took effect from 1 July and directly affected the approximately 20 per cent of employees that are paid under a modern award, constituting about 10 per cent of the wage bill. A further 5 to 10 per cent of employees are estimated to be indirectly affected through agreements linked to the award rate. The increase to award wages was slightly higher than assumed in May. The annual wage review and other one-off administered decisions made by the FWC are together expected to contribute directly to a modest pick-up in wages growth over the year ahead (see Chapter 3: Outlook). Beyond this direct effect, some firms have reported in liaison that the FWC decision and recent elevated CPI outcomes have featured in bargaining discussions for workers that are not covered by awards.
Growth in the national accounts’ measure of average earnings (AENA) continued to ease in the March quarter. AENA growth was weaker than expected, easing to 3.4 per cent in year-ended terms, in part due to strength in total hours worked. AENA tends to be a more volatile measure of labour costs than WPI and so provides a noisier read on wage pressures arising from conditions in the labour market.
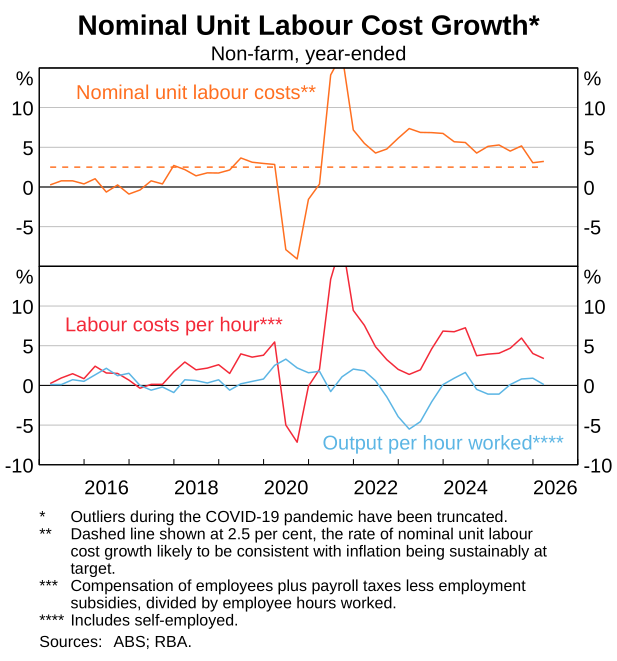
Growth in unit labour costs has fallen over the past year, notwithstanding a small increase in year-ended growth in the March quarter.
Unit labour costs (ULCs) grew by 3.3 per cent over the year to the March quarter, a little weaker than expected. Growth in ULCs has fallen over the past year, alongside the easing in average earnings growth. However, growth remains above the rate consistent with inflation being sustainably at the midpoint of the target band (Graph 2.18), consistent with still-tight labour market conditions, largely because of weak productivity outcomes (see next section).
2.5 Potential supply
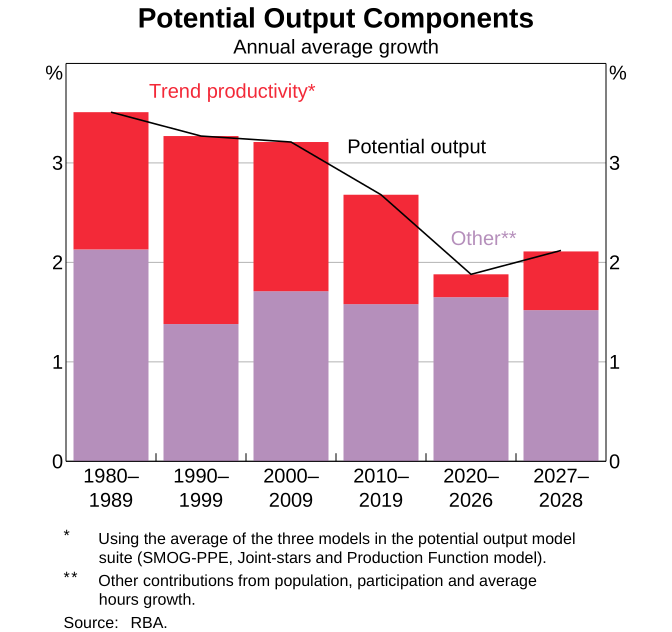
Potential supply growth has slowed in recent years, reflecting a prolonged period of weak labour productivity growth.
Productivity growth has been very weak in recent years, such that the level of labour productivity is slightly lower than it was prior to the pandemic. This pattern of weak productivity growth has continued recently. Non-farm labour productivity grew by just 0.1 per cent over the year to the March quarter, weaker than expected in May, and fell by 0.6 per cent in the quarter. Productivity in the market sector excluding agriculture grew by 0.2 per cent over the year to the March quarter, while productivity in the non-market sector was unchanged.
Slower productivity growth has contributed to a decline in potential output growth compared with previous decades. Our estimate of the medium-term trend rate of productivity growth remains at 0.7 per cent per year, which is lower than in the past.3 As a result, the growth rate of the economy’s potential supply (or potential output) – that is, its capacity to produce goods and services without generating inflationary pressures – is also lower than previously (Graph 2.19). This helps explain why there is evidence of capacity pressures in the economy despite the relatively subdued average rate of GDP growth (particularly on a per capita basis) over recent years.
2.6 Assessment of spare capacity
The slowing in demand growth recently is helping to bring overall demand closer to potential supply, though we assess that some capacity pressures remain in the labour market and broader economy. Consistent with slightly weaker-than-expected labour market conditions, we assess the output gap to be a little smaller than anticipated in May.
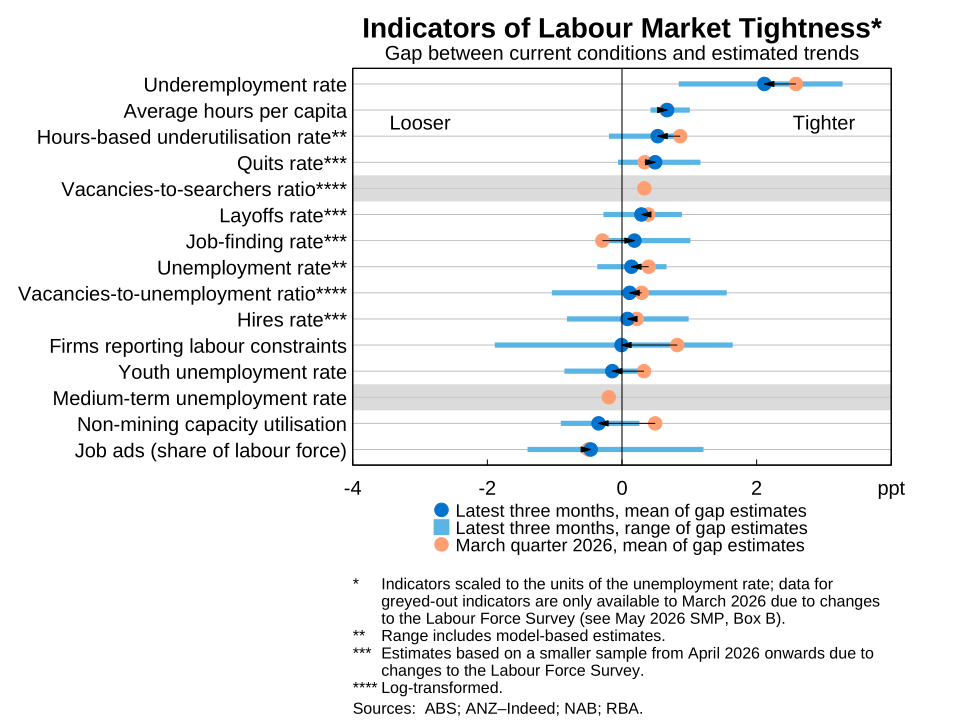
Labour market conditions are judged to remain a little tight, despite easing a little over recent months; there is, as usual, considerable uncertainty around this judgement.
A majority of the labour market indicators we monitor are close to or tighter than their estimated trend levels (Graph 2.20).4 The underemployment rate, average hours worked per capita and hours-based underutilisation rate in particular point to some tightness in the labour market. By contrast, job ads (as a share of the labour force) and non-mining capacity utilisation are below their estimated trends. A majority of indicators suggest some easing in conditions over recent months.
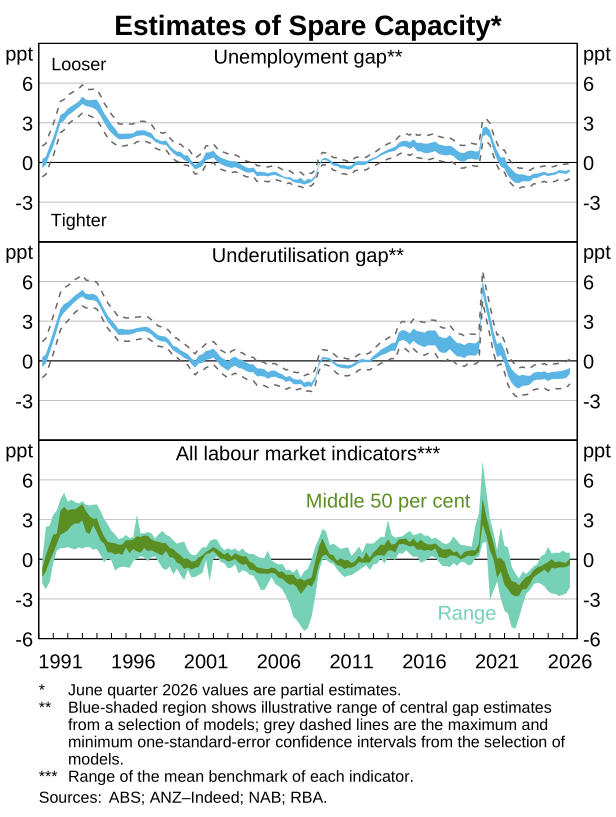
Model-based estimates of the non-accelerating inflation rate of unemployment (NAIRU) continue to point to a tighter labour market than suggested by our broader set of indicators. The unemployment and underutilisation gaps implied by the model-based estimates narrowed a little in the June quarter, although all models in the suite continue to suggest that labour market conditions are tighter than full employment (upper and middle panels in Graph 2.21). However, these estimates are uncertain, especially given the temporary cost shocks currently affecting inflation. The dark green range in the lower panel of Graph 2.21 summarises information from the broader suite of labour market indicators discussed above. These indicators also suggest that some capacity pressure remains in the labour market – though to a lesser extent than suggested by the model-based estimates. The implications of uncertainty around our assessment of spare capacity are discussed further in Chapter 3: Outlook.
We continue to assess that there are some economy-wide capacity pressures, though the output gap is now estimated to be a little smaller than we thought in May.
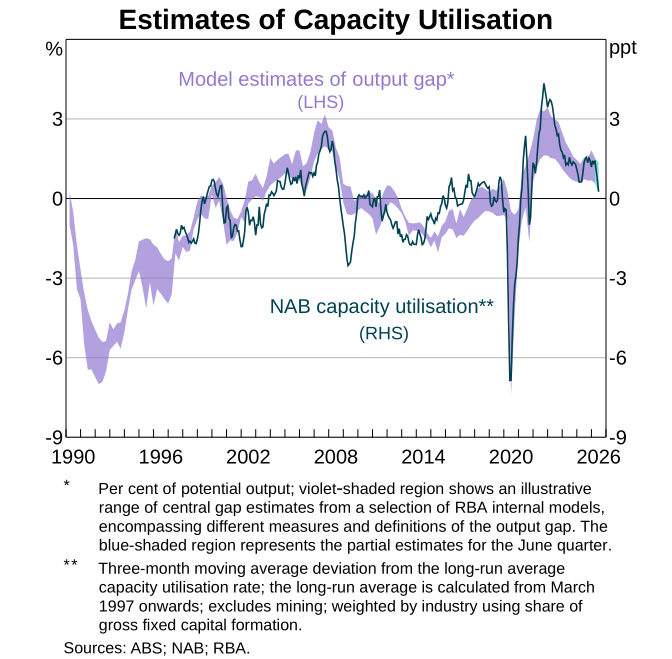
Indicators of broader capacity utilisation suggest that capacity pressures have eased recently, although signals across sectors are mixed. The NAB measure of capacity utilisation has declined to around its long-run average (and below some estimates of its trend level). By contrast, residential vacancies data show that utilisation of the housing stock remains elevated, consistent with ongoing strength in advertised rents growth, despite some easing in recent quarters. Retail vacancy data suggest that utilisation of retail property has continued to increase. Information from liaison suggests conditions are also mixed across states – for example, in construction, contacts suggest capacity constraints are binding in Queensland and Western Australia more than in New South Wales and Victoria.
Taking survey evidence together with model-based estimates of the output gap, we assess that the output gap remained positive in the first half of the year, though the economy moved closer to balance over this period (Graph 2.22). Our current estimate of the output gap for the March and June quarters is slightly smaller than estimated in May, consistent with labour market conditions being a little weaker than expected. There is, however, significant uncertainty around estimates of the degree of capacity pressures (see Chapter 3: Outlook).
2.7 Inflation
Headline inflation in the June quarter remained well above target, albeit materially lower than expected in the May Statement because of softer-than-expected fuel and travel price inflation. Underlying inflation also remained elevated, though slightly below our May forecast. The elevated rate of underlying inflation reflects capacity pressures in the economy and labour market, along with the effects of higher input costs due to the Middle East conflict. Consistent with our May forecast, inflation remained high in components closely linked to domestic capacity pressures, such as market services and new dwellings.
Headline inflation in the June quarter was materially weaker than expected in the May Statement.
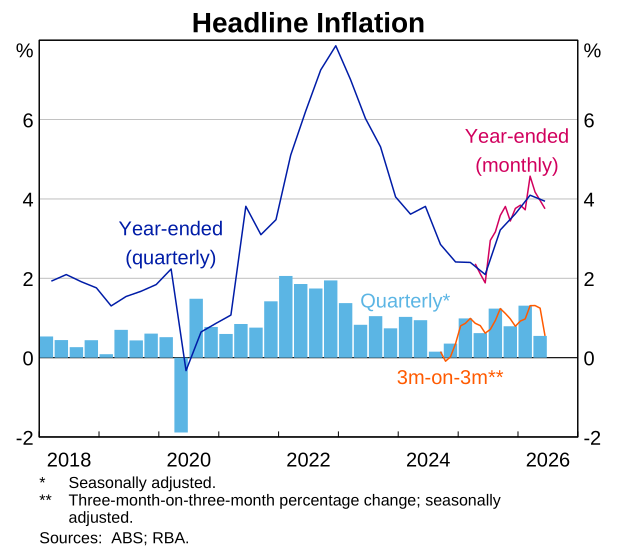
Headline inflation was 3.9 per cent over the year to the June quarter, having eased slightly from the March quarter (Graph 2.23), and 3.8 per cent over the year to the month of June. The June quarter outcome was substantially lower than the 4.8 per cent expected in the May Statement. This primarily reflected weaker-than-expected outcomes for automotive fuel and travel prices. Over the June quarter, retail prices for automotive fuel declined much more quickly and to lower levels than expected at the time of the May Statement, reflecting both global developments and lower retail margins for petrol (see section 2.1: Commodity price developments related to the Middle East conflict); however, fuel prices picked up again over July. Inflation for domestic and overseas travel was also lower than expected in the June quarter, with the effect of higher jet fuel costs on travel prices being more muted than anticipated.
Underlying inflation remained elevated in the June quarter, but was a little lower than expected in the May Statement.
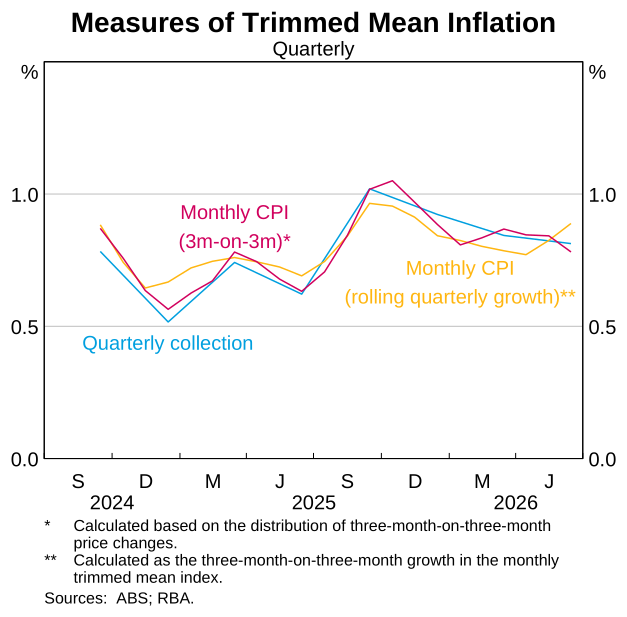
The quarterly rate of trimmed mean inflation was 0.8 per cent in the June quarter, the same as in the March quarter. In the June quarter, trimmed mean inflation increased to 3.6 per cent on a year-ended basis, up from 3.5 per cent in the March quarter but slightly below our May forecast. Various measures of underlying inflation from the monthly CPI show a similar pattern and have been broadly steady since earlier in the year (Graph 2.24). The softer-than-expected fuel and travel price outcomes in the June quarter contributed to trimmed mean inflation being a little lower than expected.5
Elevated underlying inflation reflects a combination of capacity pressures in the domestic economy and, in some sectors, cost pressures related to the Middle East conflict. Based on the CPI data received to date, we judge that conflict-related cost effects (excluding the direct effect of retail fuel prices) contributed a bit more than 0.1 percentage points to trimmed mean inflation in the June quarter. This was a little less than we expected in May, although this estimate is uncertain. Pass-through of conflict-related costs was evident in new dwelling costs and, to a lesser extent, groceries prices (see below). Capacity pressures in the economy and labour market are also judged to have contributed to the high rate of underlying inflation in the quarter, as expected.
The Middle East conflict is raising firms’ input costs, though pass-through to consumer prices has been limited so far.
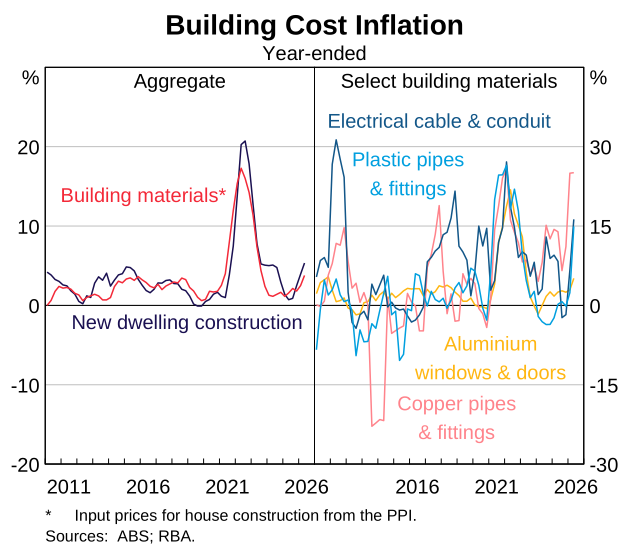
The conflict in the Middle East has contributed to upward pressure on non-labour costs for firms. The cost of several types of building materials increased sharply in the June quarter (see below) and import price data indicate sharp rises in the cost of some fertilisers, such as urea. Other cost increases have affected a broader range of firms. Most notably, the cost of transporting goods around the country by road increased by over 15 per cent in the June quarter (Graph 2.25).
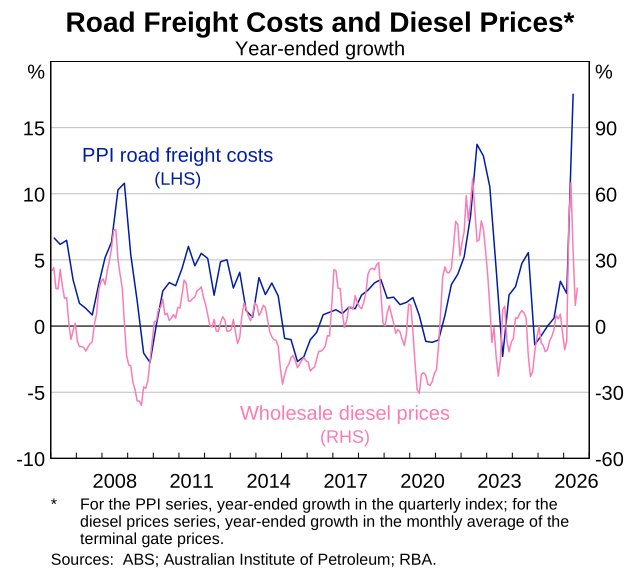
These cost pressures are judged to have contributed to higher prices for some items in the June quarter, although these effects were a little smaller and less broad than expected in May. The increase in building materials costs is likely to have supported new dwellings inflation in the June quarter, and the increase in fertiliser costs is also judged to have contributed to price increases in some groceries (see below). Outside of these items, however, the effects on consumer prices across the CPI basket to date appear to have been limited, and a little smaller than we expected. For example, on average, consumer prices for items with a higher share of oil-derived input costs (e.g. fuel and fertiliser) did not tend to increase by more than would be expected given other determinants, such as the degree of tightness in the labour market and pre-conflict developments in import prices. Liaison information suggests that, while many homebuilders have passed on at least part of the construction materials cost increases, pass-through of above-average costs has been mixed in other sectors, with many consumer-facing firms closely monitoring demand conditions when making pricing decisions (see Box A: Insights from Liaison). Similarly, the ABS Business Conditions survey indicates that a large share of firms had absorbed fuel cost increases in May and June. We expect conflict-related costs to pass through supply chains to consumer prices until around early 2027 (see Chapter 3: Outlook).
Inflation remained elevated across most sectors, picking up for new dwellings and easing a little for rents.
New dwelling construction prices increased by 1.8 per cent in the June quarter and were 5.3 per cent higher in year-ended terms (Graph 2.26). This was stronger than expected in the May Statement, and we judge that this reflects larger conflict-related cost effects than we had anticipated. Liaison information suggests that homebuilders faced cost pressures for some construction materials, particularly oil-derived products. The data received to date suggest that part of these upstream cost pressures were passed on to consumer prices. Strong new dwelling price inflation came against the backdrop of an easing in price growth and activity in the established housing market over recent months (see section 2.3: Domestic economic activity). However, new dwelling costs tend to lag conditions in the established housing market, so it is likely too soon for the easing in housing market conditions that began late last year to have affected new dwellings inflation.
CPI rent inflation eased slightly to 0.6 per cent in the June quarter and 3.6 per cent in year-ended terms, which was weaker than expected in May (Graph 2.27). Although strong advertised rental growth and low rental vacancy rates continue to point to tightness, we have seen limited upwards pressure on CPI rent inflation. It is possible that flow-through of rental market tightness to the stock of CPI rents may be more muted or occur more slowly than we had previously expected.
Market services inflation continued to be elevated in the June quarter at 1.0 per cent (Graph 2.27). Inflation in year-ended terms picked up to 3.9 per cent from 3.5 per cent. We assess that this largely reflects ongoing capacity pressures and, to a lesser extent, the cost effects from the conflict. The prices of these services are typically among the most sensitive to domestic conditions, and stronger inflation for market services since mid-2025 is consistent with capacity pressures in the economy and labour market. Liaison contacts in the hospitality sector reported an increase in costs in April, with many upstream firms raising or passing on fuel surcharges. CPI data received through June suggest that some firms may have passed on part of these costs to consumer prices.
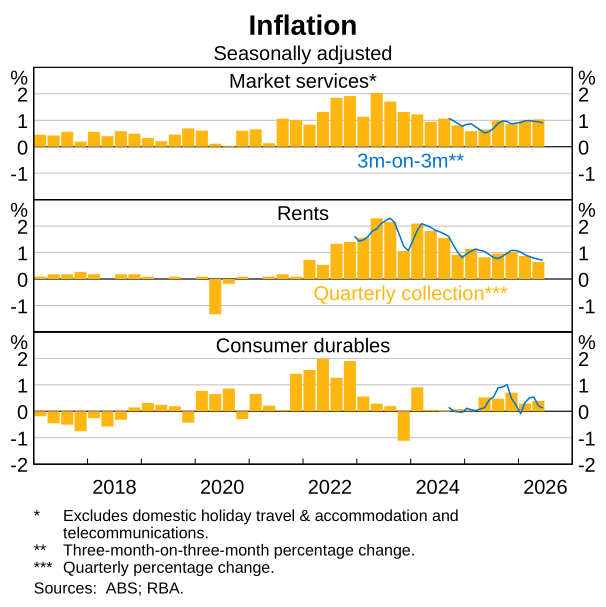
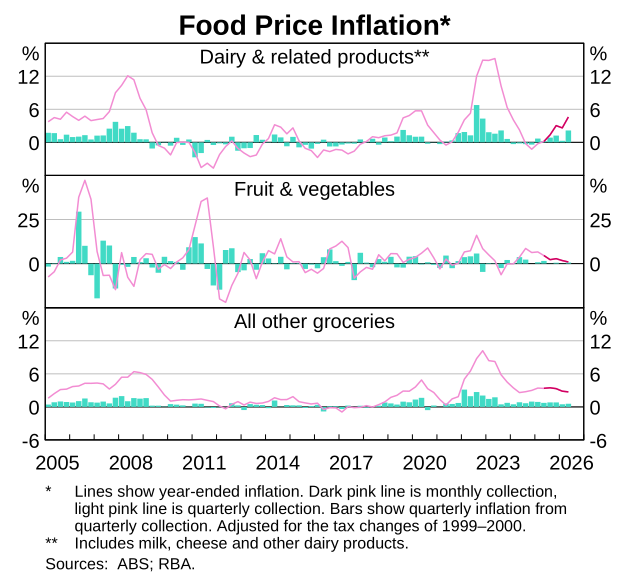
Retail goods inflation was slightly weaker than expected in the June quarter. Prices for groceries (including fruit and vegetables) increased, but by less than we had anticipated. Prices for some dairy items, such as milk and cheese, increased sharply, at least partly reflecting increases in costs owing to the Middle East conflict (Graph 2.28). Consumer durables inflation was broadly as expected at 0.4 per cent in the June quarter and 1.9 per cent in year-ended terms.
Inflation for goods and services with administered prices (excluding utilities) remained high in the June quarter, at 4.2 per cent in year-ended terms. Medical and hospital services inflation rose owing to the annual increase in health insurance premiums in April, which was the largest since 2017. Prices for public transport fell sharply as the Victorian and Tasmanian governments introduced free public transport in April; this more than offset increases in rideshare prices from higher fuel costs. Utilities prices inflation remained elevated at 15.2 per cent over the year to the June quarter, reflecting the expiry of energy bill rebates.
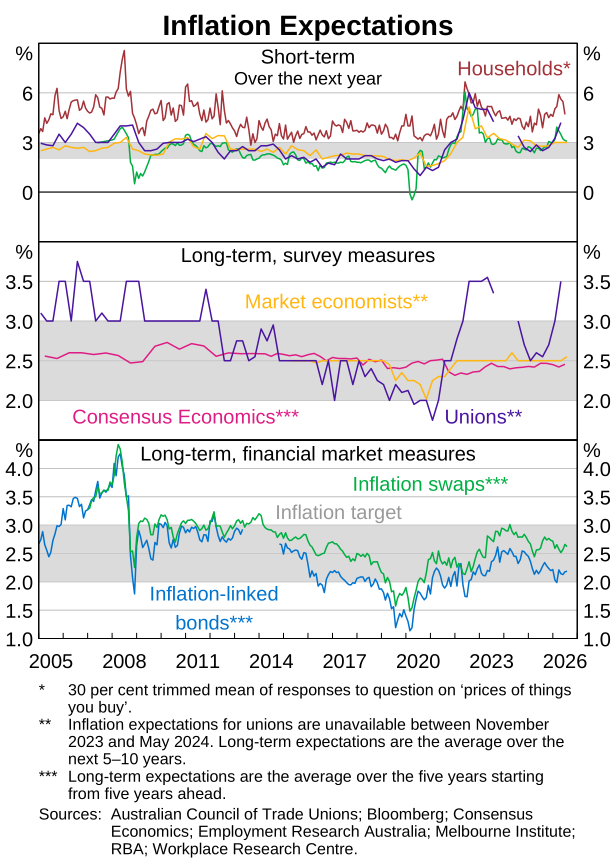
Short-term inflation expectations remain elevated, while most long-term measures remain consistent with achieving the inflation target.
Households’ short-term inflation expectations remain above their long-run average but have eased to levels observed at the beginning of the year. The earlier run-up in short-term inflation expectations coincided with the start of the Middle East conflict and increase in fuel prices. The more recent easing in expectations coincided with the decline in fuel prices over May and June, although fuel prices have subsequently increased again. Similarly, financial market measures of near-term expectations remain elevated but have eased recently (see Chapter 1: Financial Conditions).
Elevated inflation expectations can contribute to higher realised inflation, as households and firms take expected inflation into account when making decisions about wages, prices and spending. While most measures of longer term expectations remain consistent with the inflation target, the pace at which short-term inflation expectations ease from their current elevated levels is a key risk to the outlook for wages growth and inflation (Graph 2.29) (see Chapter 3: Outlook).
Endnotes
1 Retail margins are the difference between retail and wholesale (or terminal gate) prices; wholesale margins are the difference between the wholesale price, excluding the fuel excise, and regional benchmark prices for refined fuel. Lower-than-expected wholesale margins for diesel may partly reflect a faster-than-expected normalisation in wholesalers’ freight costs, which rose sharply following the onset of the conflict.
2 As a result of changes to the Labour Force Survey (see RBA (2026), ‘Box B: Changes to the Labour Force Survey’, Statement on Monetary Policy, May), estimates for hours-based underutilisation from April 2026 onwards have been constructed using preliminary ABS underemployment and underutilisation (‘u-series’) data.
3 See RBA (2025), ‘Chapter 4: In Depth – Drivers and Implications of Lower Productivity Growth’, Statement on Monetary Policy, August.
4 Some labour market indicators have been affected by changes to the Labour Force Survey from April 2026 onwards. See RBA (2026), ‘Box B: Changes to the Labour Force Survey’, Statement on Monetary Policy, May.
5 When inflation for a good or service is lower than expected and it is excluded from the items used to calculate the trimmed mean, it can nevertheless reduce trimmed mean inflation by bringing lower-inflation items than otherwise into the set of observations used to calculate the trimmed mean.