RDP 2022-07: The Term Funding Facility: Has It Encouraged Business Lending? Appendix B: Coefficient Figures
December 2022
- Download the Paper 2.1MB
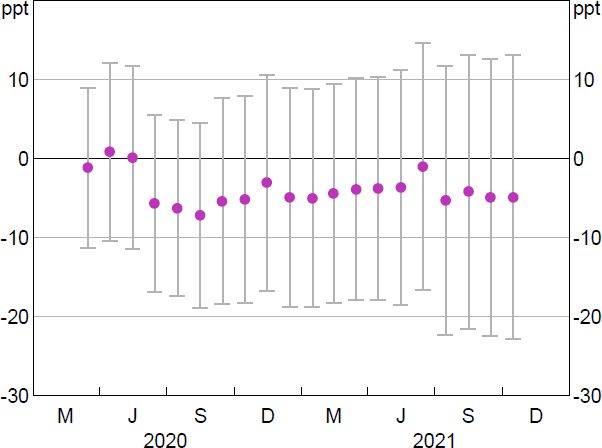
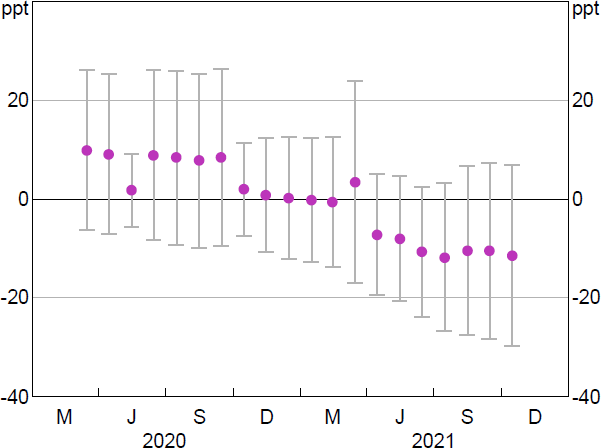
Note: Whiskers show 95 per cent confidence intervals.
Sources: APRA; Authors' calculations; RBA
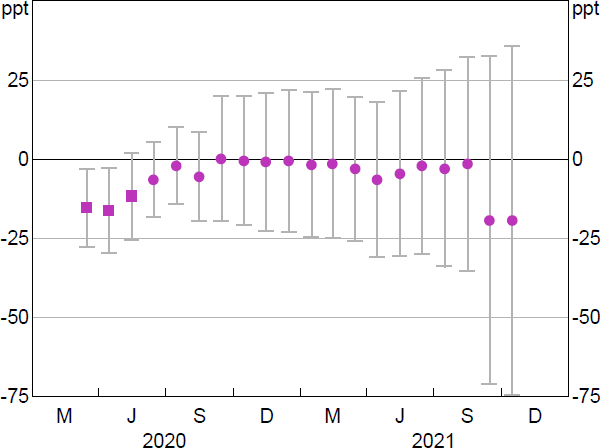
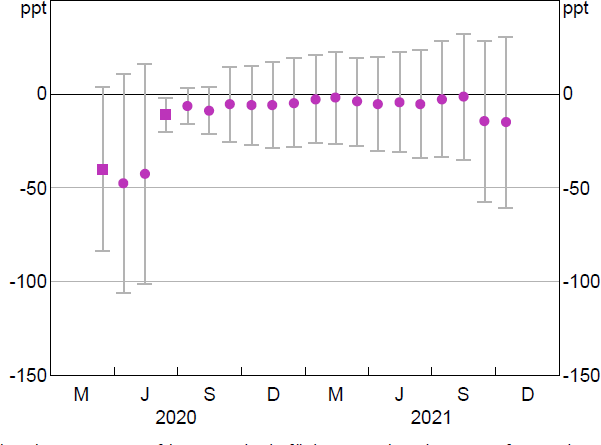
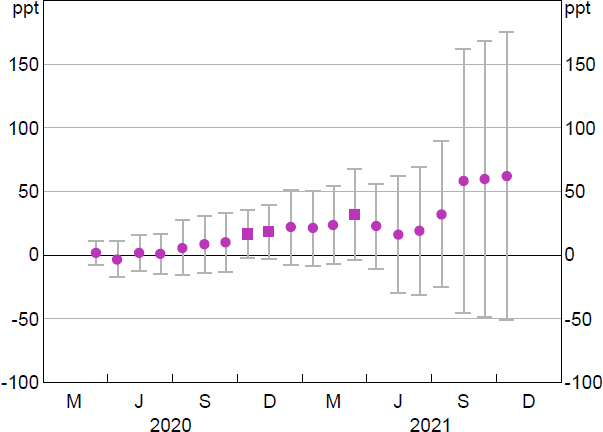
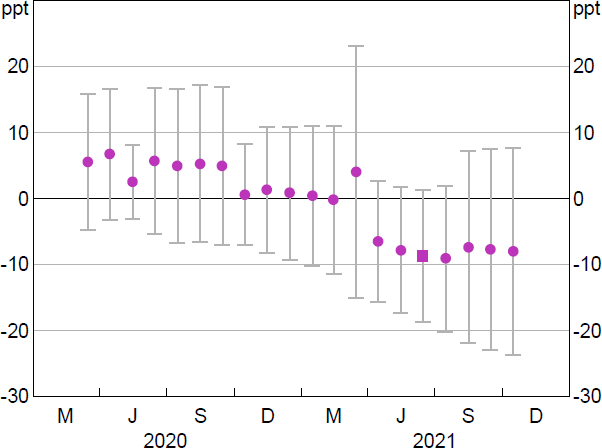
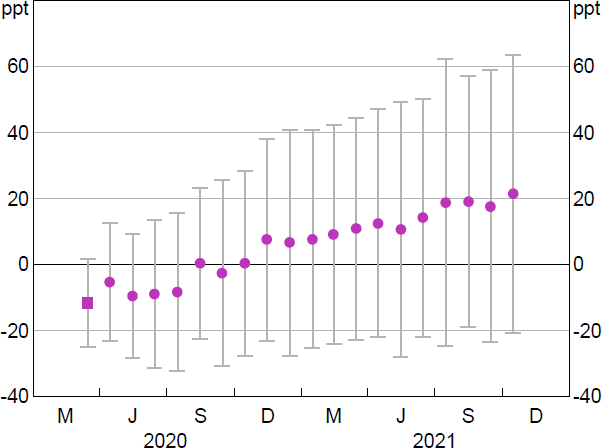
Notes: Whiskers show 95 per cent confidence intervals. The filled square marker indicates a significant result.
Sources: APRA; Authors' calculations; RBA
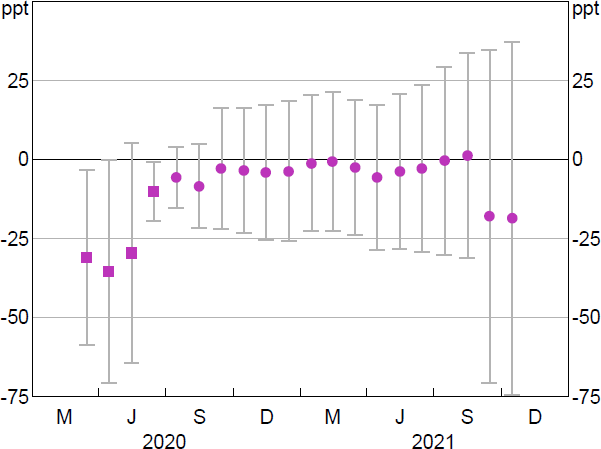
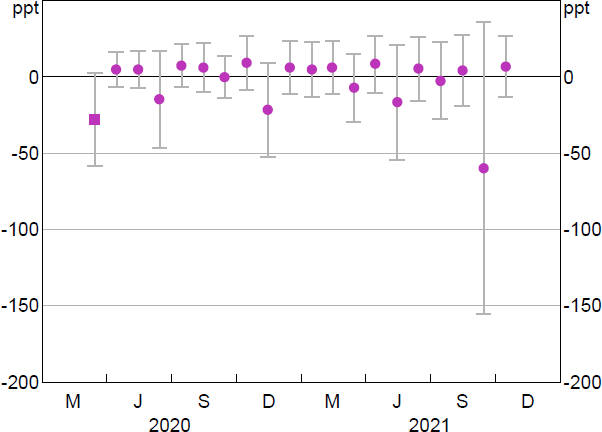
Notes: Whiskers show 95 per cent confidence intervals. The filled square marker indicates a significant result.
Sources: APRA; Authors' calculations; RBA
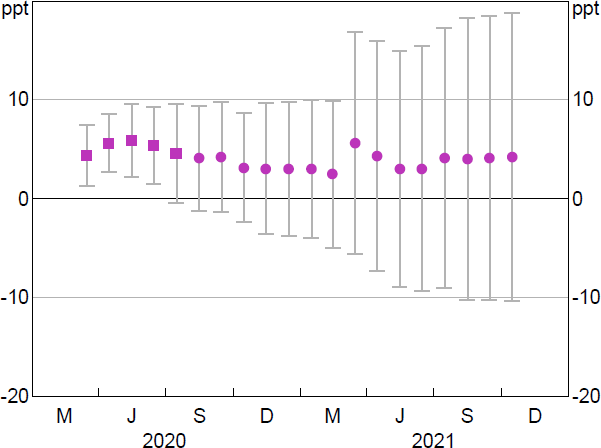
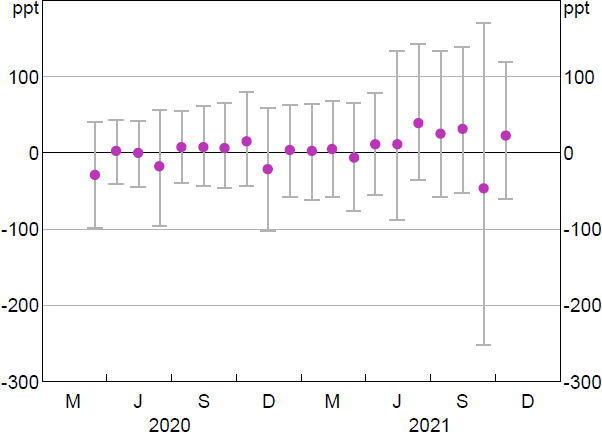
Notes: Whiskers show 95 per cent confidence intervals. The filled square marker indicates a significant result.
Sources: APRA; Authors' calculations; RBA
Notes: Whiskers show 95 per cent confidence intervals. The filled square marker indicates a significant result.
Sources: APRA; Authors' calculations; RBA
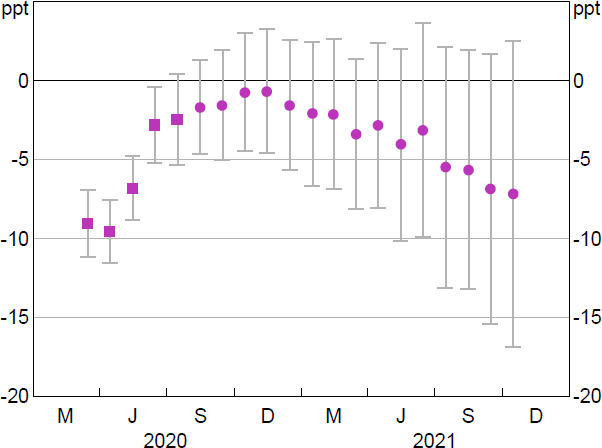
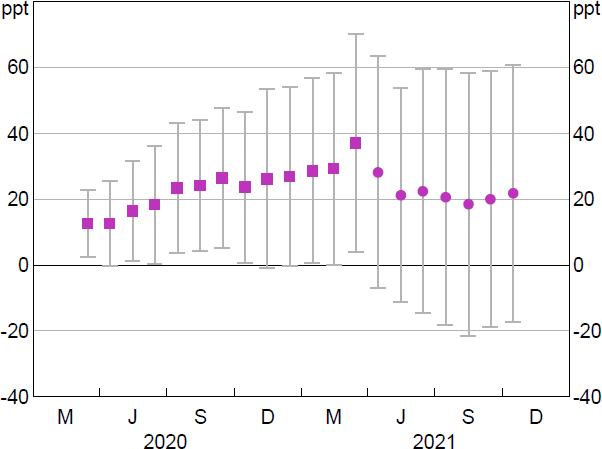
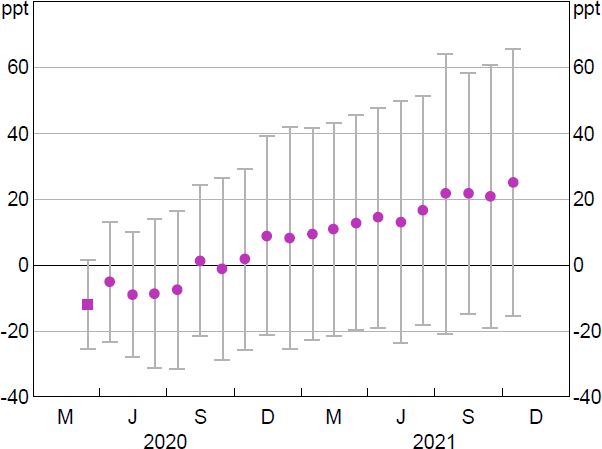
Notes: Weighted by each bank's level of business credit in the base period. Whiskers show 95 per cent confidence intervals. The filled square marker indicates a significant result.
Sources: APRA; Authors' calculations; RBA
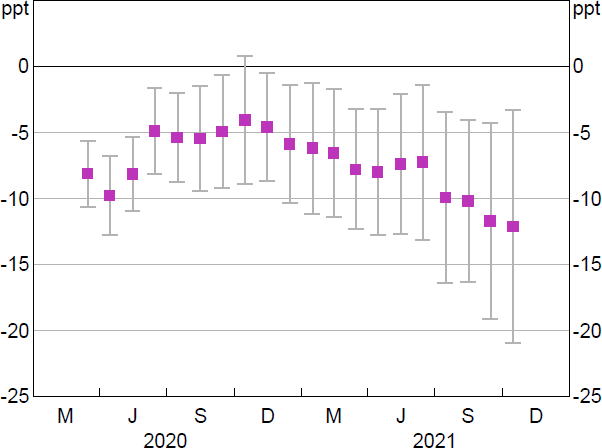
Notes: Weighted by each institution's level of business credit in the base period. Whiskers show 95 per cent confidence intervals. The filled square marker indicates a significant result.
Sources: APRA; Authors' calculations; RBA
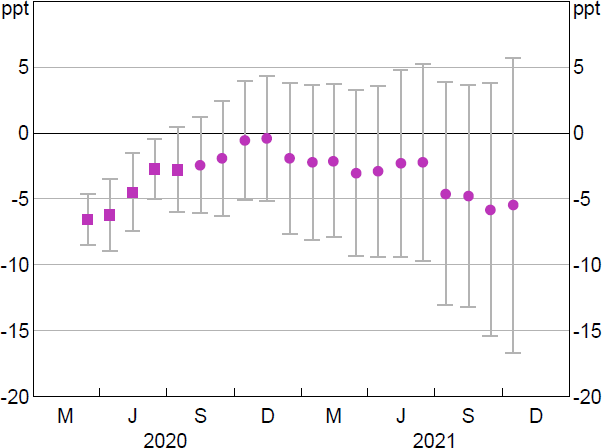
Notes: Weighted by each bank's level of business credit in the base period. Whiskers show 95 per cent confidence intervals. The filled square marker indicates a significant result.
Sources: APRA; Authors' calculations; RBA
Notes: Whiskers show 95 per cent confidence intervals. The filled square marker indicates a significant result.
Sources: APRA; Authors' calculations; RBA
Notes: Whiskers show 95 per cent confidence intervals. The filled square marker indicates a significant result.
Sources: APRA; Authors' calculations; RBA
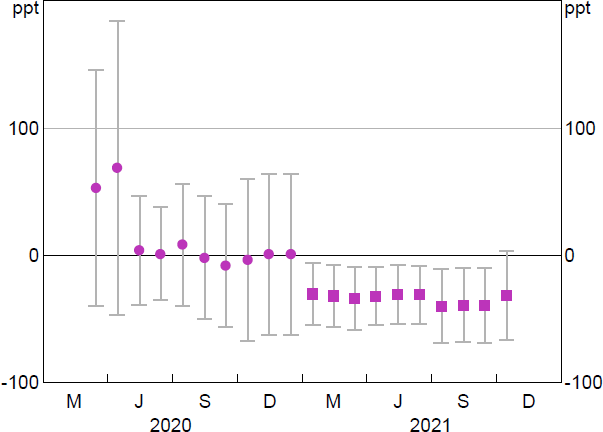
Note: Whiskers show 95 per cent confidence intervals.
Sources: APRA; Authors' calculations; RBA
Notes:
Weighted by each institution's level of business credit in the base period. Whiskers show 95 per cent confidence intervals.
The filled square marker indicates a significant result.
Sources: APRA; Authors' calculations; RBA
Notes:
Weighted by each institution's level of business credit in the base period. Whiskers show 95 per cent confidence intervals.
The filled square marker indicates a significant result.
Sources: APRA; Authors' calculations; RBA
Notes: Whiskers show 95 per cent confidence intervals. The filled square marker indicates a significant result.
Sources: APRA; Authors' calculations; RBA
Note: Whiskers show Anderson–Rubin 95 per cent confidence intervals.
Sources: APRA; Authors' calculations; RBA
Notes: Whiskers show 95 per cent confidence intervals. The filled square marker indicates a significant result.
Sources: APRA; Authors' calculations; RBA
Notes: Whiskers show 95 per cent confidence intervals. The filled square marker indicates a significant result.
Sources: APRA; Authors' calculations; RBA