RDP 2022-05: The Real Effects of Debt Covenants: Evidence from Australia 2. Corporate Debt Covenants in Australia
October 2022
- Download the Paper 1,648KB
For this paper I use the database of corporate debt covenants in Australia that I previously constructed in Nguyen (2021). To create this database I employed text analytic techniques to extract information about the prevalence, types and violations of debt covenants by non-financial listed Australian companies from their publicly available annual reports, collected from the Connect4 website. For details on the construction of the data, see Appendix A. Figure 1 shows an example of debt covenants being mentioned in a firm's annual report and reveals the three financial covenants the firm was subject to: equity ratio, leverage ratio and interest cover (or coverage) ratio. Figure 2 shows an example of a firm that breached its banking covenants for the financial year.
‘In addition to the eligible collateral, the Group has several general and financial undertakings which it must comply with including an Equity Ratio covenant, a Leverage Ratio covenant and an Interest Cover Ratio covenant.’
Source: Connect4
‘For the year ended 30 June 2017, the Consolidated Entity made a loss of $7,337,000 (2016: profit of $5,317,000) and was in breach of its banking covenants as disclosed in Note 20.’
Source: Connect4
One drawback of this method is that it relies on the firm self-reporting, which may lead to selection bias. Australian companies are not required to report the existence of covenants and, indeed, they may have incentives not to report them. For instance, financially vulnerable firms may want to avoid any signal of their poor financial health. Alternatively, financially strong firms may have an incentive to mention covenants and draw attention to their compliance. This means that large and financially stable firms might have self-selected into the sample by reporting on their debt covenants, and in turn, might have become over-represented in the sample. On the other hand, the Australian Accounting Standard on ‘Financial Instruments: Disclosures’ requires disclosures of non-remedied covenant breaches, as they have material effects on the classification of debt in the financial statements (AASB 2022). This means that firms need to disclose instances of covenants breaches in their public reports. The self-reporting bias hasn't necessarily been constant over time. ASIC's financial reporting guideline has increasingly emphasised the importance of disclosing information that ‘investors would want to know’ in their financial reports (ASIC 2020). This increase in financial reporting standards might contribute to an increase in the reported exposure to debt covenants over time.
In addition to the prevalence of debt covenants, the annual reports also allow for extraction of the types of debt covenants a firm was subject to in the reporting period. I categorise the types of debt covenants into:
- Interest coverage covenants (ICC): set a minimum on the interest coverage ratio (ICR), which is the ratio of firm earnings (usually EBITDA (earnings before interest, taxes, depreciation and amortisation)) to interest payments on total debt (not just on the debt from the loan facility that imposed the covenants). Alternative names that often appear in the reports include fixed charge coverage and debt service coverage with slightly different calculations.
- Other earnings-based covenants (OEC): limit the stock of debt to be no more than some multiple of earnings. Examples include debt-to-earnings, debt-to-EBITDA and debt-to-cash flow ratios.
- Asset-based covenants (ABC): restrict the firm's maximum amount of debt or minimum amount of equity by requiring that the firm maintains leverage below or net worth above certain thresholds. They are usually called gearing (debt-to-equity) or leverage (debt-to-assets) ratios.
To assess how the prevalence of different types of debt covenants varies across different types of firms, I match the data on covenants with balance sheet information from the Morningstar database of Australian listed companies. The matched sample contains roughly 17,000 observations from 3,742 unique non-financial listed firms between 2002 and 2020. Table 1 presents summary statistics of firms without covenants (but having debt), firms subject to each type of covenant and firms that have breached covenants, by their financial characteristics. On average, roughly 25 per cent of the sample (more than 4,600 firm–year observations) reported debt covenants, of which around 13 per cent also reported having breached them. Roughly 30 per cent of firms reporting debt covenants specify which types of covenants they are subject to. ICC appears to be the most common type of covenant (60 per cent of reporting firms), followed by ABC (50 per cent) and OEC (30 per cent) (Table 1). Note that the sample contains only non-financial listed firms, which are inherently larger and of different financial characteristics compared to the broader population of firms. To the extent that larger, more complex firms are more likely to have access to loans entailing debt covenants instead of collaterals, the share of debt covenants is potentially more prevalent in this sample.
| None(a) | Covenants(b) | Breaches | ICC | OEC | ABC | |
|---|---|---|---|---|---|---|
| Revenue ($ million) | 14.0 | 104.5 | 108.9 | 93.5 | 91.7 | 119.8 |
| Debt ($ million) | 6.0 | 61.7 | 63.3 | 68.5 | 44.6 | 79.3 |
| Cash ($ million) | 5.0 | 15.2 | 13.7 | 13.7 | 10.5 | 17.9 |
| Assets ($ million) | 53.0 | 290.4 | 315.7 | 362.0 | 236.8 | 412.5 |
| Investment ($ million) | 6.5 | 44.5 | 39.8 | 36.8 | 32.6 | 55.9 |
| Staff expenses ($ million) | 2.5 | 18.4 | 21.5 | 18.8 | 18.8 | 25.1 |
| Return on equity ratio | 0.1 | 0.2 | 0.2 | 0.2 | 0.2 | 0.2 |
| Debt-to-equity ratio | 0.2 | 0.5 | 0.5 | 0.5 | 0.5 | 0.4 |
| Debt-to-EBITDA ratio | 0.1 | 3.0 | 3.1 | 3.4 | 3.4 | 3.2 |
| Interest coverage ratio | 2.5 | 6.1 | 5.7 | 5.7 | 6.6 | 5.7 |
| Share of breaches (%) | na | 13 | na | 11 | 8 | 8 |
| Observations | 12,567 | 4,613 | 592 | 726 | 485 | 686 |
|
Notes: (a) Firms without covenants but having debt in the year. Sources: Author's calculations; Connect4; Morningstar |
||||||
Table 1 also presents the median value for a number of financial measures across different covenant configurations. First, similar to the United States (Greenwald 2019; Lian and Ma 2021), firms with covenants in Australia tend to be much larger, in both revenue and assets, than firms without covenants. They are also more leveraged (higher debt-to-equity ratio), but more profitable (higher return-on-equity ratio) and have higher interest coverage ratios. This is unsurprising since larger firms tend to borrow more and have more consistent earnings to cover the cost of debt financing. Interestingly, on average, there is not a substantial difference in financial characteristics for firms that have experienced a breach in covenants, suggesting that violation instances are not unique to firms with specific financial circumstances.
Turning to different types of covenants, Australian firms reporting ICC and OEC (both are earnings-based) tend to be slightly smaller (in both revenue and balance sheet) than those reporting ABC. Interestingly, firms reporting ABC tend to be less leveraged, indicating that they have generally stronger balance sheets or that the ABC have restricted their opportunity to leverage their assets. On the other hand, firms reporting OEC appear most profitable with the highest median return-on-equity and interest coverage ratios. The breaching rate is only slightly different across covenant types, limiting concerns about structural shifts in reporting of covenant types due to breaches.
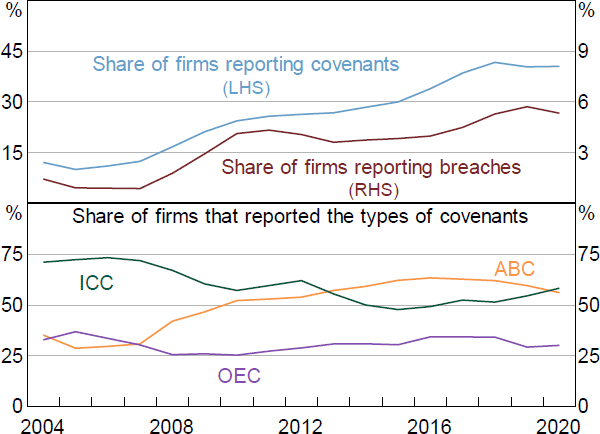
Figure 3 shows that the share of firms reporting debt covenants has steadily increased over time, from around 10 per cent in the early 2000s to nearly 40 per cent in the late 2010s. As discussed earlier, this could be due to the trend towards greater transparency in corporate reporting or an increase in the usage of covenants in debt contracts (or both). The structure of debt covenants among reporting firms also appears to have gone through a significant change around the GFC. In the early 2000s, more than 70 per cent of reporting firms were subject to ICC but the prevalence of ICC has steadily declined in the past decade. On the other hand, ABC has become more commonly used over time while the prevalence of OEC has stayed constant. In comparison, corporate debt covenants in the United States, the United Kingdom, Japan and Finland are predominantly earnings based (Niskanen and Niskanen 2004; Moir and Sudarsanam 2007; Kochiyama and Nakamura 2014; Lian and Ma 2021), and the share of earnings-based covenants has remained constant over the years (Greenwald 2019).
Sources: Author's calculations; Connect4; Morningstar
Interestingly, the characteristics of firms subject to specific covenants are stable over time (Table B2). If the increase in reporting of ABC were due to greater reporting requirements, we might expect some change in the nature of the firms, for example, an increase of ‘safer’ firms that formerly had no need to disclose reporting. However, since no such shift is evident, it appears that the increase is not just driven by this trend in reporting.
Another possible explanation is that the shift in covenant composition away from ICC towards ABC could reflect considerations during the debt contracting process. Asset-based covenants have been shown to reduce the need to renegotiate loan terms as they better align the incentives of shareholders with those of lenders by putting restrictions on how much wealth is kept within the firm (Christensen and Nikolaev 2012). The shift could also reflect the increased use of unsecured loans relative to secured loans, with lenders putting restrictions on the total pool of assets subject to claims with asset-based covenants, rather than securing against specific collateral. In fact, the unsecured share of loans in the sample has increased from around 8 per cent before the GFC to 12 per cent after the GFC.
In terms of covenant violations, the fraction of firms reporting breaches of covenants rose sharply during the GFC, with a slight further rise in the late 2010s. As firms have to report instances of breaches, this rise will not reflect changes in reporting standards, though part of it may simply reflect increased use of covenants. The breaching rate, conditional on firms reporting covenants, is more stable and in line with the trends in the United States, where 10 to 20 per cent of firms reported breaches every year (Nini et al 2012). However, the conditional rate is potentially subject to bias due to selective reporting.
The use and structure of debt covenants also vary across industries. Debt covenants are most used in the real estate sector, while the materials (including mining) and energy sectors have the least use of covenants. ABC appear more popular in capital-intensive sectors (e.g. real estate and utilities), while ICC and OEC are more prevalent in services sectors (e.g. commercial and professional services, communication services and IT). In addition, the utilities and health care sectors stand out as having the largest shares of firms reporting a covenant breach (Figure B1).