RDP 2022-05: The Real Effects of Debt Covenants: Evidence from Australia Appendix F: Average Partial Responses Relative to 2003
October 2022
- Download the Paper 1,648KB
Figure F1: Average Partial Responses Relative to 2003 – Non-mining
One year following a 100 basis point expansionary monetary policy shock
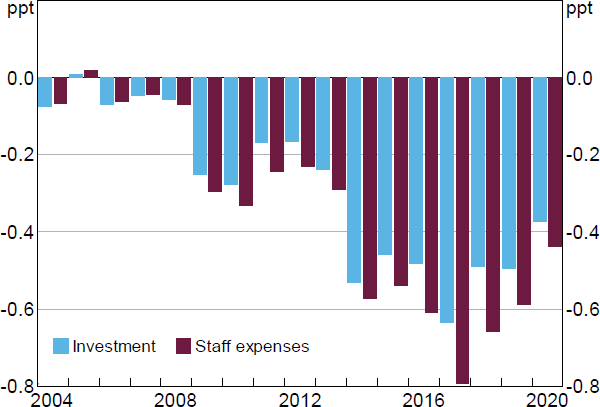
Note: Average partial responses in each year are calculated using the NC, ICC and NICC shares of firms in the year.
Sources: Author's calculations; Beckers (2020); Connect4; Morningstar
Figure F2: Average Partial Responses Relative to 2003
One year following a 100 basis point expansionary monetary policy shock
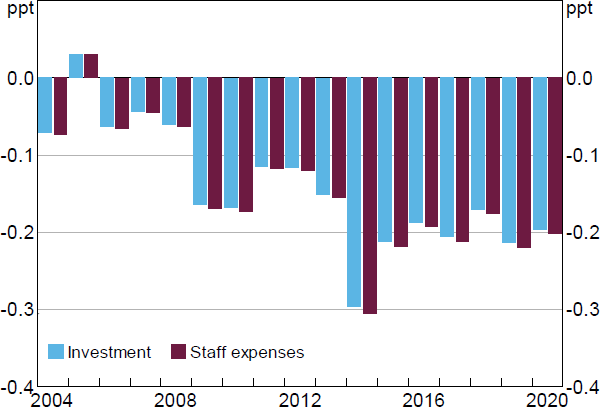
Note: Average partial responses in each year are calculated using the NC share of firms in 2003 and the ICC and NICC shares of firms subject to covenants in the year.
Sources: Author's calculations; Beckers (2020); Connect4; Morningstar