RDP 2021-10: The Rise in Household Liquidity 4. Stylised Facts about Household Liquidity
November 2021
- Download the Paper 1.71MB
4.1 How is liquidity distributed across households?
We examine the cross-sectional distribution of household liquidity using household-level data from the 2017/18 SIH. The household-level module collects detailed information on households' income and wealth. For retirees, we assume their superannuation balances are fully liquid. We assume a person is retired if the person receives regular superannuation income.
The distribution of liquidity across households is strongly related to the housing life cycle – both in terms of age and housing tenure. Older households and outright home owners (that are typically retired) hold the highest shares of liquid assets relative to income. This is true whether we consider superannuation is fully liquid for retired households or not. In contrast, young households and renters typically hold the lowest liquidity buffers and are much more likely to be liquidity constrained.
Household liquidity buffers tend to increase with the age of the household head (Figure 4). Similarly, the share of liquidity-constrained households falls significantly with age. This is consistent with the intuition that households gradually accumulate assets over their lifetimes and are more able (and willing) to diversify towards liquid assets, such as shares and bonds, as they get older.
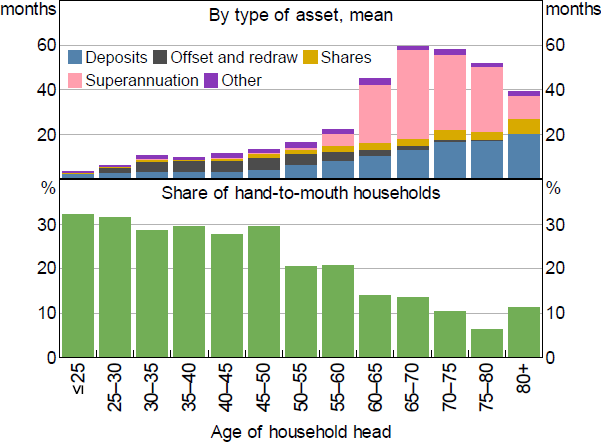
Sources: ABS; Authors' calculations; RBA
Most young households (< 35 years) have a liquidity buffer of less than six months, with much of this stored in bank deposits. By middle age, people tend to move into home ownership and store much of their liquidity in redraw and offset accounts. When people reach retirement age, their liquid assets increase significantly as funds in their superannuation accounts become liquid. Even abstracting from superannuation balances, household liquid assets increase with age.
Liquidity is unevenly distributed across households with different housing tenure (Figure 5). Outright home owners have the largest liquidity buffers on average, partly because they are more likely to be retirees that can access superannuation but also because they no longer have the expense of a mortgage. Abstracting from superannuation balances, outright home owners still have larger buffers on average. In contrast, young renters typically hold the lowest shares of liquid assets and more than 40 per cent of renters are estimated to be liquidity constrained. Renters are typically younger and have had less time to build wealth.
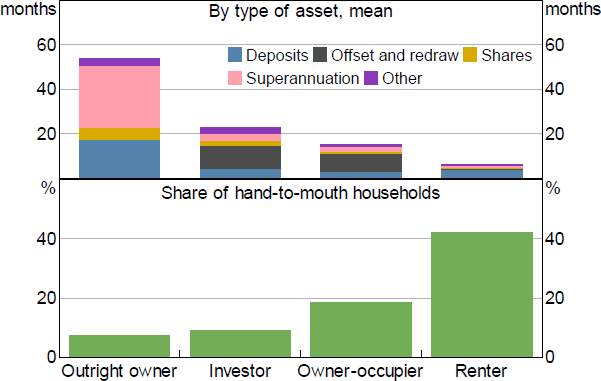
Sources: ABS; Authors' calculations; RBA
Housing investors have the largest liquidity buffers among indebted households.[9] The average housing investor has a liquidity buffer of around two years' worth of income and is much less likely to be liquidity constrained than other households. Moreover, indebted investors that own multiple rental properties have even larger liquidity buffers on average. First home buyers have the lowest liquidity buffers among households with a mortgage, consistent with these households being at a relatively early stage in the life cycle. However, first home buyers are not more likely to be liquidity constrained than other indebted home owners. This may be because many first home buyers choose when to buy and how much to spend on a home, and hold just enough liquidity to keep them out of financial trouble after their purchase decision. Alternatively, lenders may be more likely to lend to borrowers that have a relatively large buffer after taking on mortgage debt.
To more closely examine the cross-sectional determinants of household liquidity buffers a simple regression was estimated based on the household survey data. The regression results support the graphical findings. In particular, factors associated with the housing life cycle, such as age and housing tenure, are important determinants of the distribution of buffers across households.
4.2 How has household liquidity changed over time?
Turning to the dynamics of household liquidity, we find that household liquidity buffers have risen strongly over the past couple of decades. This is true when measured against income (top panel of Figure 6) or spending (middle panel). But, importantly, the ratio of liquid assets to total assets has not changed much at all over the last two decades (bottom panel of Figure 6). This suggests that households have not shifted their asset portfolios more towards liquid assets. Instead, household balance sheets have expanded, with both liquid and illiquid assets rising relative to income. We find similar trends when looking across other OECD countries – see Appendix B.
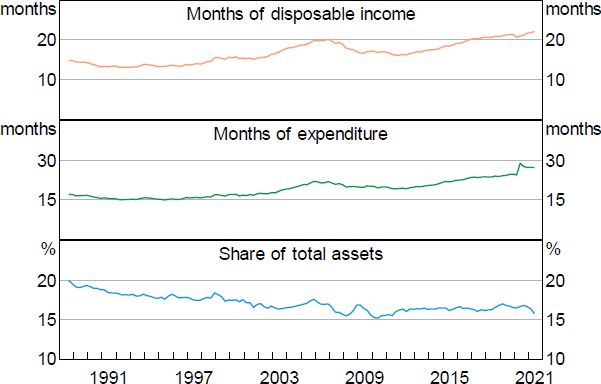
Sources: ABS; Authors' calculations
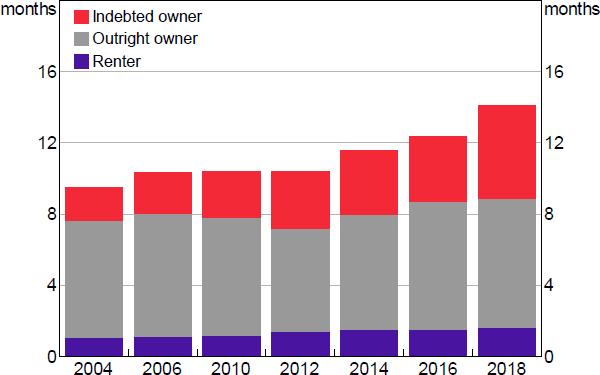
The increase in liquidity buffers is also apparent at the household level, with the average liquidity buffer steadily increasing since the early 2000s (Figure 7). The increase in liquidity is also very broad based across households, though housing tenure appears to be important in explaining the trend as well. Specifically, the rise in buffers has been largest amongst households with mortgage debt (Figure 8). For these households, higher buffers have been driven mainly by the increased value of offset and redraw accounts, which account for close to half their liquid assets.
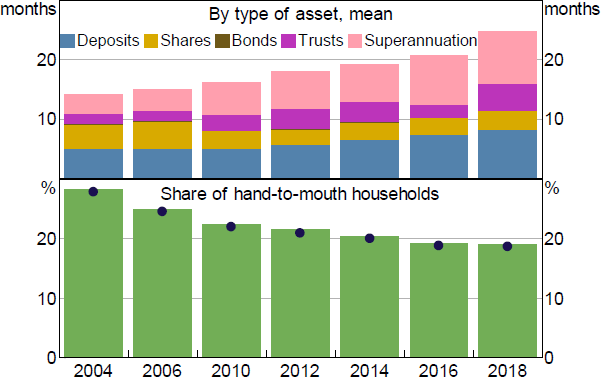
Notes: Deposits include offset accounts; dots represent share of hand-to-mouth households after adjusting for ‘liquid’ superannuation
Sources: ABS; Authors' calculations
Sources: ABS; Authors' calculations
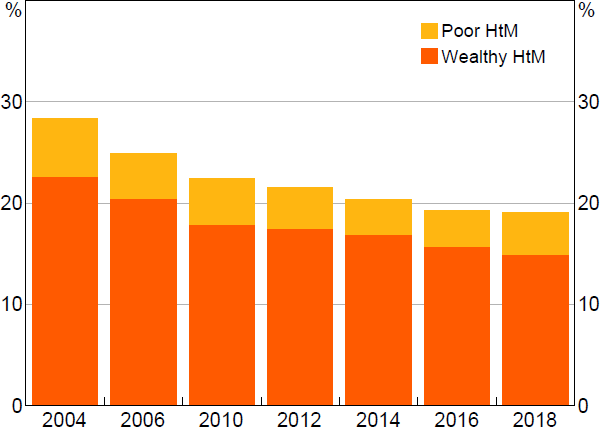
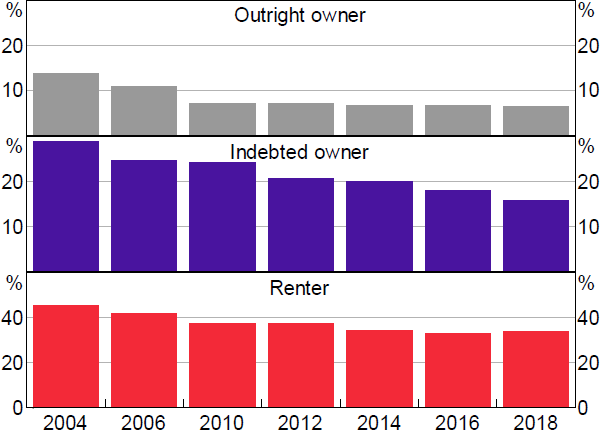
Consistent with the increase in average liquidity buffers, the share of liquidity-constrained households has generally fallen over the past two decades. Almost all of this decline in liquidity-constrained households is due to fewer ‘wealthy’ hand-to-mouth households, with the share of ‘poor’ hand-to-mouth households being broadly stable (Figure 9). The decline in the prevalence of liquidity constraints is broad based across age and housing tenure (Figure 10).
Sources: ABS; Authors' calculations
Sources: ABS; Authors' calculations
The introduction of mortgage offset and redraw facilities is likely to have increased the liquidity of housing wealth and contributed to the rise in aggregate household liquidity. At an aggregate level, around one-fifth of the increase in liquid assets (relative to disposable income) since the 2010s has been channelled into offset and redraw accounts. Among those with mortgage debt, increased wealth held in offset and redraw facilities accounts for about two-thirds of the increase in liquidity over the same period.
It is challenging to identify the causal effect of these innovations on liquidity buffers. This is because borrowers that select mortgages with such features could be systematically different from those that do not, and these systematic differences could reflect a range of borrower characteristics, some of which are likely to be unobservable (e.g. risk preferences). However, we can partly gauge the importance of offset accounts by separating borrowers into those that report having an offset account and those that report they do not, and controlling for a wide range of observed characteristics that are likely to be correlated with the decision to select such mortgages.
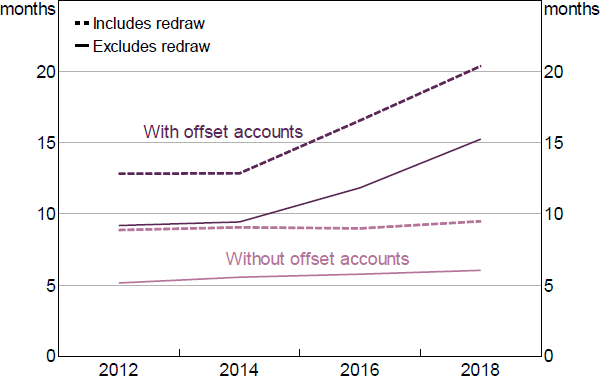
The increase in buffers amongst households with mortgage debt is mainly driven by households with offset accounts, at least since the 2010s (Figure 11).[10] Households with an offset account have larger buffers than those without offset accounts, on average. More notably, these households also experience a much larger increase in buffer, even after controlling for a range of household characteristics such as income, age and household size. This suggests that such innovations in the mortgage market have supported the rise in household liquidity.
Sources: ABS; Authors' calculations; RBA
4.3 How has household liquidity changed over the life of a loan?
Next, we examine how debt, repayments and liquidity evolve over the life of a mortgage using loan-level data drawn from the SIH and the HES that cover the period since 2003/04 at roughly two-year intervals.
Not surprisingly, gross mortgage debt gradually falls relative to income as the loan ages and the debt is repaid (top panel of Figure 12). At the same time, liquid assets rise relative to income (middle panel of Figure 12), indicating that net debt (gross debt less liquid assets) falls even faster. Consistent with this, the probability of being liquidity constrained decreases with loan age (bottom panel of Figure 12), suggesting that borrowers become more resilient to balance sheet shocks as loans age, all else equal.
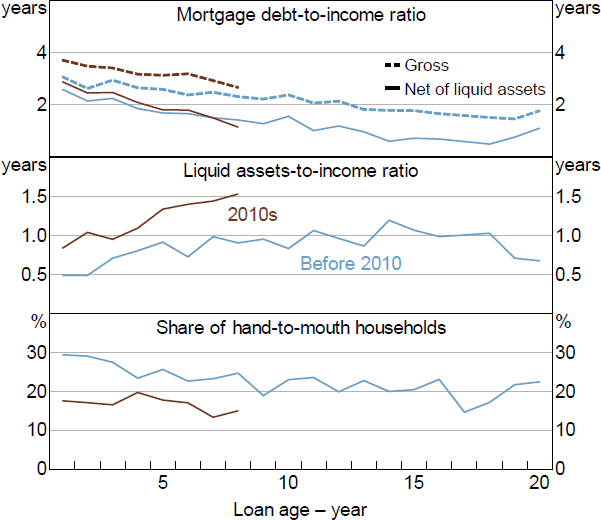
Sources: ABS; Authors' calculations; RBA
The life cycle evolution of debt can also be estimated for different ‘birth cohorts’ of mortgages. For this, mortgages are split into two groups – those loans originated before and after 2010. In the early years of loan life, the gross debt-to-income ratio is slightly higher on loans originated in the 2010s compared to those originated earlier, consistent with a higher housing price-to-income ratio at birth. However, the net debt-to-income ratios are similar for the two birth cohorts, indicating that liquidity buffers are larger (and growing more quickly) for the more recent cohort. Similarly, borrowers with loans originated in the 2010s are much less likely to be liquidity constrained than earlier loan cohorts.[11]
The loan-level information also allows us to split scheduled mortgage payments into interest and principal payments over the loan life cycle. Consistent with the function of a credit foncier model, we observe a steady decline in the share of income going to interest payments and an offsetting increase in the share going to principal payments as the loan ages (Figure 13). Clearly, the ratio of principal payments to income is much higher for loans born in the 2010s than for earlier birth cohorts. This is consistent with borrowers being able to build buffers more quickly in the 2010s compared to earlier decades, and provides a saving mechanism through which mortgagors can build liquidity.
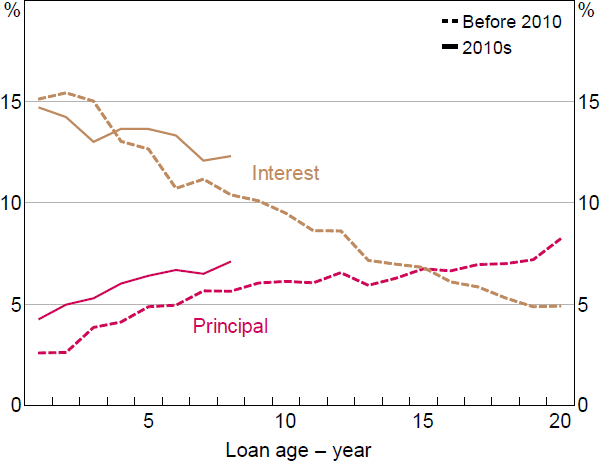
Sources: ABS; Authors' calculations; RBA
Footnotes
Loan-level analysis of liquidity buffers for housing investors typically focus on prepayment buffers because they do not observe the entire balance sheet of the household. The full extent of the liquidity of investor balance sheets can only be observed in household surveys. [9]
Offset accounts data prior to 2010 are not available in the SIH. [10]
Further disaggregation of the liquidity buffers indicates that this difference in buffers between loan birth cohorts at the start of the loan is due to differences in deposit holdings, and particularly offset accounts. New borrowers may be choosing to take on more debt than required and saving some of the additional funds in offsets, as this increases liquidity without affecting the expected interest costs over the life of the loan. This is consistent with these innovations increasing the liquidity of housing wealth. [11]