RDP 2021-10: The Rise in Household Liquidity 7. Alternative Explanations for the Rise in Household Liquidity
November 2021
- Download the Paper 1.71MB
Based on the analysis in the preceding sections, the increase in household liquidity appears to be closely connected to the housing market. In this section we consider some other demand-side and supply-side factors that could explain the rise in household liquidity over recent decades.
7.1 Ageing population
An obvious demand-side explanation for the rise in household cash is an ageing population. Older households typically hold more of their portfolios in liquid assets and so an increase in the share of older households will mechanically increase the ratio of liquid assets to income in aggregate.
We find some evidence for an ageing population story using the distributional accounts. These accounts allow us to track how liquidity evolves both within and between different age groups in the economy. Between 2003/04 and 2017/18, the aggregate liquidity buffer rose by about 2½ months of disposable income. The distributional accounts indicate that the population aged 65 and above accounted for about one month of this aggregate increase (Figure 19).[21]
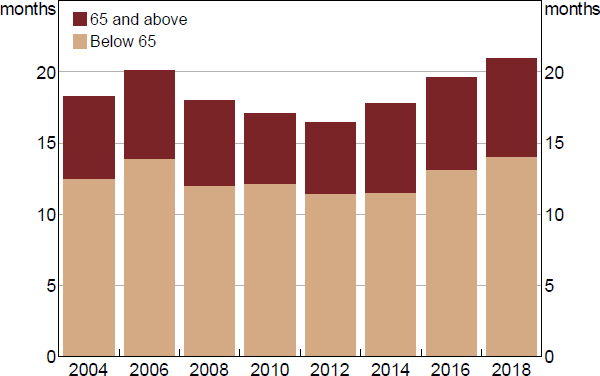
Sources: ABS; Authors' calculations
7.2 Higher income and wealth inequality
Along with an ageing population, we have observed an increase in both income and wealth inequality in Australia over the past two decades. If richer households hold a greater share of their portfolios in liquid assets then this rise in the concentration of income and wealth could also explain the rise in aggregate liquidity buffers. Based on the distributional accounts, richer households (in the top quintile) hold more of their wealth in liquid assets than other households (on either an income or wealth basis). Between 2003/04 and 2017/18 the top income quintile accounted for more than one month of the total increase of liquidity (of 2½ months of income) (Figure 20). This suggests that the rise in income inequality has been important to the rise in aggregate liquidity. However, the contribution of the top income quintile to the increase in aggregate buffer is sensitive to the sample period.
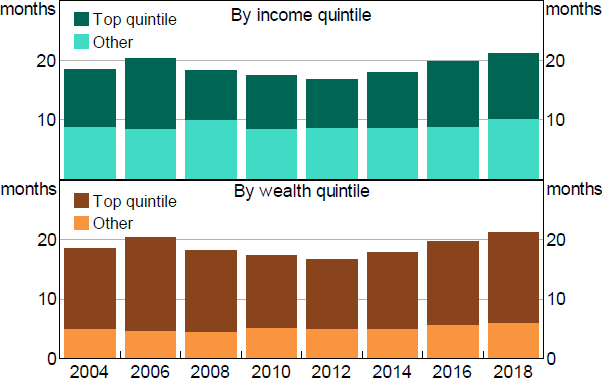
Sources: ABS; Authors' calculations
7.3 Higher demand for deposit liabilities amongst banks
The rise in household liquidity could also be due to supply-side factors. Retail deposits are a stable source of funding. Banks have increased their retail deposit funding since the global financial crisis (GFC) as they seeking more stable funding. The introduction of new liquidity regulations – such as the Net Stable Funding Ratio requirement that came into force at the start of 2018 – has supported the banks' demand for stable funding over recent years. Moreover, we find that the growth in the deposit share of banks' funding since the GFC is stronger at banks that started with relatively low levels of deposit funding in the pre-GFC period. This is consistent with banks competing harder for deposits by offering more attractive transaction and saving accounts, particularly through paying higher interest rates on these accounts. Retail deposit rates increased sharply in the period immediately after the GFC, though they have steadily declined over the past decade (Black, Titkov and Wang 2020).
Footnote
We find some role for the age structure of the population in predicting aggregate liquidity buffers based on the cross-country panel evidence in Appendix B. [21]