RDP 2021-08: Job Loss, Subjective Expectations and Household Spending Appendix B: Full Regression Output
August 2021
- Download the Paper 2,109KB
Figure B1: Effect of Unemployment on Annual Total Spending
Sensitivity to controls
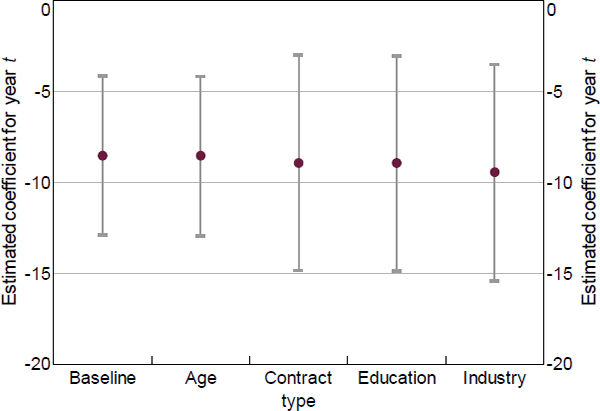
Notes: Controls are added cumulatively; lines represent 95 per cent confidence intervals
Sources: Authors' calculations; HILDA Survey Release 19.0
| Dependent variable | Groceries | Meals eaten outside the home | Total expenditure |
|---|---|---|---|
| Unemployed | −0.05*** (0.01) |
−0.44*** (0.05) |
−0.06** (0.03) |
| Unemployed * lagged job loss probability | −0.04 (0.04) |
0.08 (0.15) |
−0.02 (0.07) |
| Lagged job loss probability | −0.01 (0.01) |
−0.06** (0.02) |
−0.04** (0.02) |
| Square root (number of household members) | 0.68*** (0.01) |
0.20*** (0.02) |
0.47*** (0.02) |
| Year (base = 2006) | |||
| 2007 | 0.10*** (0.01) |
0.07*** (0.03) |
0.04*** (0.01) |
| 2008 | 0.16*** (0.01) |
0.05* (0.03) |
0.10*** (0.01) |
| 2009 | 0.17*** (0.01) |
0.07** (0.03) |
0.07*** (0.01) |
| 2010 | 0.19*** (0.01) |
0.15*** (0.03) |
0.13*** (0.01) |
| 2011 | 0.24*** (0.01) |
0.25*** (0.03) |
|
| 2012 | 0.24*** (0.01) |
0.28*** (0.03) |
|
| 2013 | 0.25*** (0.01) |
0.27*** (0.03) |
|
| 2014 | 0.27*** (0.01) |
0.35*** (0.03) |
|
| 2015 | 0.28*** (0.01) |
0.38*** (0.03) |
|
| 2016 | 0.28*** (0.01) |
0.43*** (0.03) |
|
| 2017 | 0.28*** (0.01) |
0.40*** (0.03) |
|
| 2018 | 0.27*** (0.01) |
0.42*** (0.03) |
|
| 2019 | 0.30*** (0.01) |
0.47*** (0.03) |
|
| Constant | 3.80*** (0.01) |
3.75*** (0.04) |
9.63*** (0.03) |
| Fixed effects | Yes | Yes | Yes |
| R squared (overall) | 0.20 | 0.02 | 0.07 |
| Observations | 96,060 | 91,461 | 30,558 |
|
Notes: ***, ** and * denote statistical significance at the 1, 5 and 10 per cent levels, respectively; p-values are in parentheses Sources: Authors' calculations; HILDA Survey Release 19.0 |
|||