RDP 2017-05: The Property Ladder after the Financial Crisis: The First Step is a Stretch but Those Who Make It Are Doing OK 6. The Role of the Deposit
September 2017
The previous two sections examined whether the debt levels FHBs have been taking on, and their post-purchase repayment behaviour and risk levels, have changed since the financial crisis. Although we find evidence that FHBs are having to save more of their income for a deposit, and are facing a higher debt-servicing burden, we do not find evidence that FHBs have taken on ‘too much’ debt or are more risky post-financial crisis.
Instead, our results suggest that FHBs are taking on less debt relative to their income than they otherwise would have if the same rise in housing prices had occurred in an earlier period. FHBs appear to be behaving more conservatively than prior to the crisis. We also find that, if anything, FHBs are paying down loans more quickly and on several financial fragility measures are more secure than FHBs earlier in the 2000s. A plausible explanation for this finding is that those FHBs who are able to save enough to meet the higher deposit requirement imposed by higher housing prices are also households who are less likely to experience subsequent financial difficulties after taking on a loan. We examine the link between deposit size and financial fragility in more detail in this section.
While Table 3 identified an increase in the median deposit size since the financial crisis, the full distribution can reveal if there are any obvious patterns in the data. Figure 9 compares the distribution of deposit sizes between the pre- and post-GFC periods. What is apparent is that, while the modal deposit hasn't changed since the GFC, there has been as shifting out or flattening of the overall distribution of FHB deposit-to-income ratios between the periods. This suggests that the change in deposits has not been driven solely by, for example, the elimination of particularly small deposits that might have been associated with relatively risky high LVR lending. Instead the changes are throughout the distribution. This points towards a change in consumer behaviour more than the imposition of a regulatory or administrative floor by banks as being an important driver of the changes.
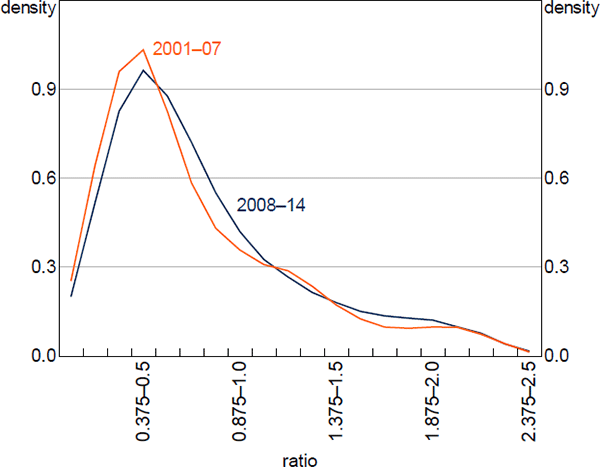
Note: Estimated using an adaptive Epanechnikov kernel
Sources: Authors' calculations; HILDA Survey Release 14.0
We next test our hypothesis that the deposit size is related to the likelihood of an FHB household experiencing financial stress (that is, experiencing any of the events listed in Table 5) in the years after purchasing a first home by running a simple regression.
Similar to the probit model specified by Equation (1), we specify a probit model of the form:

where the dependent variable FDi is binary and equal to one if the household
experienced financial distress in any year after purchasing a first home. Φ is the standard
normal cumulative distribution function. The variables of interest are  , which are
indicator variables equal to one if household i is in the qth quartile of the
deposit-to-income distribution, and other variables are defined as in Equation (1). The
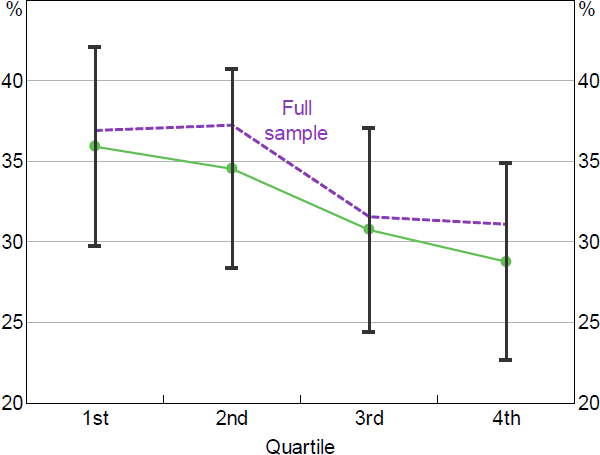
predicted probability of experiencing financial distress by deposit-to-income quartile and the
standard errors associated with the overall regression are shown in Figure 10.
, which are
indicator variables equal to one if household i is in the qth quartile of the
deposit-to-income distribution, and other variables are defined as in Equation (1). The
predicted probability of experiencing financial distress by deposit-to-income quartile and the
standard errors associated with the overall regression are shown in Figure 10.
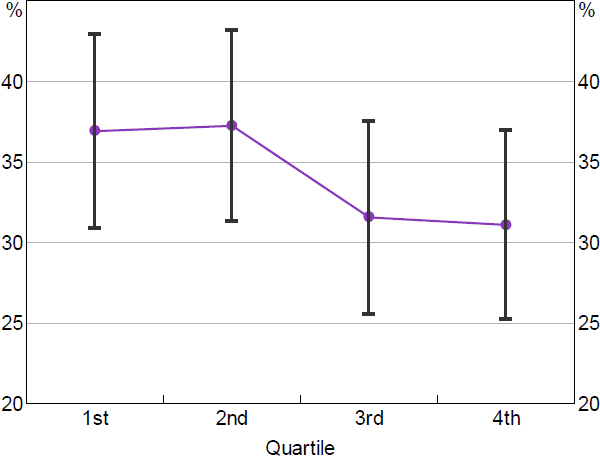
Sources: Authors' calculations; HILDA Survey Release 14.0; RBA
As can be seen, a higher deposit does decrease the probability of experiencing financial stress post-purchase, and the coefficients on the dummies for the 3rd and 4th quartiles are statistically significantly different from those of the 1st quartile at the 1 per cent level. This seems like pretty clear evidence that higher deposit requirements are serving to restrict first home buying to more financially stable households. Notably, there is a distinct break in the magnitude of the effect around the median, with those households that have an above-median deposit being substantially less likely to experience subsequent financial distress than those with a below-median deposit-to-income ratio.
A factor that would potentially confound the findings in Figure 10, and maybe account for the obvious break around the median, is the fact that a rising though still small share of FHBs are receiving financial assistance from family and friends (Figure 11).[25] It is possible that FHBs who have received help to meet the deposit requirement have less financial discipline than FHBs who have saved the entire sum independently. Nonetheless, if this was a significant confounding factor it would bolster the conclusion that the ability to save for a home deposit is a sign of financial discipline associated with fewer subsequent financial difficulties because this effect would serve to attenuate the strength of our findings in Figure 10.
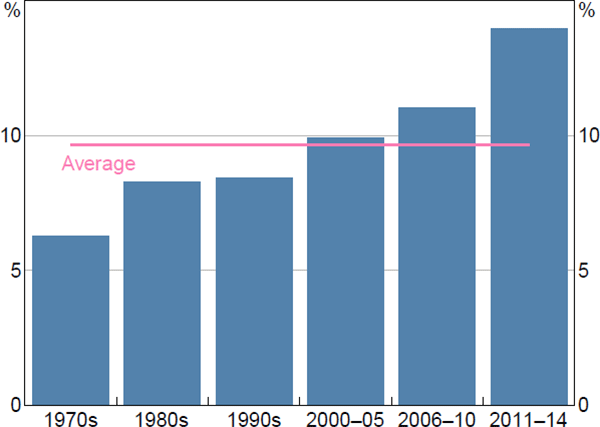
Sources: Authors' calculations; HILDA Survey Release 14.0
To assess whether financial assistance to FHBs is distorting these findings we compare FHBs who received financial assistance with their loan from family or friends to those that saved for their deposit independently. Looking at indicators for financial stress, we find that FHBs who received help with their loan are much more likely to have also received help from family and friends post-purchase. Around 23 per cent of these household received additional assistance in the years following their initial purchase, compared to 11 per cent of independent FHBs (Figure 12). In one respect, this is unsurprising. Parents willing and able to help their children are likely to continue to do so throughout their life. As such, it doesn't necessarily follow that these households are more likely to, say, default on their loans. However, FHB households who received help are also more likely to experience cash flow problems in the form of not being able to pay their utility bills or meet their mortgage repayments due to a shortage of money. This is more telling.
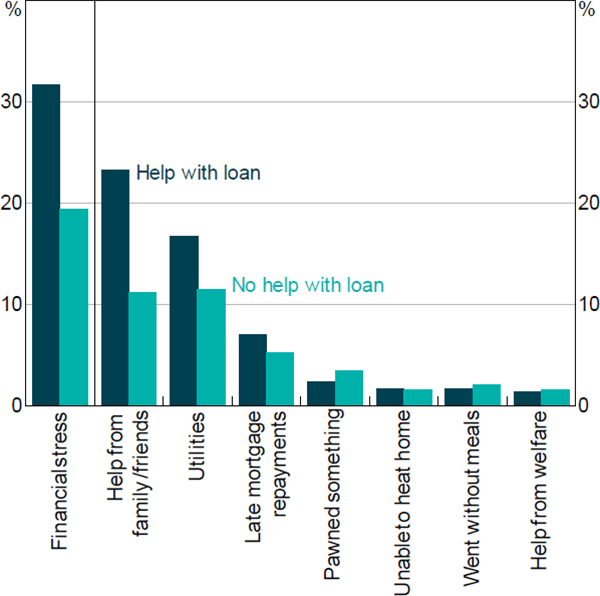
Sources: Authors' calculations; HILDA Survey Release 14.0
To control for the possible confounding of our results through the inclusion of households who have received help with their deposit, we re-run Equation (4) excluding those households that received deposit assistance. The results are shown in Figure 13. What we see is that the relationship between deposit size and subsequent financial distress is cleaner, with no obvious step around the median deposit. The relationship remains statistically significant. This feels like stronger evidence that deposits saved by the home buyers themselves matter.
Overall these findings bolster our confidence in our hypothesis that higher deposit requirements are acting to filter out less financially secure households from home ownership. This is not, of course, particularly surprising. Banks already emphasise the need for borrowers to have ‘genuine savings’ as an important consideration when assessing loans. However, the amount of ‘genuine savings’ required is usually small (e.g. 5 per cent of the purchase price), only required for high LVR loans and only needs to be demonstrated over a relatively short period of time (e.g. three months). Our findings in Figure 13 suggest that more savings accumulated by the household themselves, rather than just the existence of savings however accumulated, is better. Thus, as housing prices have increased, there has been a de facto tightening of credit standards quite apart from any other changes in the market. We suspect this aspect has not been fully appreciated given the popular focus on the negative effects of the size of the debt households are taking on rather than the positive indirect effects flowing from the associated larger deposits.
Sources: Authors' calculations; HILDA Survey Release 14.0; RBA
Footnotes
As housing prices have risen, there have been increasing anecdotes and commentary on ‘the bank of mum and dad’ helping FHBs onto the property ladder. See, for example, Davey (2016) and Wade (2016). [25]