RDP 2017-05: The Property Ladder after the Financial Crisis: The First Step is a Stretch but Those Who Make It Are Doing OK 4. How Much Debt Do FHBs Take on?
September 2017
In the previous section we found that the two strongest forces explaining whether a household becomes a first home buyer were demographics, particularly whether the household was headed by a couple, and housing prices. In this section we look at how much debt households have been taking on when they buy their first home to address the question of whether first home buyers have been taking on ‘too much’ debt given the increase in housing prices since the financial crisis.
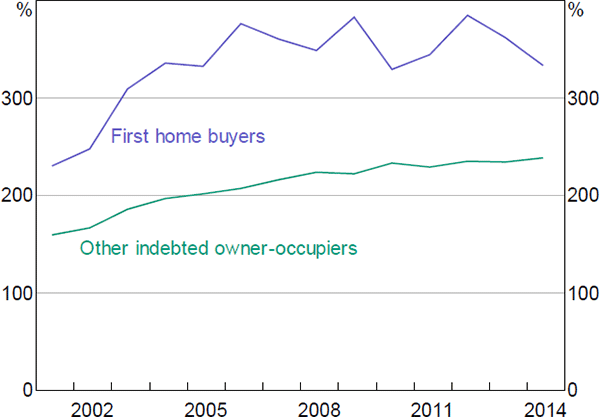
Turning first to the aggregated data, we can see in Figure 6 that the debt-to-income ratio of FHBs is substantially higher than that of all other indebted owner-occupiers. This reflects the fact that FHBs are at the beginning of their loan life cycle. That is, before they have had the opportunity to pay down their loan. Comparing the pre- and post-GFC periods, we see that the median FHB debt-to-income ratio was around 330 per cent in 2014, up approximately 40 per cent from the ratio of 230 per cent in 2001. FHBs are taking on more debt than in the past.
Note: Potential FHB households are defined as all renter households who are under the age of 60 years and have never owned a property
Sources: Authors' calculations; HILDA Survey Release 14.0
Comparing FHB loan characteristics in the pre- and post-financial crisis periods shows that these higher debt-to-income ratios reflect the fact that purchase prices have risen faster than incomes (Table 3). The median real purchase price of FHB homes in the 2008–14 period was $387,000, which was almost $100,000 higher than the price paid by FHBs in the 2001–07 period.
A consequence of higher purchase prices is that FHBs have had to save a much larger deposit despite maintaining a similar median loan-to-valuation ratio (LVR) of around 83 per cent. The median deposit size increased by around $28,000 to almost $70,000 in the 2008–14 period.[22] As a share of disposable income, the deposit size increased from 52 to 75 per cent between the two periods. This increase, together with a rise in the debt-servicing ratio (from 20 to 26), suggests that FHBs might be facing a higher financial burden in the post-financial crisis period.
| 2001–07 | 2008–14 | |
|---|---|---|
| Debt ($)(a) | 242,000 | 325,000 |
| Initial purchase price ($)(a) | 291,000 | 387,000 |
| Debt-to-disposable income ratio (%) | 314 | 357 |
| Loan-to-valuation ratio (%) | 83 | 83 |
| Size of deposit ($)(a) | 40,000 | 68,000 |
| Deposit as a share of disposable income (%) | 52 | 75 |
| Debt-servicing ratio (%) | 20 | 26 |
|
Note: (a) Reported in September 2014 dollars Sources: Authors' calculations; HILDA Survey Release 14.0 |
||
We next use regression analysis on a sample of FHBs only to better understand the factors that affect the level of debt-to-disposable income FHBs take on. In particular, given the suggestion that FHBs may now be overburdened in order to get on to the property ladder, we are interested in identifying if there has been any preference or behavioural change affecting the amount of debt FHBs take on since the financial crisis. To do this, we regress the initial debt-to-income ratio of FHBs on the log of state housing prices, an indicator variable for the post-2007 period, and controls for household- and aggregate-level characteristics. We specify the model:

where the dependent variable, DtYi , is the initial debt-to-disposable income ratio of FHB household i. The term Di is a post-2007 dummy variable that is equal to one if the year of purchase is greater than 2007. The vector of controls Xi includes household (age and age squared, household disposable income, couple household, household size, education, migrant status and employment status) and aggregate (state housing price index, state first home buyer government incentives, variable mortgage rates, urban area and state fixed effects) variables.
Table 4 shows the results of estimating Equation (2). Model 4 includes the post-2007 indicator and the set of household-level variables only. Model 5 adds in the state housing price index and the other aggregate-level variables. Model 6, our preferred model, corrects for the bias that can result in these regressions from the fact that the variables explaining the amount of debt taken on by FHBs also affect the probability of being an FHB.
We make this correction by using a two-stage Heckit procedure. This procedure introduces an additional variable, lambda (λ), that controls for the selection effect. A significant lambda is a sign that the selection effects are statistically significant. An additional aspect of the Heckit procedure is that it works best when at least one variable in the selection model is validly excluded from the second-stage regression. To improve the estimates we chose to exclude the age and age squared variables. More details on this procedure, including a discussion of the exclusion of the age variables, are provided in Appendix B.
| Model 4 | Model 5 | Model 6 | |
|---|---|---|---|
| Post-2007 dummy | 0.42*** | −0.49*** | −0.51*** |
| Age | 0.02 | 0.04 | na |
| Age squared | 0.00 | −0.00 | na |
| Household disposable income ($'000) | −0.00** | −0.00* | −0.00 |
| Couple household | −0.28** | −0.35*** | 0.26 |
| Household size | −0.12*** | −0.10*** | −0.20*** |
| Tertiary education | 0.15* | 0.01 | 0.28** |
| Migrant household | 0.12 | −0.02 | −0.11 |
| Full-time employee | 0.23* | 0.22* | 0.76*** |
| State housing price index (log) | na | 1.83*** | 1.41*** |
| First home buyer incentives ($'000) | na | 0.00 | 0.01 |
| Variable mortgage rate | na | −0.01 | −0.01 |
| Major urban area | na | 0.51*** | 0.37*** |
| Lambda | na | na | 0.78* |
| Constant | 3.43*** | −5.59*** | −5.30*** |
| State fixed effects | No | Yes | Yes |
| Observations | 1,077 | 1,077 | 1,077 |
| Adjusted R-squared | 0.15 | 0.27 | 0.27 |
|
Notes: Due to missing values of the dependent variable, 125 FHB household observations were dropped from the estimation sample; *, ** and *** indicate statistical significance at the 10, 5 and 1 per cent levels, respectively Sources: APM; Authors' calculations; HILDA Survey Release 14.0; RBA |
|||
Model 4 shows that, conditional on household-level characteristics, FHB debt-to-income ratios are on average higher than in the pre-2007 period. However, comparing Model 4 with Model 5 shows that adding in the aggregate-level variables accounts for much of the increase in the average FHB debt-to-income ratio between the two periods. Although the post-2007 dummy remains statistically significant, the sign on this variable is now negative. Housing prices appear to account for most of this change, suggesting they have driven the rise in the FHB debt-to-income ratio between the two periods.
Focusing on our preferred estimates in Model 6 confirms that housing prices have been the main determinant of the higher FHB debt-to-income ratio. Based on the coefficient on log state housing prices, a 10 per cent increase in housing prices raises the debt-to-income ratio of FHBs by around 14 percentage points. For the nation as a whole, housing prices increased by around 48.6 per cent between the two periods. This implies an increase in the average FHB debt-to-income ratio resulting from higher housing prices of around 56 percentage points (ln(1.486) × 1.414).
This increase, however, is larger than the observed rise in the debt-to-income ratio, which increased by 31 percentage points (period average on period average). This can partly be explained by the negative coefficient on the post-2007 dummy. This indicates that there has been a reduction in the debt levels of FHB households after controlling for all other included explanators. The two most obvious causes would be an exogenous change in the debt that financial institutions are willing to lend to households or a preference shift in the amount of debt that these households are willing to take on. However, separating these two influences is difficult and not necessary for the purposes of this paper. We leave this question for others to consider.
One possible explanation for lower debt levels is that FHBs are buying homes that are cheaper, relative to average housing prices, than in the past. To check whether this has been happening we look at the median FHB home purchase price compared with the median for all housing. This has risen slightly from the 30th percentile to the 32nd percentile since the financial crisis. As such, there is no prima facie evidence that FHB households have been buying relatively cheaper homes since the financial crisis.
Finally, compositional change in the pool of FHBs accounts for some increase between the periods. For example, there has been a rise in the proportion of FHBs with tertiary education and full-time employment (see Table 1) and these are both strongly associated with higher debt-to-income borrowing ratios. On average, having tertiary education and being in full-time employment increase the debt-to-income ratio of FHBs by around 28 and 76 percentage points, respectively.
Interpreting the net effect of these changes on financial fragility is, however, difficult. While the apparent preference shift away from intermediated debt and the increase in FHBs with tertiary education and full-time employment appears positive for financial resilience, the fact that overall debt levels are higher leaves open the possibility that the net effect could still be negative. To get a better handle on the net effect we next look at the post-purchase behaviour and financial fragility of these households.
Footnote
The deposit size is inferred from the difference between the reported purchase price and mortgage. Transaction costs, such as stamp duty, would add to the calculated deposit sizes reported in Table 3. To the extent that these have tended to increase as housing prices have increased, including these costs would increase the size of the required deposit and the change between periods. [22]