RDP 2014-04: Home Price Beliefs in Australia 8. Robustness Tests
May 2014 – ISSN 1320-7229 (Print), ISSN 1448-5109 (Online)
- Download the Paper 801KB
A condition for consistent estimation of the home valuation differences in our benchmark model is that any omitted housing characteristics in the hedonic models (for example, the number of bathrooms) should not have differential effects on market prices as compared with self-assessed values. To determine the extent to which our main results are robust to such omitted variables we construct the valuation differences using an alternative repeat-sales methodology. This is a useful alternative as time-invariant characteristics are differenced out of the regression model, reducing the potential for omitted characteristics to induce bias.
Specifically, we estimate the following model for sales prices:
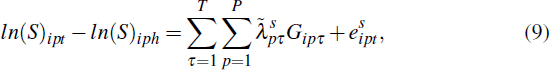
where h < t and Gipτ is a dummy equal to 1 for home i in postcode p in the period that resale occurs (i.e. if τ = t); −1 for home i in postcode p in the period the previous sale occurred (i.e. if τ = h); and 0 otherwise. Similarly, the model for self-assessed home values is:
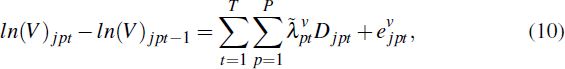
where Djpt is a dummy equal to 1 for self-assessed home j in postcode-time pt.
Comparing estimates of with
with  provides home valuation differences on the growth in home values, which
we refer to as
Θpt .[12]
provides home valuation differences on the growth in home values, which
we refer to as
Θpt .[12]
The determinants of the valuation differences can then be re-estimated accordingly,

with the results provided in Table 5 and compared with a first-differenced version of Equation (6).[13]
| Least squares | Feasible generalised least squares | ||||
|---|---|---|---|---|---|
| Hedonic | Repeat-sales | Hedonic | Repeat-sales | ||
| Δ Age | 0.022*** | 0.007* | 0.019*** | 0.007** | |
| Δ Age2 | −0.0002*** | −0.0001 | −0.0002*** | −0.0001** | |
| Δ Tenure | −0.007* | −0.010*** | −0.005* | −0.010*** | |
| Δ Tenure2 | 0.0001 | 0.0001*** | 0.0001** | 0.0001*** | |
| Δ Log income | 0.012 | −0.016 | 0.004 | −0.005 | |
| Δ Unemployment | −0.021*** | −0.003 | −0.025*** | −0.005 | |
| Δ Education | −0.002 | 0.006 | 0.016 | 0.004 | |
| R2 | 0.030 | 0.016 | |||
| Observations | 2,122 | 1,948 | 2,095 | 1,919 | |
|
Notes: Where necessary, robust standard errors clustered at the postcode level; ***, ** and * indicate significance at the 1, 5 and 10 per cent level, respectively Sources: APM; HILDA Release 11.0; authors' calculations |
|||||
Across both models, we find similar results to those presented in Section 6. Namely, the change in home valuation differences is positively associated with the change in age and negatively associated with the change in tenure and the regional unemployment rate, although the unemployment rate effect is now insignificant. We do not observe any statistically significant association between the home valuation differences and income or education.
Our results regarding financial decisions and home valuation differences can be checked in a similar way. Specifically, Equations (7) and (8) can be re-estimated in first differences. The results are provided in Table 6.[14]
| Least squares | Feasible generalised least squares | |||
|---|---|---|---|---|
| ΔSPENDINGpt | ||||
| Δ Self-assessed home values | 0.177 | 0.169*** | ||
| Δ Sale prices | 0.304** | 0.235* | ||
| Δ Valuation difference (ppt) | 0.165 | 0.162*** | ||
| ΔHDEBTpt | ||||
| Δ Self-assessed home values | 0.341** | 0.338** | ||
| Δ Sale prices | 0.645*** | 0.521** | ||
| Δ Valuation difference (ppt) | 0.271* | 0.283** | ||
| Δ Time fixed effects | Yes | Yes | Yes | Yes |
|
Notes: Where necessary, bootstrapped robust standard errors clustered at the postcode level; ***, ** and * indicate significance at the 1, 5 and 10 per cent level, respectively; the dependent variables SPENDINGpt and HDEBTpt are in log levels; the SPENDINGpt regression is estimated over the period 2006 to 2011, for which there was comprehensive expenditure data; the HDEBTpt regression is estimated over the period 2002 to 2011 Sources: APM; HILDA Release 11.0; authors' calculations |
||||
For postcode-level spending, the positive coefficient on self-assessed home values (column 3, block 1) again indicates that household spending and self-assessed home values are positively correlated. And, again, we find that the positive wealth effect reflects two factors: higher market values are associated with more spending and greater overvaluation is associated with more spending. But, this effect is smaller than the comparable results presented in Section 7. Likewise, for the level of housing debt, we find similar results to those presented earlier; the change in home valuation differences is positively associated with the change in housing debt (column 4, block 2).
Footnotes
The drawback with using the repeat-sales methodology is that we cannot estimate the valuation differences in levels, but only in growth rates. [12]
There is serial correlation in the error term (Δεpt). Accordingly, in columns 1 and 2, robust standard errors are clustered at the postcode level, which accounts for this. We also report feasible generalised least squares that produce asymptotically more efficient (though possibly biased) estimates (Woolridge 2002) in columns 3 and 4. [13]
We do not report results for DEBTpt , FINSHAREpt and EQSHAREpt because these dependent variables are only available in HILDA wealth module years 2002, 2006 and 2010. As such, first differencing only yields two time periods to examine: 2006 and 2010. [14]