RDP 9801: Labour Market Adjustment: Evidence on Interstate Labour Mobility 3. Stylised Facts of the State Labour Markets
February 1998
- Download the Paper 314KB
In this section we present some stylised facts about the relative performances of the state labour markets over the past 20 years. Figure 1 shows the relative unemployment performance of the states over the past two decades. The grey line plots the unemployment rate of the state, and the black line the national unemployment rate.
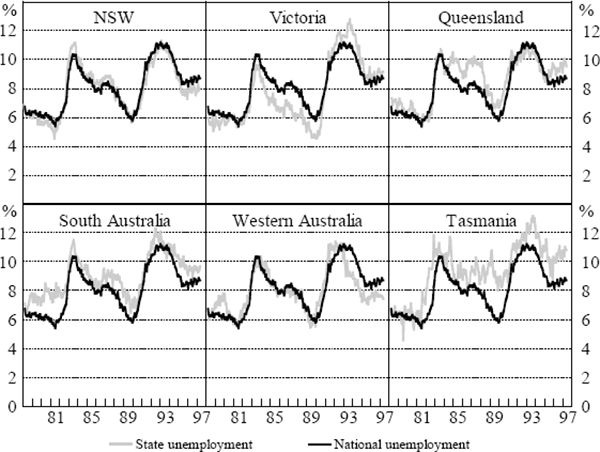
The panels show that the unemployment performance of the states has varied both in comparison with each other and through time. Nevertheless, most of the movement in state unemployment rates can be explained by variation in the national rate. As evidence of this, the coefficient of determination (R2) between the state and national unemployment rates is generally high, varying between 0.75 (for Western Australia and Tasmania) and 0.9 (in the cases of New South Wales and South Australia). That is, at least three-quarters of the variation in a state's unemployment rate is attributable to variations in national unemployment. Groenewold (1990) finds that the variation in unemployment rates between states compared to the national unemployment rate can be partially, although not entirely, explained by the different sensitivities of states to the business cycle.
We now turn to a more detailed examination of the state unemployment rates. The unemployment rate in New South Wales has generally fluctuated in a relatively narrow range around the national average. In the 1980s, the unemployment rate in Victoria was considerably below the national average by as much as 2 percentage points; however, Victoria was particularly hard hit by the recession in the early 1990s. The unemployment rate in Western Australia was similar to the national rate through much of the 1980s, but fell considerably faster than the national average during the recent recovery. In both South Australia and Tasmania, unemployment rates have remained persistently higher than the national average. The unemployment rate in Tasmania has averaged around 1.3 percentage points above the national average over the past 20 years. The ACT enjoyed low unemployment rates throughout the 1980s, and due to high levels of public sector employment was less affected by the recession than any other state or territory. However, public sector downsizing has seen an increase in the unemployment rate in recent years. The Northern Territory also experienced lower than average unemployment rates over most of the sample period.
Queensland has had a high unemployment rate relative to the national rate in recent years. However, a different perspective is gained when we examine the relative employment performance of the states (Figure 2). The panels show the share of national employment in each state. The scales have been adjusted to reflect differences in population size.
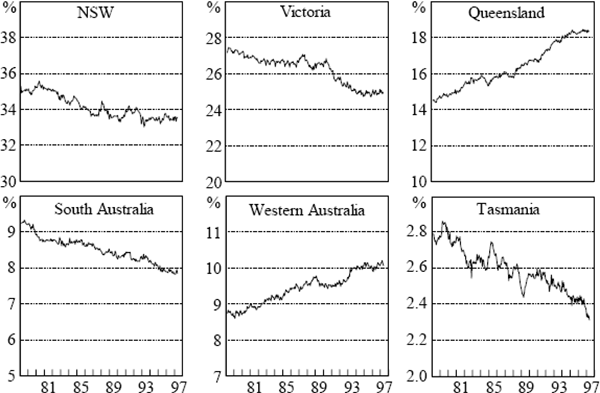
The rise in the employment share of Queensland over the past two decades is particularly noticeable. The Queensland labour market has absorbed a large amount of labour over this time. The fact that it has not completely absorbed all the in-migration is one of the reasons for the relatively high unemployment rate in that state. Hagan and Mangan (1996) argue that this suggests that the in-migration experienced by Queensland reflects supply-side factors (at least in part). Also clearly evident in Figure 2 is the trend decline in the employment shares in South Australia and Tasmania.
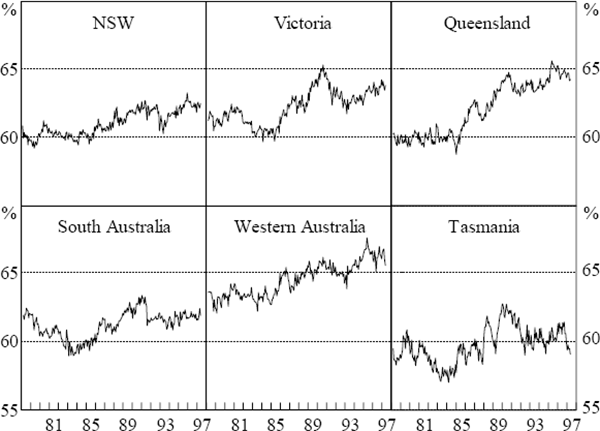
The trends in, and levels of, the participation rate also reflect these relative labour market performances (Figure 3). Participation rates in both Western Australia and Queensland, where employment growth has been strong, are significantly higher than the national average. Further, the participation rate in Queensland has been trending upward at a much faster rate than the national average (which has itself risen over the sample period). Participation rates in Tasmania, South Australia and New South Wales have been below the national average. Furthermore, the participation rates in Tasmania and South Australia have not risen over the sample period, reflecting the relatively poor employment opportunities in those states. The low participation rates in Tasmania and South Australia may also reflect a discouraged worker effect, and correspondingly a higher degree of hidden unemployment compared to other states.
There have been significant differences in the relative performances of the state labour markets following the 1991 recession, unlike the experience following the 1982/83 recession. Figure 4 shows the path of employment in the states following the two recessions. During the recovery after the 1982/83 recession, all the states experienced roughly the same growth in employment, although Western Australia and Queensland had slightly stronger employment growth than the other states.
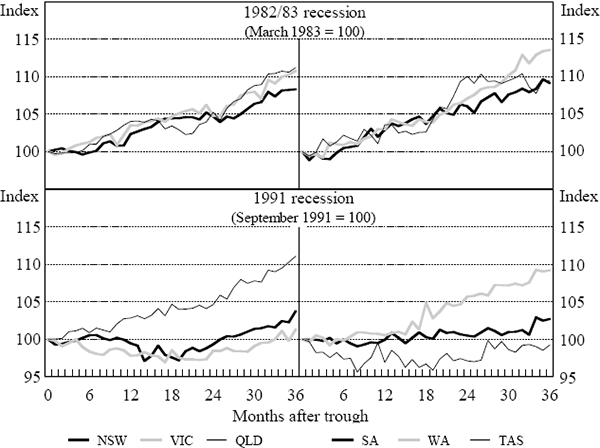
However, in the more recent recovery, employment growth in both Western Australia and Queensland has been considerably higher than in the other states, and the relatively weak employment performance in South Australia and Tasmania is also apparent. In Tasmania, employment levels are still only around those at the trough of the recession. The contrasting experiences following the two recessions suggest that migration has a larger role to play as an equilibrating mechanism in the current recovery than it has in the past.