RDP 9801: Labour Market Adjustment: Evidence on Interstate Labour Mobility Appendix A: Unit Root and Cointegration Tests
February 1998
- Download the Paper 314KB
Table A1 presents single equation tests of cointegration between state and national unemployment rates using the two step procedure suggested in Engle and Granger (1987). Table A2 applies the Johansen (1988) procedure to test for the number of cointegrating relations between the vector of state unemployment rates. Results from these tests are discussed in more detail in Section 4.
| State |
Engle-Granger test statistic: T(p−1) |
|---|---|
| New South Wales | −9.31 |
| Victoria | −5.06 |
| Queensland | −12.41* |
| South Australia | −35.07*** |
| Western Australia | −11.81* |
| Tasmania | −19.35*** |
| Northern Territory | −37.74*** |
| ACT | −42.25*** |
Note: ***, ** and * refer to significance at the 1%, 5% and 10% levels respectively. |
|
| H0:Rank of p | -T log (1−μ) |
95% critical value |
-TΣlog (1−μ) |
95% critical value |
|---|---|---|---|---|
| p = 0 | 66.8 | 51.4 | 224.9 | 156.0 |
| p ≤ 1 | 59.5 | 45.3 | 158.1 | 124.2 |
| p ≤ 2 | 36.4 | 39.4 | 98.6 | 94.2 |
| p ≤ 3 | 27.5 | 33.5 | 62.2 | 68.5 |
| p ≤ 4 | 15.0 | 27.1 | 34.8 | 47.2 |
| p ≤ 5 | 11.2 | 21.0 | 19.8 | 39.7 |
| p ≤ 6 | 4.7 | 14.1 | 8.5 | 15.4 |
| p ≤ 7 | 3.9 | 3.8 | 3.9 | 3.8 |
Table A3 presents stationarity tests on the variables in Section 5 of the paper. Unit root tests are conducted based on the methodology in Dickey and Fuller (1979, 1981).
| NSW | VIC | QLD | ||||
|---|---|---|---|---|---|---|
| T(p−1) | F-test | T(p−1) | F-test | T(p−1) | F-test | |
| Employment share (em) | −18.35* | 4.13 | −6.20 | 1.48 | −17.42 | 4.16 |
| Change in employment share (Δem) | −80.34*** | 19.05*** | −82.69*** | 19.29*** | −91.96*** | 12.64*** |
| Average weekly earnings (wage) | −26.71** | 4.91 | −11.17 | 2.34 | −27.39** | 6.14* |
| Change in average weekly earnings (Δwage) | −77.74*** | 17.52*** | −139.52*** | 31.23*** | −64.95*** | 14.89*** |
| Unemployment rate (ur) | −7.94 | 1.72 | −3.09 | 0.75 | −9.70 | 2.26 |
| Change in unemployment rate (Δur) | −73.69*** | 17.61*** | −70.42*** | 16.95*** | −72.20*** | 17.31*** |
| Participation rate (pr) | −15.06** | 3.58 | −17.58** | 4.38* | −0.58 | 5.49** |
| Change in participation rate (Δpr) | −921.67*** | 10.45*** | −111.89*** | 27.17*** | −20.36*** | 12.52*** |
| SA | WA | TAS | ||||
| T(p−1) | F-test | T(p−1) | F-test | T(p−1) | F-test | |
| Employment share (em) | −16.61 | 5.29 | −13.71 | 3.31 | −23.40** | 3.07 |
| Change in employment share (Δem) | −58.01*** | 13.72*** | −77.47*** | 19.23*** | −338.36*** | 11.66*** |
| Average weekly earnings (wage) | −7.13 | 1.54 | −32.36** | 5.24 | −48.86*** | 4.35 |
| Change in average weekly earnings (Δwage) | −92.77*** | 21.75*** | −105.20*** | 23.89*** | −99.93*** | 5.27 |
| Unemployment rate (ur) | −18.48** | 4.48* | −12.54* | 2.73 | −21.18*** | 5.27** |
| Change in unemployment rate (Δur) | −59.38*** | 10.24*** | −49.40*** | 12.20*** | −100.75*** | 24.09*** |
| Participation rate (pr) | −6.74 | 2.36 | −23.46*** | 5.52** | −13.42* | 2.83 |
| Change in participation rate (Δpr) | −76.09*** | 6.99*** | −101.73*** | 24.85*** | −120.89*** | 17.36*** |
| NT | ACT | |||||
| T(p−1) | F-test | T(p−1) | F-test | |||
| Employment share (em) | −20.41* | 6.30* | −6.15 | 1.38 | ||
| Change in employment share (Δem) | −98.47*** | 23.25*** | −70.83*** | 16.59*** | ||
| Average weekly earnings (wage) | −4.33 | 2.29 | −28.46*** | 5.13 | ||
| Change in average weekly earnings (Δwage) | −82.98*** | 19.16*** | −94.59*** | 22.75*** | ||
| Unemployment rate (ur) | −29.83*** | 7.01*** | −16.23** | 3.52 | ||
| Change in unemployment rate (Δur) | −425.17*** | 24.17*** | −48.30*** | 5.26** | ||
| Participation rate (pr) | −34.54*** | 7.90*** | −34.68*** | 6.14** | ||
| Change in participation rate (Δpr) | −184.78*** | 18.49*** | −390.70*** | 23.58*** | ||
Notes: ***, ** and * refer to significance at the 1%, 5% and 10%
levels respectively. |
||||||
The methodology of the panel unit root test is based on Im, Pesaran and Shin (1995). Their approach involves estimating an augmented Dickey-Fuller (ADF) regression for each variable and state, and comparing a statistic based on the average t-statistic on the lagged level variable against a critical value, to test the null hypothesis of a unit root. The authors present Monte-Carlo evidence which suggests this approach has good power in finite samples compared to alternative panel unit root tests.
The test employs the following test statistic (Im, Pesaran and Shin 1995, Equation 59 p. 16).
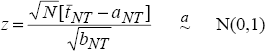
where N is the number of time series in the panel,  is the
average t-statistic from a series of univariate ADF tests on each variable (where the number of
lags in the regression is determined using the Schwarz criterion), and aNT
and bNT are the expected small sample mean and variance of the distribution
of t-statistics under the null hypothesis of non-stationarity (found through Monte-Carlo
simulation). This statistic is asymptotically distributed as a standard normal variable. The
appropriate hypothesis is a one-sided test of z = 0 against the alternative z
< 0.
is the
average t-statistic from a series of univariate ADF tests on each variable (where the number of
lags in the regression is determined using the Schwarz criterion), and aNT
and bNT are the expected small sample mean and variance of the distribution
of t-statistics under the null hypothesis of non-stationarity (found through Monte-Carlo
simulation). This statistic is asymptotically distributed as a standard normal variable. The
appropriate hypothesis is a one-sided test of z = 0 against the alternative z
< 0.
| Variable | z |
|---|---|
| Employment share (em) | −1.29* |
| Change in employment share (Δem) | −12.81*** |
| Wages (wage) | −1.60* |
| Change in wages (Δwage) | −13.97*** |
| Unemployment rate (ur) | −3.23*** |
| Change in unemployment rate (Δur) | −13.15*** |
| Participation rate (pr) | −3.66*** |
| Change in participation rate (Δpr) | −13.81*** |
Note: ***, ** and * refer to significance at the 1%, 5% and 10% levels respectively. |
|