RDP 9404: Wage Dispersion and Labour Market Institutions: A Cross Country Study 6. Empirical Analysis
June 1994
- Download the Paper 109KB
This section presents two measures of relative wage flexibility and draws conclusions from a cross-country comparison of these measures. Comparisons are drawn between wage dispersion and the degree of centralisation of a country's wage setting institution as defined in the existing literature in order to determine if decentralisation necessarily implies labour market flexibility. We analyse the relationships among sectoral wages, productivity, prices and growth using correlation and simple regression computations and examine the link between wages and employment. The section is concluded with an analysis of wage dispersion and several macroeconomic performance indicators.
6.1 Measuring Flexibility
We have chosen two summary statistics to be our quantitative measures of labour market flexibility. The statistics chosen enable comparison across countries and currencies; that is, scale effects have been removed. They are the variance of the logs of wages and the coefficient of variation of wages (the ratio of the standard error to the sample mean). Data are taken from the OECD National Accounts database, with the choice of countries determined by the availability of sectoral data.
Wages are calculated as the ratio of compensation of employees to the number of employees in each sector. Both data sets reflect full and part-time workers. Compensation of employees data is a national accounting concept which includes all payments made to labour. In the case of Australia, for example, both award and over-award payments are included in this wage measure.
Dispersion measures are constructed for both nominal wages and real product wages (the ratio of nominal wages to sectoral product deflators) and are presented in Appendix 1. There are no substantive differences among the series for the purposes of our analysis. For simplicity we focus on only one measure – the coefficient of variation of nominal wages.
The OECD data are broken down into ten main industrial sectors, and are on an annual basis. In some countries, certain sector data are amalgamated to achieve consistency across wages, employment and output measures. While highly disaggregated data would be desirable in this type of analysis, none is available on an internationally comparable basis, and our data at least capture inter-industry wage dispersion among the major sectors. See Appendix 2 for details. Certain sectors are more important (larger) than others in individual countries, and should therefore have greater influence on wage dispersion measures. In our measures, each sector is weighted by its share of total employment in that country. These weights (αij) are fixed over the sample period, and are the average employment share over that period.[8] Each sector's wage (Wijt) – is weighted and then summed to construct a weighted mean (WMjt) for each country in each time period (year):
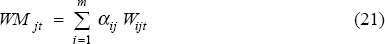
where i=1…m again refers to the industrial sector (m equals 10 in most cases) in country j=1…n. Squared deviations from this mean are then weighted before summing to form the weighted variance (WVjt):
The coefficient of variation measure (CVjt) of wage dispersion is then:

The variance of the logs measure of wage dispersion is simply WVjt from equation 22 where Wijt has been replaced by the log of Wijt (wijt) in equations 21 and 22. The removal of scale effects by dividing the standard deviation of wages by the mean level of wages can influence measured dispersion when large changes in the aggregate level of mean wages occur. For example if aggregate mean wages increase sharply in the absence of large increases in the deviations of industry wages from the mean, the coefficient of variation will fall sharply.
While each measure has been used previously in the literature on wage dispersion, neither is ideal in theory. Wage structures may change while wage dispersion, as measured by either statistic, remains fixed if, for example, high and low-wage sectors switch position. In practice this is not believed to be a problem. For example, Freeman (1988) found rank order to persist among sectoral wage relativities.
Another, more profound problem with the measures is that increases in wage differentials can occur independently of labour market flexibility. Without information on the underlying sector-specific demand and supply elasticities, the magnitude of changes in wage differentials expected of a flexible relative wage structure is difficult to predict. In other words, the optimal degree of wage dispersion depends on the dispersion of fundamentals, some of which are unobserved. The degree of labour mobility may be one of these fundamentals. High (low) labour mobility may be associated with low (high) wage dispersion. However, by using the same sectors for the calculation of dispersion across countries the international comparability of the measures are enhanced. The fact that the results are drawn from calculations using data from industrialised countries over a similar time period implies that differences in labour mobility may be small. Nevertheless industrial structure and labour mobility will differ to some extent from one country to another and this will influence our results.
6.2 Wage Dispersion as a Measure of Institutional Structure
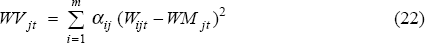
How does wage dispersion perform as an indicator of the degree of centralisation or decentralisation of wage setting institutions? Figure 2 plots decadal averages of the coefficient of variation of nominal wages against the centralisation ranking of Calmfors and Driffill for the 1970s and 1980s as adapted by Dowrick (1993).[9] While some aspects of Calmfors and Driffill's quantitative ranking (based on the extent of inter-union and inter-employer cooperation in wage bargaining with the other side) has been challenged in the literature, it is a good general benchmark against which we can judge the performance of this quantitative measure.
As one might expect, the adapted index of Calmfors and Driffill shows that Australia was an intermediate country in terms of centralisation in the 1970s and moved towards the more centralised end of the scale in the 1980s. In level terms, Australian wage dispersion in the 1970s and 1980s was in the range of that of the United States, a country which is considered to have the most decentralised wage bargaining system among the industrialised countries. While direct comparisons of wage dispersion between countries are strictly valid only when labour mobility is identical in both countries, broad comparisons may still be acceptable for the reasons described in Section 6.1.
In overall terms, there is a negative relationship between the measure of wage dispersion and the Calmfors Driffill index of centralisation. The correlation coefficients between the two series for the 1970s and 1980s are −0.49 and −0.47 respectively. On the one hand, countries with relatively high levels of wage dispersion such as the US, Japan, and Australia in the 1980s cover the entire spectrum of decentralised to centralised institutions.[10] On the other hand, there is a grouping of countries with low wage dispersion around the centralised end of the institutional scale. We conclude that low wage dispersion can be associated with centralised wage setting institutions, but is not necessarily so. Australia recorded a relatively high degree of wage dispersion in the 1980s despite having a centralised wage setting system.
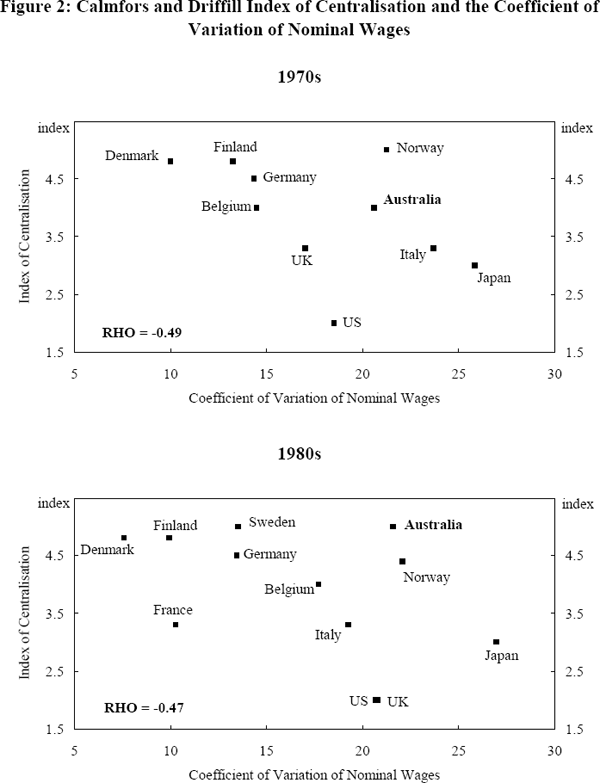
Decadal averages of wage dispersion mask some important changes in the profile of the measure, particularly in the case of Australia. Figure 3 illustrates the path of wage dispersion for Australia and other OECD countries over the periods for which data are available.[11]
Australian wage dispersion has varied widely over the period 1969 to 1990. There are three distinct periods characterised by different institutional developments. The first phase covers the end of the 1960s and first half of the 1970s and was characterised by sharp changes in wage dispersion and the erosion of the importance of the National Wage Case System. Between 1969/70 and 1974/75, the contribution of average male minimum wage increases specified under the national wage case system fell from 52.6 to 21.2 per cent (Hancock Report, 1985).
Consent agreements and over-award bargaining grew in importance and the arbitration system started to break down. Attempts were made by the Commission to regain control but these were unsuccessful. Wages increased in excess of the National Wage Case decisions even though, for example, the 1970 decision specified a 6 per cent increase when the inflation rate was only 3.9 per cent. By the end of the first quarter of 1975 average weekly earnings were increasing at an annual rate of about 28 per cent and inflation had accelerated to 17.7 per cent.
The erosion of the arbitration system had unpredictable effects on the level of wage dispersion. Between 1969 and 1972 the measure of wage dispersion increased sharply. This may have been a result of the breakdown of the national wage case system at a time when the labour market was tight. Over the period earnings in the lower wage sectors (community, social and personnel services, trade and agriculture) were increasing at a rate of about 10 per cent per annum while earnings in the higher wage sectors (financial and business services, general government, mining, construction, transport and utilities) were increasing at a rate of 15 per cent per year.
Between 1973 and 1975 the mean (weighted) wage increased at a rate of 24 per cent per annum. This large increase in the denominator of the coefficient of variation dominated the changes in the numerator (the weighted variance of wages) with the total effect being a sharp fall in the dispersion measure over the sub-period. During the sub-period wage dispersion was indeed falling (low and high wage sectors recorded 27 per cent and 20 per cent per annum increases respectively) but dispersion was not falling as rapidly as the coefficient of variation suggests. High nominal wage inflation had the same effect on the dispersion measures for Finland, Denmark and to a lesser extent, Italy. In the other OECD countries such as the US nominal wage inflation was not as significant. Nominal wages increased by about 8 per cent in the United States over the sub-period.
The second phase, between 1975 and 1983, was characterised by a mixture of full and partial indexation[12] until 1981, and a breakdown of indexation thereafter. A steady increase in wage dispersion was recorded over the period. The indexation guidelines permitted exceptional wage increases for change in work value. It also seems likely that the over-award and non-award sectors were able to gain from the erosion of the indexation system.
In 1980 and 1981 substantive wage increases were negotiated outside the indexation system and the indexation system was cancelled in July 1981. Economic conditions deteriorated towards the end of 1982[13] at which time a wages pause was introduced for workers covered by Federal awards. The wages pause lasted from December 1982 to until the introduction of the Accord in September 1983.
The start of the Accord marked the beginning of the third period. The Accord was associated with relatively little change in the level of dispersion until 1988 when institutional adjustments permitted a slight increase in wage dispersion.
How did changes in institutional structure affect wage dispersion in other countries (as illustrated in Figure 3)? Incomes policies were in place in the UK during the early 1970s; these may have contributed to the low level of wage dispersion. During the mid to late 1970s voluntary wage restraint programmes were adopted which may account for the upward drift of wage dispersion. It was the aim of the Thatcher Government, first elected in 1979, to reduce the power of the trade unions. Not surprisingly, wage dispersion drifted upwards during the Thatcher years.
The Scandinavian countries have had a history of highly coordinated wage negotiations. There is, however, a sharp contrast in the path of wage dispersion between Finland and Denmark on the one hand and Norway on the other over the ten year period starting in the mid 1960s. Norwegian wage dispersion remained relatively flat while that of Finland and Denmark fell conspicuously. The fall in wage dispersion in the latter two countries does not seem to be directly associated with any particular changes to their wage determination systems, but rather a combination of factors including differences in their wage indexation systems and the degree of influence of government in the process of income determination.[14] In Japan, the US, Germany, Belgium and France, no major changes were made to wage setting institutions over the periods for which data are available. There are nevertheless some changes in wage dispersion recorded in these countries.
We can conclude that wage dispersion appears to be affected by the type of wage setting institution but not in any strong systematic manner. Centralised wage setting systems may deliver flat or decreased wage dispersion and decentralised systems may induce increased dispersion. However, other variables which affect wage dispersion, including labour mobility, industrial structure and labour market policies (such as minimum wage legislation) may also play an important role, implying that countries which introduce policies to decentralise wage setting may not necessarily experience an increase in labour market flexibility.
6.3 The Relationships Among Wages, Productivity, Prices and Growth
A flexible labour market should be characterised by wage rates which adjust to conditions within the market. The model presented in Section 5 suggests that the real wage in any particular sector should reflect the sectoral productivity level and the relative price of that sector's output. In this section these relationships are analysed along with one further proposition; that sectoral wages should reflect the relative rate of growth of a sector. The idea is that above average wages are required to attract new workers to faster growing sectors.
We begin by calculating some simple correlation coefficients of nominal wages with productivity, prices and growth individually for each sector[15] in each country. While we know that high labour mobility may be associated with low wage dispersion and small deviations of productivity from its mean, the strength of the correlation coefficient between these variables will not be affected for the reasons which we describe in Section 5.
For this correlation analysis, wages, productivity and prices variables are constructed as relative deviations from the weighted mean for each sector. The wages variables (DWijt), for example, are constructed as follows:

The productivity and prices variables are relative deviations from the weighted mean of productivity and prices respectively. The growth variables are constructed as raw deviations from the weighted mean of annual output growth rates; that is, the deviations are not divided by the weighted mean as in equation 24.
Correlation coefficients are constructed for each sector, and are then weighted and summed to form an overall measure of the relationship in each country. The weights (αij) are again the average employment shares for each sector in each country.[16] The results of these weighted sums are set out in Table 1. They reveal a high degree of disparity across countries. Given that all countries have some degree of heterogeneous labour and imperfect labour mobility, we would expect the coefficients to all be positive in sign, but this is not the case. Wages appear to be positively related to productivity in the majority of countries. Australia has a relatively high positive correlation coefficient on productivity, with only Denmark, Germany, Italy and the United States having higher correlations.
| Period | Sectors | Productivity | Prices | Growth | |
|---|---|---|---|---|---|
| Australia | 1975–90 | 7 | 0.46 | −0.06 | −0.16 |
| Belgium | 1976–90 | 5 | −0.48 | 0.47 | 0.07 |
| Denmark | 1967–90 | 7 | 0.78 | −0.68 | −0.03 |
| Finland | 1961–90 | 7 | 0.30 | 0.04 | 0.02 |
| France | 1978–87 | 7 | −0.30 | 0.11 | −0.30 |
| Germany | 1970–89 | 7 | 0.63 | 0.25 | −0.01 |
| Iceland | 1974–89 | 6 | 0.00 | 0.43 | 0.03 |
| Italy | 1971–90 | 6 | 0.61 | −0.47 | 0.19 |
| Japan | 1970–90 | 7 | 0.36 | −0.08 | 0.22 |
| Luxembourg | 1975–90 | 7 | 0.22 | −0.08 | −0.34 |
| Norway | 1963–90 | 7 | −0.20 | 0.49 | −0.17 |
| Sweden | 1980–90 | 7 | 0.36 | −0.19 | 0.52 |
| United States | 1961–87 | 7 | 0.77 | −0.57 | −0.04 |
| MEAN | 0.27 | −0.03 | 0.00 | ||
| MEDIAN | 0.36 | −0.06 | −0.01 |
The results for the correlations between wages and prices, and between wages and growth, are more diverse. The averages over all countries are more or less zero in both cases. For the price variable, its effect on wages may depend on movements in productivity. Increases in productivity may lead to lower output prices, and if wages reflect changes in productivity (as they appear to), a negative relationship between wages and prices may result. Therefore, changes in productivity must be taken into account when attempting to determine the relationship between wages and prices.
The weak overall relationship between wages and growth may reflect the influence of the growing wholesale and retail trade, restaurants and hotels sector. This sector has been growing in employment share in most developed countries. This growth has been generally characterised by increased part-time employment, which may dampen the growth in the wage variable constructed for this analysis. As noted above, the wage rate is calculated as compensation of employees per employee, which may fall as the share of part-time employees rises. The portion of the service sector employing low skilled workers has also tended to have low relative wages and minimal relative wage increases.[17]
To account for the effect of productivity changes on the relationship between wages and prices, a simple regression analysis was conducted. Two models are estimated for each sector in each country: wages on prices and productivity (model 1), and wages on prices, productivity and growth (model 2). The same variables, sectors and sample period used in the correlation analysis are employed. The estimated coefficients are weighted by average employment shares and summed across sectors, and the results are presented in Table 2.[18]
|
Model 1 Coefficient on: Productivity |
Prices |
Model 2 Coefficient on: Productivity |
Prices | Growth | |
|---|---|---|---|---|---|
| Australia | 0.66 | 0.62 | 0.64 | 0.57 | −0.10 |
| Belgium | −0.77 | −0.66 | −0.73 | −0.63 | 0.19 |
| Denmark | 0.37 | 0.03 | 0.39 | 0.03 | −0.11 |
| Finland | 0.22 | 0.28 | 0.20 | 0.26 | 0.05 |
| France | −0.06 | 0.04 | −0.04 | 0.10 | −0.09 |
| Germany | 0.63 | 0.49 | 0.69 | 0.50 | −0.33 |
| Iceland | 0.22 | 0.28 | 0.25 | 0.29 | −0.02 |
| Italy | 0.63 | 0.32 | 0.75 | 0.31 | −0.08 |
| Japan | 0.17 | 0.17 | 0.18 | 0.18 | −0.03 |
| Luxembourg | 0.13 | 0.03 | 0.15 | 0.08 | −0.17 |
| Norway | −0.04 | 0.16 | −0.02 | 0.18 | 0.01 |
| Sweden | 0.46 | −0.09 | 0.74 | −0.09 | −0.10 |
| United States | 0.73 | 0.34 | 0.76 | 0.39 | −0.19 |
| MEAN | 0.26 | 0.15 | 0.30 | 0.17 | −0.08 |
| MEDIAN | 0.22 | 0.17 | 0.25 | 0.18 | −0.09 |
The findings here are closer to what might be expected. The coefficients on the prices and productivity variables are positive in the majority of cases. The coefficient on the growth term in model 2 is, however, negative in almost all cases.
This is likely a consequence of the growth of the wholesale and retail trade, restaurants and hotels sector. Alongside the United States, Australia has some of the highest coefficients on productivity and prices among the countries in our sample. This tends to suggest that over the period 1975 through 1990 Australian wage setting behaviour generally reflected key factors related to the demand for labour.
In terms of the relationship between the level of wage dispersion and the strength of the relationship among wages, productivity and prices generally, there does not appear to be anything systematic. Moreover, the relationship does not appear to be a function of the degree of centralisation of wage setting institutions. For example, Italy and Germany both recorded high coefficients along with the US and Australia. Sweden and Denmark recorded weak relationships between wages and prices but strong ones between wages and productivity. These countries display a wide variation in both wage dispersion and degree of centralisation. This would imply that an increase in wage dispersion and/or a move towards a less centralised system may not necessarily bring about a stronger response of wages to demand conditions.
6.4 The Relationship between Employment and Wages
One major benefit of having a wage setting system where remuneration reflects the demand conditions for labour is that wages can act as a signal to potential employees to move from one sector to another. Higher wages in the more productive and more profitable sectors will attract workers to those sectors where they are more highly valued. In this section, the relationship between deviations of employment and wages from their respective means is analysed. Correlation coefficients are calculated for employment with wages for each sector[19] in each country. Coefficients are again weighted and summed in the manner employed above. The results are set out in Table 3.
| Period | Sectors | Employment | |
|---|---|---|---|
| Australia | 1969–90 | 10 | −0.17 |
| Belgium | 1976–90 | 8 | 0.29 |
| Denmark | 1967–90 | 10 | 0.27 |
| Finland | 1961–90 | 10 | −0.17 |
| France | 1978–87 | 9 | −0.21 |
| Germany | 1970–89 | 9 | 0.38 |
| Iceland | 1974–89 | 9 | −0.17 |
| Italy | 1971–90 | 8 | −0.08 |
| Japan | 1971–90 | 10 | 0.15 |
| Luxembourg | 1976–90 | 9 | −0.33 |
| Norway | 1963–90 | 10 | −0.25 |
| Sweden | 1981–90 | 10 | 0.49 |
| United Kingdom | 1972–87 | 10 | 0.22 |
| United States | 1961–87 | 10 | −0.14 |
| MEAN | 0.02 | ||
| MEDIAN | −0.14 |
The average across countries suggests that there is little systematic relationship between employment and wages. The correlation is negative for Australia. Apart from the potentially positive effect of wages on employment described above, theremay be other supply or demand influences. As workers move out of one sector and into another, changes in the supply of labour in each sector may raise wages in the former sector, and depress them in the latter. Changes in participation rates may also confound the relationship. For example, increased participation of women in sectors associated with relatively low wages may affect the relationship. On average, neither supply nor demand factors appear to dominate, implying that firm conclusions cannot be drawn from this analysis.
6.5 The Relationships Among Wage Dispersion and Various Macroeconomic Performance Indicators
Does higher wage dispersion imply higher relative growth and/or lower relative inflation and unemployment? Figures 4 through 6 illustrate the relationships between wage dispersion and these three measures of macroeconomic performance. In an effort to capture the effects that the Wages and Incomes Accord might have had on wage dispersion in Australia, the data are split into two periods to reflect the pre and post-Accord periods.
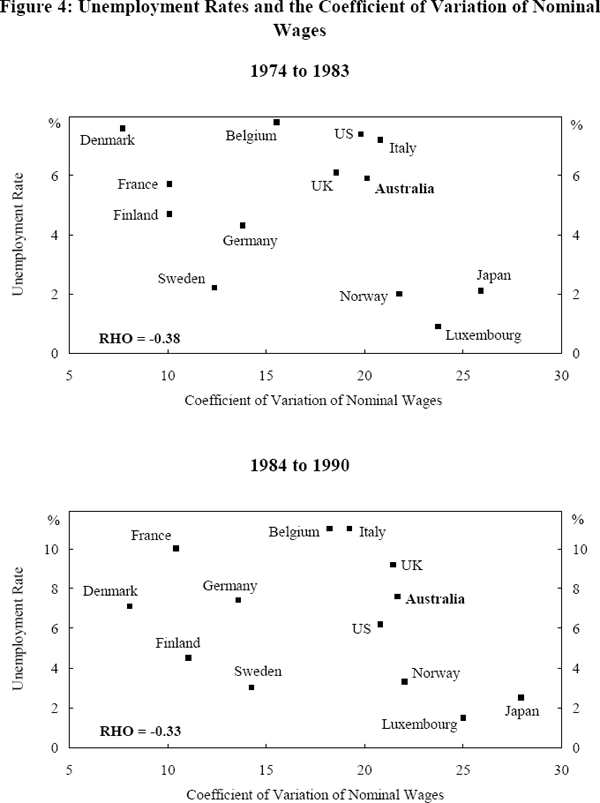
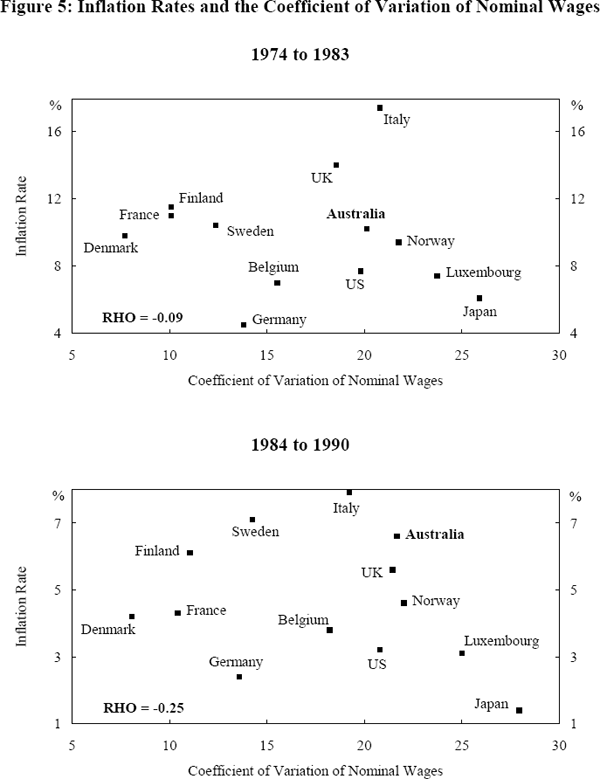
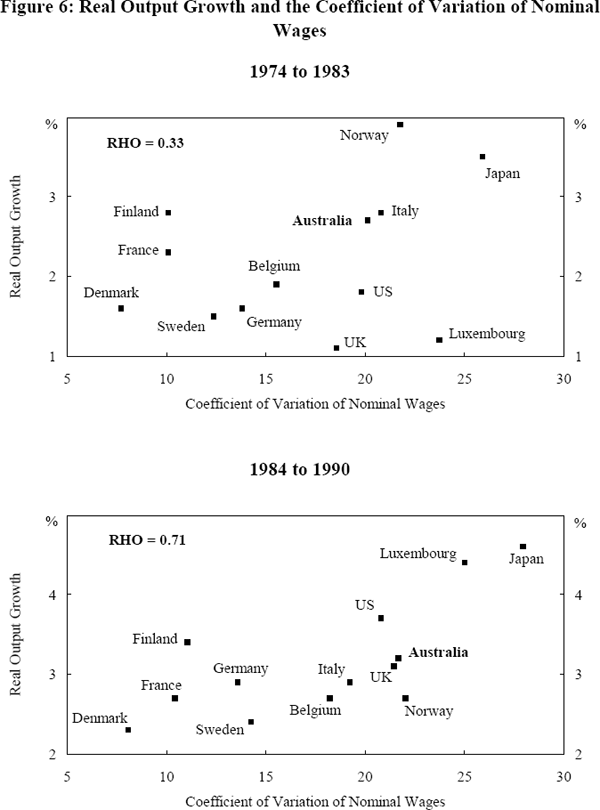
Relative to most other countries, wage dispersion in Australia was higher during both periods while Australian unemployment and inflation performance was relatively worse in many cases. In terms of growth, Australia performed relatively better than the majority of other countries during both periods. In absolute terms, wage dispersion in Australia increased marginally from the pre to the post-Accord period while unemployment and growth increased and inflation fell.[20] In overall terms, neither relatively high wage dispersion in Australia across periods nor across countries translated into a consistently better macroeconomic performance.
More generally, our data set suggests that there is no consistently reliable relationship between relative wage dispersion and economic performance. While a positive linear relationship between wage dispersion and output growth is apparent in the 1984–90 period (Figure 6), this relationship is not reliable given its relative weakness during the 1974–83 period. The low correlation coefficients between wage dispersion and unemployment during the two periods on the one hand and between dispersion and inflation on the other imply that there is no strong systematic relationship between these variables. It appears that a country's macroeconomic performance is not obviously related to its wage setting institutions in either a linear or other (say hump shaped) fashion.
Footnotes
Due to the limited availability of data for each country, the measures are constructed over different sample periods in many cases (see Appendix 2). [8]
While Calmfors and Driffill's original analysis referred to institutional arrangements during the period 1973–85 only, Dowrick (1993) adapted the original indices to reflect decadal averages in the 1970s and 1980s. [9]
As noted above, there has been a debate in the literature about where Japan should appear on the centralisation scale, with Soskice (1990) arguing that Calmfors and Driffill incorrectly identified Japan as a decentralised system when in fact a high degree of coordination is in evidence. Dowrick constructed an alternative index to reflect Sockice's critique. Under Dowrick's alternative measure, Japan would be ranked as a country with highly centralised wage setting system (the index of centralisation on the vertical axis in Figure 2 would be 6 instead of 3). This would still support our conclusion that highly coordinated wage setting institutions do not necessarily have low wage dispersion. [10]
While the measure of dispersion in Figure 3 is the coefficient of variation of nominal wages, equivalent figures using the variance of the logs of nominal and real product wages and the coefficient of variation of real product wages can be found in Appendix 1. While the real product wage versions have higher variances, the overall pattern of wage dispersion is similar. We have chosen to discuss the nominal wage version in the main body of our text given it has a longer series available for Australia. (In addition, UK data are available only in the nominal series.) [11]
Only some decisions by the Arbitration Commission provided full indexation; other decisions permitted adjustment of less than consumer price increases. Wages were adjusted on a quarterly basis from March 1975 until September 1978. Between 1978 and 1981 wages were adjusted on a six monthly basis. [12]
The inflation rate exceeded eleven per cent and in November 1982, unemployment approached nine per cent. [13]
See Braun (1986) for a fuller exposition of the background factors. [14]
Three of the sectors used in the last section were removed before conducting the correlation analysis. These sectors are general government; community, social and personnel services; and finance, insurance, real estate and business services. The real output data for these sectors are constructed on an assumption of no labour productivity growth, and are therefore unsuitable for this analysis. [15]
These shares were calculated using the total of employment for the seven (or less) productive sectors used in this part of the analysis only. [16]
The growth in employment in this portion of the services sector is linked to the phenomenon of the growing class of the “working poor” in many industrialised countries. [17]
Since the weighted average of standard errors makes no sense they are not reported. [18]
The three sectors removed from the analysis in the previous section (namely general government, community, social and personnel servicesand finance, insurance, real estate and business services) have been included in the analysis here, as real output data are not employed. [19]
It might seem curious that higher growth was coincident with a poorer unemployment performance in the second period, but this was an experience common to most of the countries for which we have data. [20]