RDP 9210: Contingent Claim Analysis of Risk-Based Capital Standards for Banks 4. The Basle Standards
September 1992
- Download the Paper 510KB
In this section, we develop a simple representation of the Basle standards, and compare it to the LV and FP risk-based capital rules analysed above. On the surface, the Basle risk-based capital standards bear little resemblance to either an LV rule or an FP rule. The Basle standards express the minimum capital ratio not as a function of the standard deviation of asset returns but as a predetermined fraction of a weighted sum of assets. Weighted assets are calculated by applying “risk weights” to the dollar value of various types of assets, with the weights ranging from zero to one. Thus, required capital is a linear function of the quantities of assets in different risk categories, and the required capital-to-assets ratio is linear in the proportions of assets in each category.
Nevertheless, a simplified version of the Basle standards can be represented in the (σ,c) plane. Assume that there are only two classes of assets, riskless and risky. Let η be the proportion of risky assets within the bank's total asset portfolio; that is, the bank holds ηV dollars of risky assets and (1−η)V of riskless assets. Letting w1 and w0 be the risk weights applied to risky and riskless assets respectively, the weighted asset base is calculated as W1ηV + w0(1−η)V; if crb is the risk-based capital ratio (the minimum ratio of capital to risk-weighted assets), the bank must satisfy the constraint:

Dividing (16) by V to express the constraint in terms of the capital-to-assets ratio, and collecting terms, the minimum capital ratio for a bank with fraction η in risky assets is:

Thus, a Basle-type standard is linear in the fraction η invested in risky assets.[9]
The minimum capital ratio in (17) also can be expressed in terms of σ. Since
asset risk for the bank is proportional to the fraction of investment in risky assets, we have
 , where
 denotes
the standard deviation of returns to risky assets. (In this formulation, σ
depends on the bank's choice of η, whereas is
determined by market forces.) Substituting
denotes
the standard deviation of returns to risky assets. (In this formulation, σ
depends on the bank's choice of η, whereas is
determined by market forces.) Substituting  into expression (17),
the Basle capital standards restrict the bank's choices to lie on or above the locus:
into expression (17),
the Basle capital standards restrict the bank's choices to lie on or above the locus:
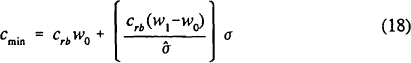
The capital ratio constraint is linear in asset risk σ, and plots as a straight
line with slope  in the (σ,c) plane.
4.1 Linear Forms as Simple Approximations
The linear Basle-type standard in (17) clearly is not equivalent to either an LV standard or an FP standard. Under LV or FP rules, the required capital ratio (defined implicitly by the equations LV(σ,c)=LV0 or FP(σ,c)=FP0) is a nonlinear function of σ. Nevertheless, the constant LV and FP loci shown in Figures 1 and 2 are nearly linear, which suggests that a simpler Basle-type standard could serve as a good approximation to either regulatory rule. A less complex capital standard might well be desirable, since simplicity would reduce the costs of implementation, enforcement, and compliance.
To develop a suitable approximation, let c(σ) represent the minimum capital ratio defined as an implicit function of asset risk, derived using either an LV rule or an FP rule. Assume that most banks choose asset portfolios with risk in the range [σ*,σ**], and that regulators apply a squared-loss criterion to derive values of w1 and w0 to fit cmin to c(σ) as well as is possible within that range. That is, regulators choose w1 and w0 to minimise the loss function:
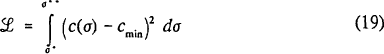
Minimising ℒ corresponds to fitting a cmin line to a locus of c(σ) values.
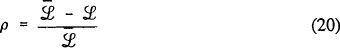
An indication of how well the linear risk-based capital schedule approximates either an LV or FP locus can be derived from the loss function ℒ as defined in equation (19). We define the quantity ρ as:
where
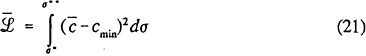
and  is
the mean of the required capital ratio within the range [σ*,σ**]:
is
the mean of the required capital ratio within the range [σ*,σ**]:
Note that ρ = 0 if  (the linear capital standard yields
no improvement over simply setting the minimum capital ratio equal to
for all banks), ρ = 1 if ℒ = 0 (the linear standard fits the target LV or FP
locus perfectly), and values of ρ between zero and one represent intermediate
degrees of fit. Thus ρ is a “goodness of fit” measure analogous to the
R2 statistic conventionally reported in regression analysis.[10]
(the linear capital standard yields
no improvement over simply setting the minimum capital ratio equal to
for all banks), ρ = 1 if ℒ = 0 (the linear standard fits the target LV or FP
locus perfectly), and values of ρ between zero and one represent intermediate
degrees of fit. Thus ρ is a “goodness of fit” measure analogous to the
R2 statistic conventionally reported in regression analysis.[10]
What are realistic values of  , and σ**?
Under the Basle standards equity capital must be at least four percent of risk-weighted assets,
implying crb=0.04. We measure time in years and set T=1,
corresponding to a one-year monitoring interval. (We discuss the importance of this assumption
in subsection 4.5 below.)
, and σ**?
Under the Basle standards equity capital must be at least four percent of risk-weighted assets,
implying crb=0.04. We measure time in years and set T=1,
corresponding to a one-year monitoring interval. (We discuss the importance of this assumption
in subsection 4.5 below.)
Selecting values for the standard deviation of returns on risky assets and the
range [σ*,σ**] is more complicated. In an analysis of the
Australian banking sector using contingent claim methods, Gizycki and Levonian (1992) find that
the standard deviation has generally been in the range of 0.02 to 0.03 since 1983, but for brief
periods has been above 0.05 and as low as 0.01. A number of studies based on U.S. data find
values around 0.03, and thus are consistent with the Australian results. However, if
deregulation of the banking sector continues, banks may begin to engage in a wider and perhaps
riskier range of financial activities, possibly increasing the relevant upper bound on risk.
Accordingly, we consider values of equal to 0.03, 0.05, and 0.10.
We consider four combinations we believe cover a range of interest for policy purposes; in each
case we set the upper limit  . The first case, with
σ*=0.01 and σ**=0.03, corresponds to the
average levels of asset risk observed by Gizycki and Levonian for the Australian banking sector.
In the second case we again set the lower limit σ*=0.01, but let
σ**=0.05, corresponding to a slightly wider range of risks that covers
most of the range found by Gizycki and Levonian. The third and fourth combinations we interpret
as representing environments in which banks can engage in much riskier activities; in both
cases.
(and hence σ**) is equal to 0.10. In the third case the bottom end is
σ*=0.05, so most banks have high operating risk, whereas in the fourth
case σ*=0.01, implying that banks cover a spectrum ranging from very
low risk to very high risk.
. The first case, with
σ*=0.01 and σ**=0.03, corresponds to the
average levels of asset risk observed by Gizycki and Levonian for the Australian banking sector.
In the second case we again set the lower limit σ*=0.01, but let
σ**=0.05, corresponding to a slightly wider range of risks that covers
most of the range found by Gizycki and Levonian. The third and fourth combinations we interpret
as representing environments in which banks can engage in much riskier activities; in both
cases.
(and hence σ**) is equal to 0.10. In the third case the bottom end is
σ*=0.05, so most banks have high operating risk, whereas in the fourth
case σ*=0.01, implying that banks cover a spectrum ranging from very
low risk to very high risk.
4.2 Fitting an LV Rule
Table 1 presents the results of minimising the loss function ℒ to fit a linear approximation to LV capital standards.[11] Three different liability values were used: 0.1 percent of deposits, 0.2 percent of deposits, and 0.3 percent of deposits. Each column of the table presents the results for one of the four combinations of (σ*,σ**). One striking implication of Table 1 is that a linear risk-based capital schedule may provide a good approximation to an LV rule; the goodness-of-fit statistic (ρ) is above .995 in every case. A true LV standard would produce only a slight improvement in fit, at substantial cost in terms of complexity.
| 1%<σ<3% | 1%<σ<5% | 5%<σ<10% | 1%<σ<10% | ||
|---|---|---|---|---|---|
| LV=0.1% | w1 | 1.4807 | 2.5271 | 5.4011 | 5.1579 |
| w0 | −0.2137 | −0.2702 | −0.4598 | −0.3557 | |
| ρ | 0.999151 | 0.999002 | 0.999998 | 0.999448 | |
| LV=0.2% | w1 | 1.3136 | 2.2628 | 5.0863 | 4.7143 |
| w0 | −0.2501 | −0.3175 | −0.5943 | −0.4343 | |
| ρ | 0.998400 | 0.998080 | 0.999966 | 0.998677 | |
| LV=0.3% | w1 | 1.2124 | 2.0995 | 4.8852 | 4.4345 |
| w0 | −0.2777 | −0.3518 | −0.6819 | −0.4879 | |
| ρ | 0.997577 | 0.997116 | 0.999917 | 0.997866 | |
The results for w1 in Table 1 indicate that risky assets should be given a weight of well over 100 percent. This stands in contrast to the 100 percent maximum risk weight under the Basle standards. In the case in which bank risk is low (1%<σ<3%) and the acceptable LV is high, the optimal risk weight on risky assets would still be about 121 percent. If regulators require lower values of the deposit guarantee liability, or if the relevant range of risk for banks is high, then w1 must be much larger, up to 540 percent in the case of LV=0.1% and 5%<σ<10%.[12]
Table 1 also indicates that riskless assets should receive a fairly large negative weight; w0 is less than zero in all cases, ranging from about −20 percent to −50 percent. Negative weights would mean that banks could reduce their measured total risk-weighted assets by some fraction of their holdings of riskless assets. This would be a significant departure from the Basle standards, which assign a zero risk weight to riskless assets.[13] The largest negative weights correspond to the cases in which assets are very risky; in these cases, a constant value of the deposit guarantee liability can only be maintained by providing very strong encouragement for banks to hold riskless assets. The w0 weight is more strongly negative if authorities are willing to tolerate higher LV values, which seems counterintuitive. However, note that in these cases the weight on risky assets also is much lower; as a result, the differential between w1 and w0 actually decreases, implying that banks receive less relative reward for holding riskless assets rather than risky assets.
4.3 Fitting an FP Rule
Table 2 presents the weights resulting from minimising ℒ to construct a linear approximation to FP capital standards. Three different probabilities of bank failure are presented: 5 percent, 10 percent, and 15 percent. As in Table 1, each column presents the results for one of the four combinations of σ* and σ**. The very high values of ρ (in every case ρ exceeds .999) demonstrate that a simple linear rule could be an extremely close approximation to a theoretically correct but more complicated capital standard. The fit is even better than for the LV rules in Table 1 because the FP loci have less curvature overall.
| 1%<σ<3% | 1%<σ<5% | 5%<σ<10% | 1%<σ<10% | ||
|---|---|---|---|---|---|
| FP=5% | w1 | 1.2002 | 1.9756 | 3.6736 | 3.8259 |
| w0 | 0.0078 | 0.0163 | 0.1164 | 0.0502 | |
| ρ | 0.999992 | 0.999968 | 0.999944 | 0.999830 | |
| FP=10% | w1 | 0.9482 | 1.5704 | 3.0227 | 3.0878 |
| w0 | 0.0030 | 0.0064 | 0.0490 | 0.0207 | |
| ρ | 0.999998 | 0.999992 | 0.999983 | 0.999952 | |
| FP=15% | w1 | 0.7754 | 1.2904 | 2.5516 | 2.5681 |
| w0 | 0.0005 | 0.0011 | 0.0116 | 0.0045 | |
| ρ | 0.999999 | 0.999999 | 0.999998 | 0.999996 | |
The calculated values for w1 indicate lower optimal weights on risky assets than were found in the LV case. For some of the cases, w1 is actually lower than the weight of 100 percent incorporated in the Basle standards. For example, if asset risk is believed to be relatively low so that the relevant range is 1%<σ<3%, and authorities are willing to tolerate failure probabilities in the neighbourhood of 10 percent or 15 percent, an optimal linear approximation calls for weights on risky assets of 95 percent or 78 percent respectively. However, as with an LV rule, w1 soars if a higher range of bank asset risk is used, to well over 300 percent in the cases where the lowest failure probabilities are desired.
In contrast to the LV results, under an FP rule the weight given to riskless assets should be positive, although in several cases w0 is extremely small. For the lower risk cases, w0 ranges from well under 1 percent to a little more than 1½ percent, fairly close to the Basle weight of zero. Only in the case where all banks are very risky (5%<σ<10%) and the probability of failure must be held to 5 percent does the weight on riskless assets rise above 10 percent; in all other cases, w0 is 5 percent or less.
Based on the results in Tables 1 and 2, we conclude that the Basle standards come closest to a linear approximation of an FP rule where a probability of bank failure of 10 percent is deemed acceptable, and banks are assumed to have asset risk in the range observed in studies of the U.S. banking industry. From Table 2, a best-fit linear approximation to an FP rule under these circumstances requires a weight on risky assets of 95 percent, very close to the 100 percent in the Basle Accord, and a weight on riskless assets of 0.3 percent, very close to Basle's zero weight. With those weights, a Basle-type standard approximates an FP rule extremely closely, as indicated by the high value of ρ.
4.4 Accommodating Restrictions on the Risk Weights
Outcomes reached through international negotiations may reflect considerations that are not strictly economic in nature. Thus there may be reasons to accommodate restrictions on some of the parameters of the capital standard. In the calculations presented above, we have taken as given the basic linear structure of the capital standards and the four percent minimum equity capital ratio. However, there may also be some need to accommodate existing risk weights to the extent possible.
Consider the case of maintaining a risk weight of zero on cash-equivalent assets. If the weight on riskless assets w0 is restricted to zero as under the Basle standards, the linear risk-based capital schedule in (18) becomes:
This is a line through the origin in the (σ,c) plane; as indicated in the discussion above, such a line corresponds more closely to an FP rule than an LV rule. Restricting w0 to zero and deriving w1 to fit a constant FP rule yields a linear approximation that is slightly steeper than the FP locus. For example, in the case of FP0=10 percent with crb=0.04 and 1%<σ<5%, the slope is 1.5768 when w0 is restricted to be zero, and is 1.5704 when the intercept is not restricted. (Based on the discussion in Section 3.3 above, the difference in slopes implies that an approximation with w0 set to zero is slightly less likely to lead banks to choose high asset risk portfolios than a true FP rule.) The fit to the FP standards is, of course, inferior to the results obtained when w0 is not restricted.
Alternatively, the Basle weights of w1=1 and w0=0 could be taken as binding restrictions, and the required minimum risk-based capital ratio adjusted to achieve an FP goal. Table 3 shows the results of such calculations, for FP rules with failure probabilities of 5, 10, and 15 percent. In view of the Table 2 results, it is not surprising that the cases in the lower left corner of the table yield values of crb close to the Basle standard of 4 percent. However, the minimum capital ratio must be raised if higher levels of banking risk need to be covered. For 1%<σ<5%, crb should be in the range of 5 percent to 8 percent; under the highest of the upper bounds on asset risk, capital ratios in the 10 to 15 percent range might be required.
| 1%<σ<3% | 1%<σ<5% | 5%<σ<10% | 1%<σ<10% | |
|---|---|---|---|---|
| FP=5% | 0.048 | 0.080 | 0.152 | 0.155 |
| FP=10% | 0.038 | 0.063 | 0.123 | 0.124 |
| FP=15% | 0.031 | 0.052 | 0.103 | 0.103 |
Another view of the implications of the standards follows from taking the Basle risk weights as given and determining the FP contour to which the Basle standard most closely corresponds. The results are shown in Table 4, for each of the four risk cases, and for risk-based capital ratios of 0.04 and 0.08. With crb=0.04, the implied upper bound on the probability of bank failure ranges from 9 percent in the lowest risk case to around 36 percent for the higher risk cases. Doubling the risk-based capital ratio to 0.08 reduces the failure probability to a trivial 0.3 percent for the low risk case, although it remains at levels above 20 percent for the highest risk cases.
| 1%<σ<3% | 1%<σ<5% | 5%<σ<10% | 1%<σ<10% | |
|---|---|---|---|---|
| crb=0.04 | 0.090 | 0.214 | 0.360 | 0.359 |
| crb=0.08 | 0.003 | 0.052 | 0.219 | 0.217 |
It is worth noting that bank supervisors in each country do retain some flexibility under the Basle agreement, especially with regard to the minimum risk-based capital ratio. The Basle standards set a floor; national authorities have the power to require banks to hold more capital, and many banks do in fact hold more than the minimum. The results in this section support this flexibility as a desirable aspect of the regulations; bank supervisors in each country can tailor the standards somewhat to the riskiness of the environment in which their banks operate.
4.5 The Effect of Alternative Assumptions Regarding T
All of the results presented above assume that the monitoring interval T is equal to one year. Obviously this is an arbitrary assumption, and its effect on the computations can be substantial. Straightforward differentiation of equations (5) and (6) with respect to T indicates that FP and LV are increasing in T. Thus a monitoring interval shorter than one year would imply lower values of FP and LV for any given combination of the other parameters, and the opposite for longer monitoring intervals. As a result, with a lower value of T the risk weights needed to achieve any particular targeted levels of either the probability of failure or the value of the deposit guarantor's liability would move toward zero.[14]
On the other hand, the failure probabilities and liability values used in the computations are also expressed on a per-monitoring-period basis. If the monitoring interval is shorter, policy goals almost certainly would demand lower target values of FP and LV; that is, the policy targets probably decline with T. For example, if a failure probability of two percent is acceptable over a one-year horizon then the acceptable probability within a three-month interval surely must be lower, perhaps closer to one-half of one percent. As the tables make clear, lower FP and LV targets require higher risk weights (or larger negative weights on riskless assets in the LV case). This works in the opposite direction of the parametric effect of T in the expressions for LV(σ,c) and FP(σ,c). Put differently, a reduction in T likely requires that LV and FP be smaller to meet supervisory goals, but the implicitly more frequent monitoring also reduces failure probabilities and guarantor liabilities in such a way that higher risk weights may not be necessary. The precise degree of offset is unknowable, but the conclusions are surely less sensitive to assumptions regarding T than would appear from a simple examination of the impact of T on the contingent claim model in isolation.
Footnotes
Eichberger (1992) derives an almost identical capital standard, in which the implied minimum capital ratio is a linear function of the proportional investment in risky assets, within an entirely different model. Eichberger's result differs slightly, in that both the proportional investment and the capital ratio are expressed relative to deposits rather than assets. [9]
This measure of fit weights the difference between c(σ) and cmin evenly for all values of σ between σ* and σ**. If a linear standard were implemented, however, the values of σ chosen by banks may or may not be evenly distributed over the [σ*, σ**] range used to derive asset weights. [10]
For all minimisations, the loss function integral was calculated numerically, using rectangular approximation with grid size of 0.001. [11]
For the United States, policy probably requires an LV in the range of 0.2 to 0.3 percent
of deposits, to correspond to the range of premiums charged for deposit insurance. In
that case, if risk remains at the relatively low levels observed in past studies, the
Basle risk weight of 100 percent is not far from optimal. However, if structural changes
in the industry result in banks engaging in a riskier range of activities, so that risky
assets have a standard deviation of returns around = 5 %,
then the highest risk weight should be much higher, at 200 percent or more.
[12]
Using different methods, Avery and Berger (1991) also found that a negative weight on assets in the riskless category would be optimal. [13]
The results in the tables can be reinterpreted to provide a feel for the effect of
alternate assumptions. Note that within the contingent claim model, the only way that
T appears is in the term  ; moreover, this is the
only way that σ appears. Hence if the monitoring interval is not one
year, the computational consequence is effectively to stretch or compress the
σ dimension by a factor of
; moreover, this is the
only way that σ appears. Hence if the monitoring interval is not one
year, the computational consequence is effectively to stretch or compress the
σ dimension by a factor of  . Any inferences
drawn from a case in which σ=0.10, for example, would actually correspond
to
. Any inferences
drawn from a case in which σ=0.10, for example, would actually correspond
to  . If the monitoring interval is three months rather than
one year so that T=0.25, all of the values of
. If the monitoring interval is three months rather than
one year so that T=0.25, all of the values of  and
σ** should be doubled; with a corresponding rescaling of
column headings, the figures in the tables are still valid. The policy interpretations
change, of course: if monitoring intervals are believed to be less than one year, the
higher-risk cases (such as the last two columns of the tables) probably represent
unrealistically high values of σ, and the results in the first column of
each table become much more relevant.
[14]
and
σ** should be doubled; with a corresponding rescaling of
column headings, the figures in the tables are still valid. The policy interpretations
change, of course: if monitoring intervals are believed to be less than one year, the
higher-risk cases (such as the last two columns of the tables) probably represent
unrealistically high values of σ, and the results in the first column of
each table become much more relevant.
[14]