RDP 9203: Real Exchange Rates and the Globalisation of Financial Markets Charts
March 1992
- Download the Paper 670KB
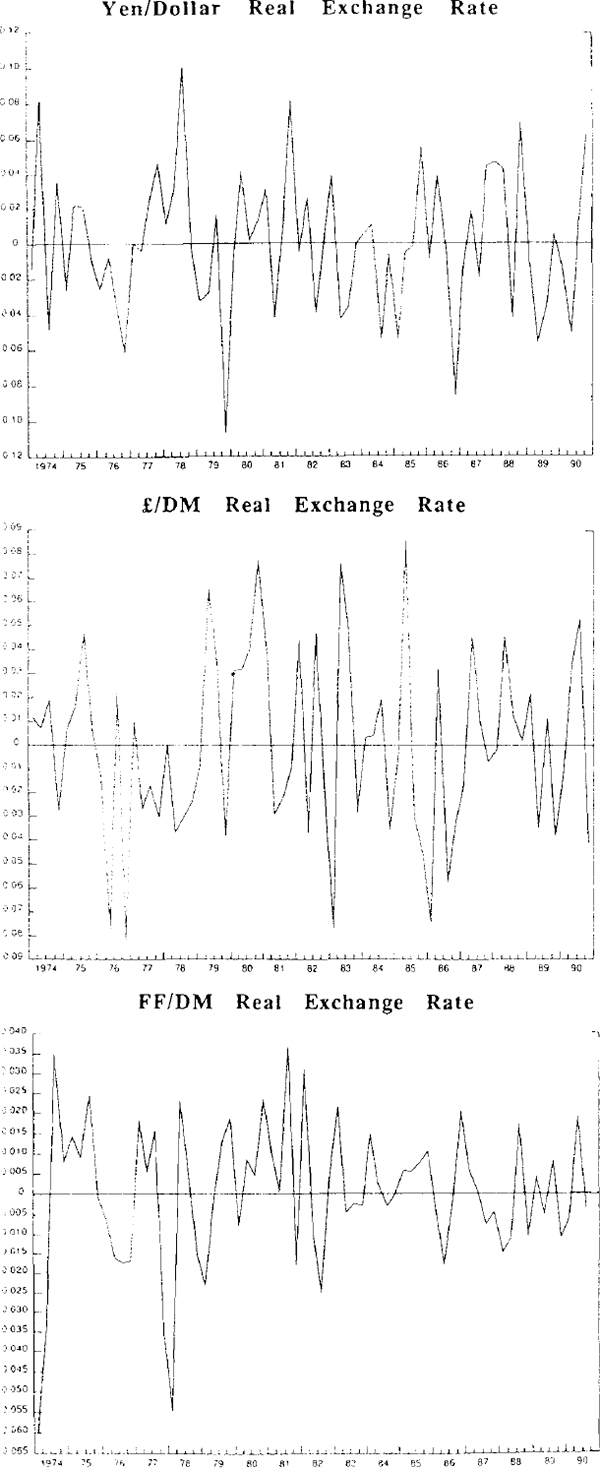
Unexplained Real Exchange Rate Movements About Equilibrium: the Cointegrating Residuals
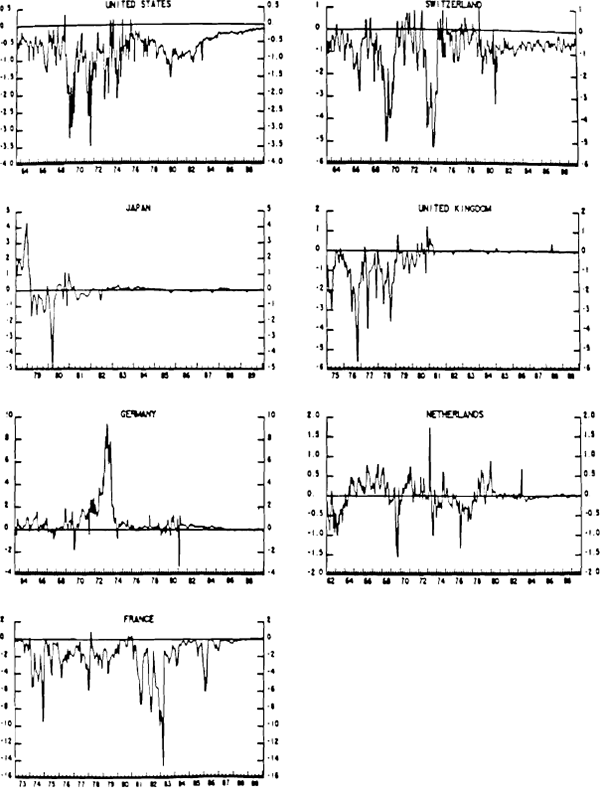
3-Month Interest Rates Differentials – on-shore deposits minus off-shore deposits
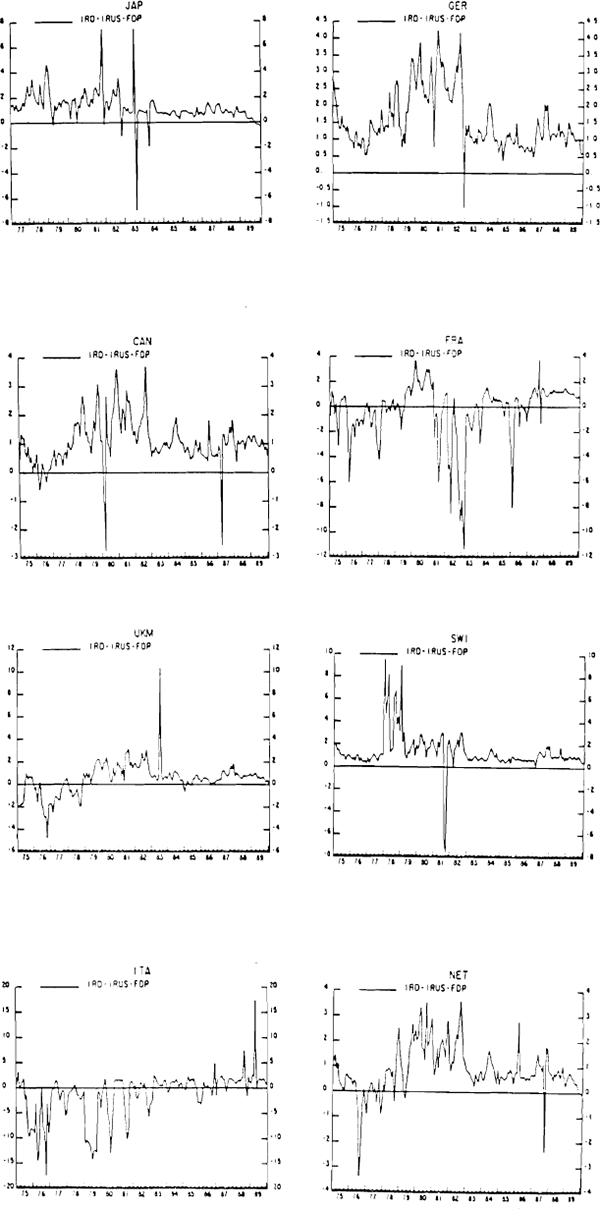
Covered Interest Disparities Using Treasury Bill Rates
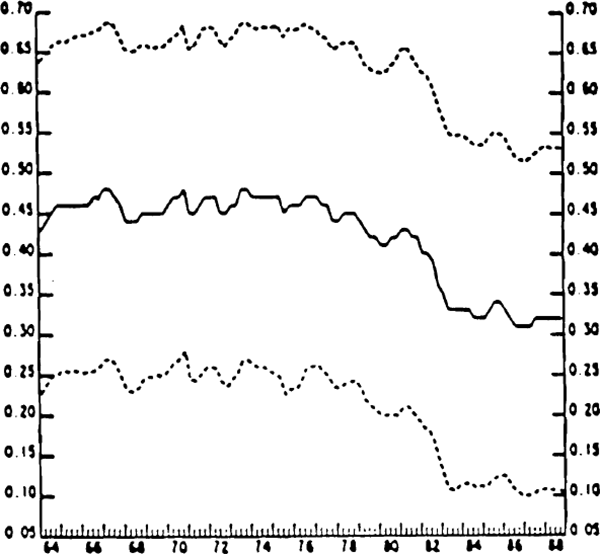
Estimated Savings-Investment Correlations: Pooled Data

where I is total non-government investment, Y is GNP/GDP, S is equal to 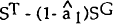 when ST
is total savings, SG is government. saving and
when ST
is total savings, SG is government. saving and  is an
estimated Ricardian effect. Estimating this equation using only cross-section data on the
countries in the sample, the United States, Japan, Germany, France, Italy, the United Kingdom, Canada, Australia and Switzerland does not yield a
sufficient number of observations to provide reliable estimates of Φ. Thus pooled
time-series-cross-section data are employed. A constant inventory of 40 observations (10
countries by 4 quarters) were maintained in the sample with quarter t's estimate of
is an
estimated Ricardian effect. Estimating this equation using only cross-section data on the
countries in the sample, the United States, Japan, Germany, France, Italy, the United Kingdom, Canada, Australia and Switzerland does not yield a
sufficient number of observations to provide reliable estimates of Φ. Thus pooled
time-series-cross-section data are employed. A constant inventory of 40 observations (10
countries by 4 quarters) were maintained in the sample with quarter t's estimate of  , obtained
by adding the quarter' s values of the relevant variables for all the countries and deleting
those for quarter t−4. The discontinuous lines represent two standard error estimates for
the
, obtained
by adding the quarter' s values of the relevant variables for all the countries and deleting
those for quarter t−4. The discontinuous lines represent two standard error estimates for
the  .
.