RDP 8709: A Note on Aggregate Investment in Australia Appendix
October 1987
- Download the Paper 431KB
| Parameters and regression statistics | Capital stocka | Capital stockb | ||
|---|---|---|---|---|
| ϕ=10 | ϕ=20 | ϕ=30 | ||
| Parameters | ||||
| γ3 | −0.002 (0.058) |
0.0006 (0.003) |
−0.0001 (0.004) |
−0.0004 (.005) |
| s | 0.074 (0.057) |
0.046 (0.025) |
0.103* (0.050) |
0.171* (.070) |
| β | 0.171* (0.073) |
0.128* (0.040) |
0.144* (0.053) |
0.166* (0.747) |
| α | 0.749* (0.064) |
0.737* (0.066) |
0.750* (0.065) |
.760* (0.066) |
| Regression statistics | ||||
| R2 | 0.91 | 0.92 | 0.91 | 0.90 |
| h | −0.96** | −1.03** | −0.98** | −0.97** |
|
a. the capital stock series based on annual estimates of capital stock, ABS
Cat#5221.0; |
||||
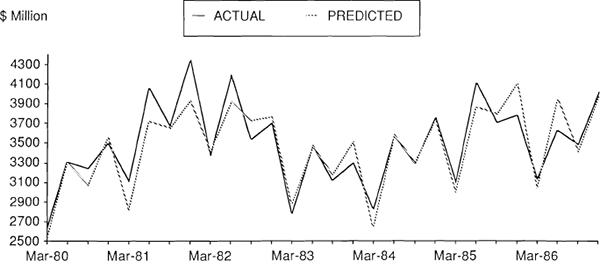
Figure 1
Gross Business Fixed Investment Expenditure
Gross Business Fixed Investment Expenditure
(1979/80 prices)